Kent County Investment Properties for Sale
Browse homes for sale and investment properties in Kent County. Refine your search by price, property type, or more.
Best cash flowing properties in Kent County
Active
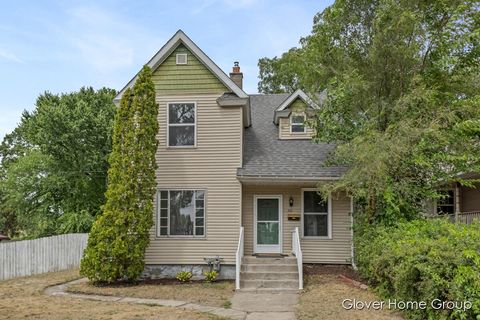
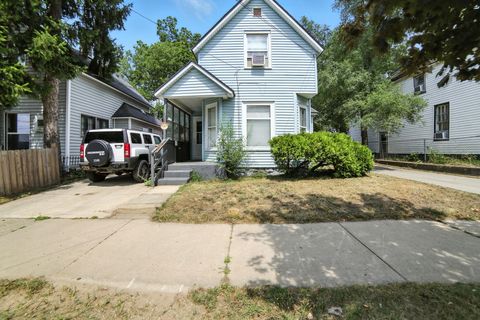
$219,900
4
bds
|
2
ba
|
2,081
sqft
|
built
1900
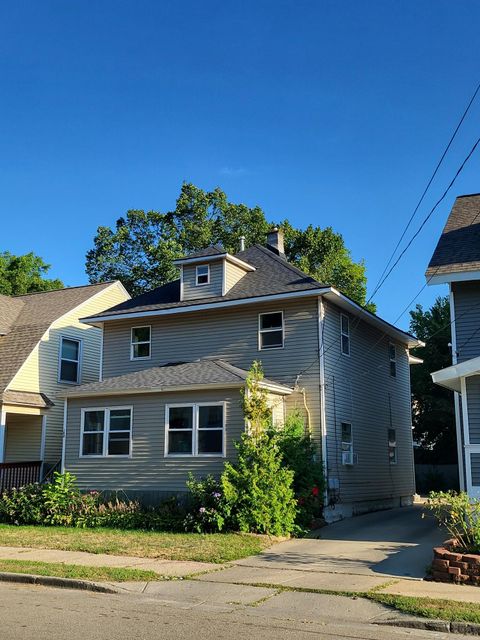
501 Delaware St SE, Grand Rapids, MI 49507
$77
Cash flow
1.8%
Cash-on-Cash Return
6.6%
Cap rate
0.9%
Rent to Value Ratio
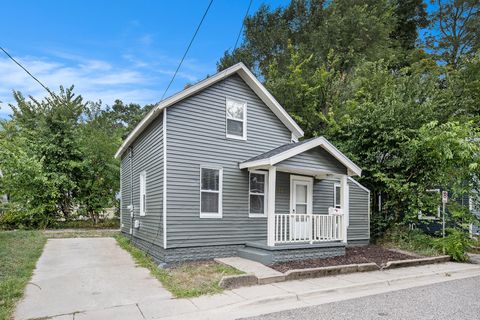
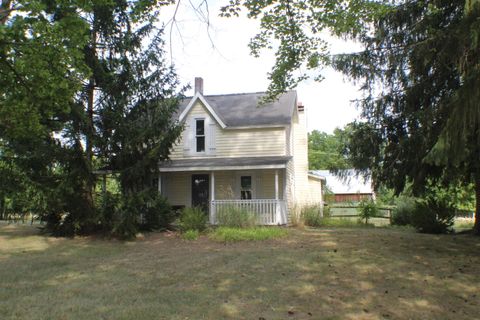
Active
$169,900
2
bds
|
1
ba
|
788
sqft
|
built
1900
33 Batavia Pl NE, Grand Rapids, MI 49503
$68
Cash flow
2.1%
Cash-on-Cash Return
6.6%
Cap rate
0.9%
Rent to Value Ratio
567 out of 636 properties for sale in Kent County
Limited Results Shown
Create a free account, or log in to reveal all property listings and enjoy the complete experience.

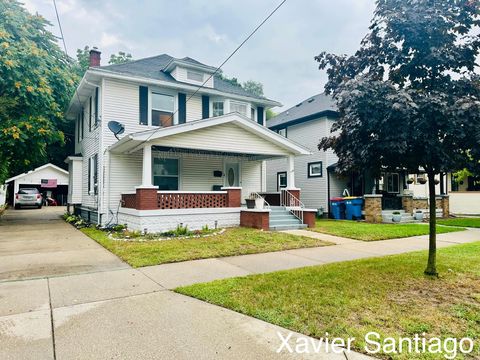
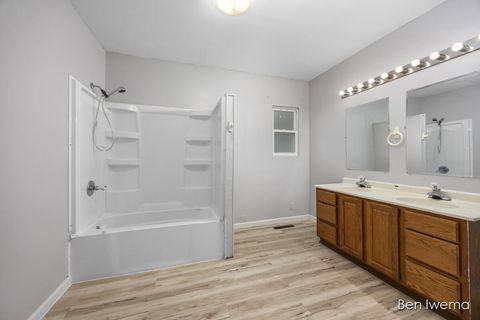
Active
$265,000
2
bds
|
1
ba
|
1,157
sqft
|
built
1937
1044 Arianna St NW, Grand Rapids, MI 49504
$-143
Cash flow
-2.8%
Cash-on-Cash Return
5.5%
Cap rate
0.8%
Rent to Value Ratio

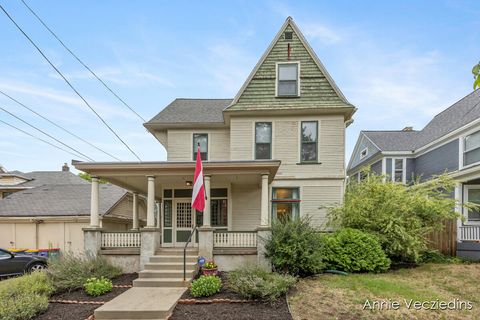
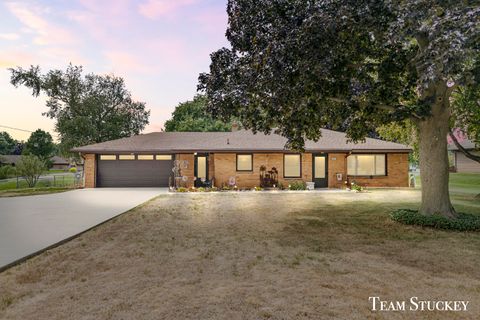
Active
$329,000
5
bds
|
2
ba
|
2,004
sqft
|
built
1921
935 Pine Ave NW, Grand Rapids, MI 49504
$-382
Cash flow
-6.1%
Cash-on-Cash Return
4.8%
Cap rate
0.7%
Rent to Value Ratio
Active
$274,999
4
bds
|
2
ba
|
1,793
sqft
|
built
1915
1139 Alexander St SE, Grand Rapids, MI 49507
$-39
Cash flow
-0.7%
Cash-on-Cash Return
6.0%
Cap rate
0.8%
Rent to Value Ratio
Active
$399,900
4
bds
|
2
ba
|
2,159
sqft
|
built
1900
811 Fairmount St SE, Grand Rapids, MI 49506
$-411
Cash flow
-5.4%
Cash-on-Cash Return
4.9%
Cap rate
0.7%
Rent to Value Ratio

Active
$469,000
4
bds
|
3
ba
|
1,720
sqft
|
built
2024
1729 Thyme Dr, Byron Center, MI 49315
$-1,107
Cash flow
-12.3%
Cash-on-Cash Return
3.3%
Cap rate
0.6%
Rent to Value Ratio
Active
$275,000
3
bds
|
2
ba
|
1,547
sqft
|
built
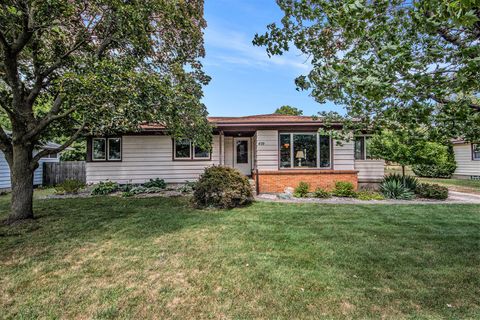
1958
459 Fendale St SE, Grand Rapids, MI 49548
$-37
Cash flow
-0.7%
Cash-on-Cash Return
6.0%
Cap rate
0.8%
Rent to Value Ratio
Active
$250,000
3
bds
|
1
ba
|
889
sqft
|
built
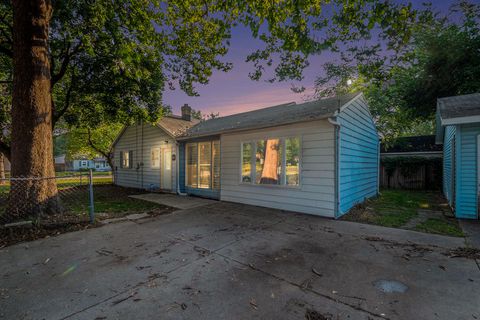
1949
960 33rd St SW, Wyoming, MI 49509
$-336
Cash flow
-7.0%
Cash-on-Cash Return
4.5%
Cap rate
0.7%
Rent to Value Ratio
Active
$385,000
4
bds
|
3
ba
|
2,473
sqft
|
built
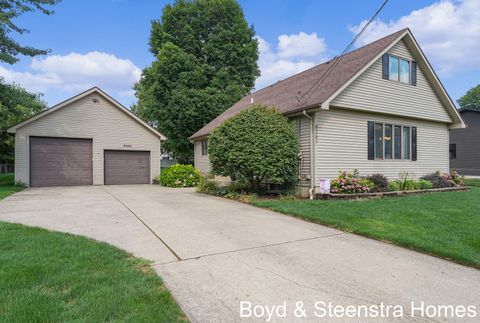
1978
8261 Merton Ave SW, Byron Center, MI 49315
$-583
Cash flow
-7.9%
Cash-on-Cash Return
4.3%
Cap rate
0.6%
Rent to Value Ratio

Active
$299,900
3
bds
|
2
ba
|
2,052
sqft
|
built
1995
1409 8th St NW, Grand Rapids, MI 49504
$-814
Cash flow
-14.2%
Cash-on-Cash Return
2.9%
Cap rate
0.7%
Rent to Value Ratio

Active
$212,000
1
bds
|
1
ba
|
620
sqft
|
built
1926
2123 Lee St SW, Wyoming, MI 49519
$-99
Cash flow
-2.4%
Cash-on-Cash Return
5.6%
Cap rate
0.8%
Rent to Value Ratio

Active
$750,000
5
bds
|
4
ba
|
3,901
sqft
|
built
1996
38 S Bridgestone Ct NE, Grand Rapids, MI 49546
$-1,627
Cash flow
-11.3%
Cash-on-Cash Return
3.5%
Cap rate
0.5%
Rent to Value Ratio
Active
$290,000
bds
|
0
ba
|
0
sqft
|
built
1910
100 Griggs St SW, Grand Rapids, MI 49507
$-248
Cash flow
-4.5%
Cash-on-Cash Return
5.1%
Cap rate
0.7%
Rent to Value Ratio
Active
$399,900
4
bds
|
2
ba
|
1,574
sqft
|
built
2004
4233 Ives Farm Ln NE, Cedar Springs, MI 49319
$-938
Cash flow
-12.2%
Cash-on-Cash Return
3.3%
Cap rate
0.6%
Rent to Value Ratio
Active
$340,000
3
bds
|
3
ba
|
2,583
sqft
|
built
1956
4785 Kalamazoo Ave SE, Kentwood, MI 49508
$-610
Cash flow
-9.4%
Cash-on-Cash Return
4.0%
Cap rate
0.7%
Rent to Value Ratio

Active
$540,000
3
bds
|
3
ba
|
2,700
sqft
|
built
1983
2311 Rothbury Ct NE, Grand Rapids, MI 49505
$-1,345
Cash flow
-13.0%
Cash-on-Cash Return
3.2%
Cap rate
0.5%
Rent to Value Ratio
Active
$365,000
4
bds
|
2
ba
|
2,980
sqft
|
built
2012
6037 16 Mile Rd NE, Cedar Springs, MI 49319
$-133
Cash flow
-1.9%
Cash-on-Cash Return
5.7%
Cap rate
0.8%
Rent to Value Ratio
Active
$359,000
2
bds
|
2
ba
|
1,957
sqft
|
built
1996
7060 Misty Morning Ct SE, Caledonia, MI 49316
$-546
Cash flow
-7.9%
Cash-on-Cash Return
4.3%
Cap rate
0.7%
Rent to Value Ratio
Active
$180,000
3
bds
|
1
ba
|
884
sqft
|
built
1890
131 Fair St SE, Grand Rapids, MI 49507
$-55
Cash flow
-1.6%
Cash-on-Cash Return
5.8%
Cap rate
0.8%
Rent to Value Ratio
Active
$285,000
2
bds
|
1
ba
|
1,325
sqft
|
built
1900
15272 White Creek Ave NE, Cedar Springs, MI 49319
$-371
Cash flow
-6.8%
Cash-on-Cash Return
4.6%
Cap rate
0.6%
Rent to Value Ratio
Active
$199,900
5
bds
|
2
ba
|
1,876
sqft
|
built
1910
605 New Ave SW, Grand Rapids, MI 49503
$-11
Cash flow
-0.3%
Cash-on-Cash Return
6.1%
Cap rate
1.0%
Rent to Value Ratio
Active
$325,000
2
bds
|
1
ba
|
1,095
sqft
|
built
1957
3955 Ivanrest Ave SW, Grandville, MI 49418
$-487
Cash flow
-7.8%
Cash-on-Cash Return
4.3%
Cap rate
0.6%
Rent to Value Ratio
Active
$599,900
5
bds
|
4
ba
|
3,346
sqft
|
built
1996
1338 Crystalaire Ct SE, Caledonia, MI 49316
$-1,242
Cash flow
-10.8%
Cash-on-Cash Return
3.7%
Cap rate
0.6%
Rent to Value Ratio
Active
$199,900
2
bds
|
1
ba
|
602
sqft
|
built
1941
2051 Collingwood Ave SW, Wyoming, MI 49519
$-81
Cash flow
-2.1%
Cash-on-Cash Return
5.7%
Cap rate
0.8%
Rent to Value Ratio
Active
$249,900
3
bds
|
3
ba
|
1,574
sqft
|
built
1976
2984 Chapshire Dr SE, Grand Rapids, MI 49546
$-507
Cash flow
-10.6%
Cash-on-Cash Return
3.7%
Cap rate
0.8%
Rent to Value Ratio
Active
$230,000
2
bds
|
2
ba
|
1,066
sqft
|
built
1980
3512 Whispering Brook Dr SE, Kentwood, MI 49508
$-471
Cash flow
-10.7%
Cash-on-Cash Return
3.7%
Cap rate
0.8%
Rent to Value Ratio
Active
$244,900
3
bds
|
2
ba
|
1,336
sqft
|
built
1971
4901 Walton Ave SW, Wyoming, MI 49548
$-204
Cash flow
-4.3%
Cash-on-Cash Return
5.1%
Cap rate
0.7%
Rent to Value Ratio

Active
$455,000
4
bds
|
3
ba
|
2,682
sqft
|
built
1961
2212 Shawnee Dr SE, Grand Rapids, MI 49506
$-757
Cash flow
-8.7%
Cash-on-Cash Return
4.2%
Cap rate
0.6%
Rent to Value Ratio
Active
$729,900
4
bds
|
4
ba
|
3,195
sqft
|
built
2002
6783 Cathedral Ct SE, Alto, MI 49302
$-1,753
Cash flow
-12.5%
Cash-on-Cash Return
3.3%
Cap rate
0.5%
Rent to Value Ratio
Active
$1,349,900
3
bds
|
3
ba
|
4,041
sqft
|
built
2022
9410 Sanborn Ave SE, Alto, MI 49302
$-5,392
Cash flow
-20.8%
Cash-on-Cash Return
1.4%
Cap rate
0.3%
Rent to Value Ratio
Active
$1,850,000
5
bds
|
5
ba
|
6,775
sqft
|
built
2004
6457 Old Darby Trl NE, Ada, MI 49301
$-8,159
Cash flow
-23.0%
Cash-on-Cash Return
0.9%
Cap rate
0.2%
Rent to Value Ratio
Active
$479,900
4
bds
|
4
ba
|
2,613
sqft
|
built
2006
3969 Murray View Dr NE, Lowell, MI 49331
$-602
Cash flow
-6.5%
Cash-on-Cash Return
4.6%
Cap rate
0.7%
Rent to Value Ratio
Active
$429,900
3
bds
|
2
ba
|
1,584
sqft
|
built
1925
3423 Coit Ave NE, Grand Rapids, MI 49525
$-647
Cash flow
-7.9%
Cash-on-Cash Return
4.3%
Cap rate
0.7%
Rent to Value Ratio

Active
$799,000
5
bds
|
4
ba
|
4,240
sqft
|
built
1996
6305 Scarborough Dr SE, Ada, MI 49301
$-2,224
Cash flow
-14.5%
Cash-on-Cash Return
2.8%
Cap rate
0.5%
Rent to Value Ratio
Active
$449,900
4
bds
|
3
ba
|
2,538
sqft
|
built
2004
516 Rock Hollow Dr NE, Rockford, MI 49341
$-905
Cash flow
-10.5%
Cash-on-Cash Return
3.7%
Cap rate
0.7%
Rent to Value Ratio
Active
$359,900
4
bds
|
3
ba
|
1,885
sqft
|
built
1966
1317 Richwood Dr SE, Grand Rapids, MI 49508
$-456
Cash flow
-6.6%
Cash-on-Cash Return
4.6%
Cap rate
0.7%
Rent to Value Ratio
Active
$379,900
3
bds
|
3
ba
|
2,268
sqft
|
built
1965
1640 Pembroke St SE, Kentwood, MI 49508
$-511
Cash flow
-7.0%
Cash-on-Cash Return
4.5%
Cap rate
0.7%
Rent to Value Ratio
Active
$735,000
4
bds
|
5
ba
|
3,491
sqft
|
built
1996
3523 Bluewater Pines Dr NE, Grand Rapids, MI 49525
$-2,092
Cash flow
-14.9%
Cash-on-Cash Return
2.7%
Cap rate
0.5%
Rent to Value Ratio

Active
$499,000
5
bds
|
3
ba
|
2,431
sqft
|
built
1981
2550 Bewell Ave SE, Lowell, MI 49331
$-991
Cash flow
-10.4%
Cash-on-Cash Return
3.8%
Cap rate
0.5%
Rent to Value Ratio