Ottawa County Investment Properties for Sale
Browse homes for sale and investment properties in Ottawa County. Refine your search by price, property type, or more.
Best cash flowing properties in Ottawa County

Active
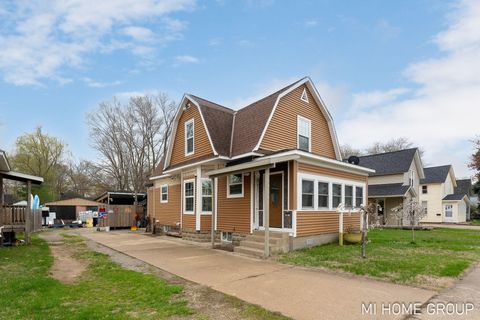
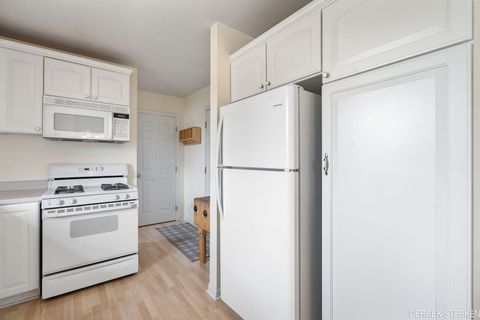
$193,000
2
bds
|
1
ba
|
1,159
sqft
|
built
1986
15330 Krueger St, Spring Lake, MI 49456
$-183
Cash flow
-4.9%
Cash-on-Cash Return
5.1%
Cap rate
1.0%
Rent to Value Ratio

Active
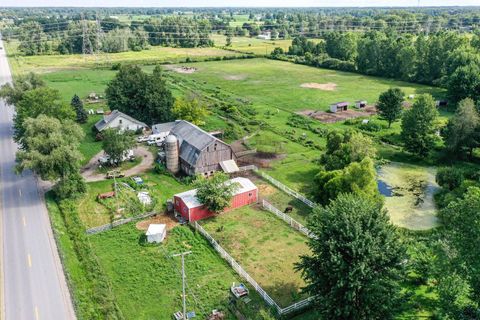
$289,000
4
bds
|
2
ba
|
1,687
sqft
|
built
1902
98 W 16th St, Holland, MI 49423
$-424
Cash flow
-7.7%
Cash-on-Cash Return
4.5%
Cap rate
0.7%
Rent to Value Ratio
194 out of 331 properties for sale in Ottawa County
Limited Results Shown
Create a free account, or log in to reveal all property listings and enjoy the complete experience.

Active
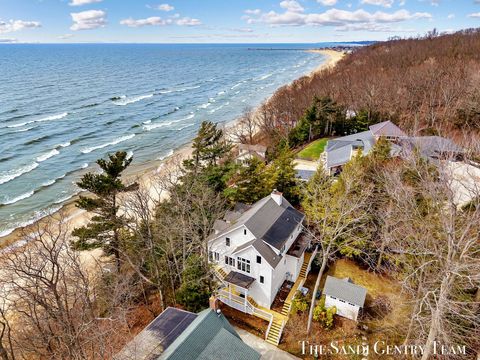
$795,000
5
bds
|
4
ba
|
4,600
sqft
|
built
2016
11325 Wake Dr, Allendale, MI 49401
$-2,697
Cash flow
-17.7%
Cash-on-Cash Return
2.2%
Cap rate
0.4%
Rent to Value Ratio
Active
$849,900
5
bds
|
5
ba
|
4,547
sqft
|
built
1993
40 Bay Circle Dr, Holland, MI 49424
$-2,554
Cash flow
-15.7%
Cash-on-Cash Return
2.7%
Cap rate
0.5%
Rent to Value Ratio

Active
$1,125,000
3
bds
|
3
ba
|
1,903
sqft
|
built
1960
16933 Royal Ave, Spring Lake, MI 49456
$-4,861
Cash flow
-22.5%
Cash-on-Cash Return
1.1%
Cap rate
0.2%
Rent to Value Ratio

Active
$825,000
3
bds
|
3
ba
|
2,035
sqft
|
built
1987
810 S Harbor Dr, Grand Haven, MI 49417
$-3,541
Cash flow
-22.4%
Cash-on-Cash Return
1.1%
Cap rate
0.5%
Rent to Value Ratio

Active
$665,000
6
bds
|
3
ba
|
2,832
sqft
|
built
1912
186 W 12th St, Holland, MI 49423
$-1,454
Cash flow
-11.4%
Cash-on-Cash Return
3.6%
Cap rate
0.5%
Rent to Value Ratio

Active
$634,500
5
bds
|
4
ba
|
3,100
sqft
|
built
2013
7313 Valhalla Dr, Hudsonville, MI 49426
$-1,661
Cash flow
-13.7%
Cash-on-Cash Return
3.1%
Cap rate
0.5%
Rent to Value Ratio

Active
$849,500
5
bds
|
4
ba
|
2,787
sqft
|
built
2022
6718 Bauer Rd, Hudsonville, MI 49426
$-1,933
Cash flow
-11.9%
Cash-on-Cash Return
3.5%
Cap rate
0.5%
Rent to Value Ratio
Active
$339,900
3
bds
|
2
ba
|
1,372
sqft
|
built
1900
316 W 13th St, Holland, MI 49423
$-596
Cash flow
-9.1%
Cash-on-Cash Return
4.2%
Cap rate
0.6%
Rent to Value Ratio
Active
$460,000
3
bds
|
1
ba
|
1,430
sqft
|
built
1920
8112 72nd Ave, Hudsonville, MI 49426
$-799
Cash flow
-9.1%
Cash-on-Cash Return
4.2%
Cap rate
0.5%
Rent to Value Ratio
Active
$304,900
2
bds
|
1
ba
|
1,108
sqft
|
built
1947
18125 174th Ave, Spring Lake, MI 49456
$-512
Cash flow
-8.8%
Cash-on-Cash Return
4.3%
Cap rate
0.6%
Rent to Value Ratio

Active
$639,000
2
bds
|
2
ba
|
967
sqft
|
built
1969
16851 Carlson St, Spring Lake, MI 49456
$-2,271
Cash flow
-18.5%
Cash-on-Cash Return
2.0%
Cap rate
0.4%
Rent to Value Ratio
Active
$664,800
4
bds
|
2
ba
|
2,240
sqft
|
built
1967
4500 Bliss St, Allendale, MI 49401
$-1,831
Cash flow
-14.4%
Cash-on-Cash Return
3.0%
Cap rate
0.4%
Rent to Value Ratio
Active
$614,900
2
bds
|
2
ba
|
1,582
sqft
|
built
2006
141 Central Ave, Holland, MI 49423
$-2,219
Cash flow
-18.8%
Cash-on-Cash Return
1.9%
Cap rate
0.5%
Rent to Value Ratio
Active
$349,900
2
bds
|
3
ba
|
2,000
sqft
|
built
1995
3076 Regency Pkwy, Zeeland, MI 49464
$-862
Cash flow
-12.9%
Cash-on-Cash Return
3.3%
Cap rate
0.6%
Rent to Value Ratio
Active
$2,290,000
6
bds
|
5
ba
|
9,090
sqft
|
built
2001
3550 64th Ave, Zeeland, MI 49464
$-10,225
Cash flow
-23.3%
Cash-on-Cash Return
0.9%
Cap rate
0.2%
Rent to Value Ratio

Active
$825,000
4
bds
|
4
ba
|
3,027
sqft
|
built
1995
8894 Lakeshore Dr, West Olive, MI 49460
$-2,219
Cash flow
-14.0%
Cash-on-Cash Return
3.0%
Cap rate
0.4%
Rent to Value Ratio

Active
$895,000
4
bds
|
4
ba
|
3,948
sqft
|
built
2006
14161 Georgian Bay Dr, Holland, MI 49424
$-2,717
Cash flow
-15.8%
Cash-on-Cash Return
2.6%
Cap rate
0.5%
Rent to Value Ratio

Active
$564,900
4
bds
|
3
ba
|
2,188
sqft
|
built
1969
16230 Woodcrest Dr, Spring Lake, MI 49456
$-1,248
Cash flow
-11.5%
Cash-on-Cash Return
3.6%
Cap rate
0.5%
Rent to Value Ratio
Active
$479,900
4
bds
|
4
ba
|
2,525
sqft
|
built
2003
1332 Fluorite Dr, Zeeland, MI 49464
$-1,132
Cash flow
-12.3%
Cash-on-Cash Return
3.4%
Cap rate
0.5%
Rent to Value Ratio

Active
$564,900
5
bds
|
4
ba
|
2,980
sqft
|
built
1999
13548 Greenbriar Dr, Grand Haven, MI 49417
$-1,411
Cash flow
-13.0%
Cash-on-Cash Return
3.3%
Cap rate
0.5%
Rent to Value Ratio

Active
$1,475,000
2
bds
|
3
ba
|
2,347
sqft
|
built
2023
159 S River Ave, Holland, MI 49423
$-8,219
Cash flow
-29.1%
Cash-on-Cash Return
-0.4%
Cap rate
0.3%
Rent to Value Ratio

Active
$1,599,999
3
bds
|
3
ba
|
3,110
sqft
|
built
2003
14788 Boom Rd, Spring Lake, MI 49456
$-6,493
Cash flow
-21.2%
Cash-on-Cash Return
1.4%
Cap rate
0.2%
Rent to Value Ratio

Active
$1,299,900
2
bds
|
3
ba
|
2,200
sqft
|
built
1991
110 N Harbor Dr, Grand Haven, MI 49417
$-5,433
Cash flow
-21.8%
Cash-on-Cash Return
1.2%
Cap rate
0.3%
Rent to Value Ratio

Active
$699,900
4
bds
|
4
ba
|
3,578
sqft
|
built
1992
921 Meadow Ridge Dr, Holland, MI 49424
$-1,739
Cash flow
-13.0%
Cash-on-Cash Return
3.3%
Cap rate
0.5%
Rent to Value Ratio
Active
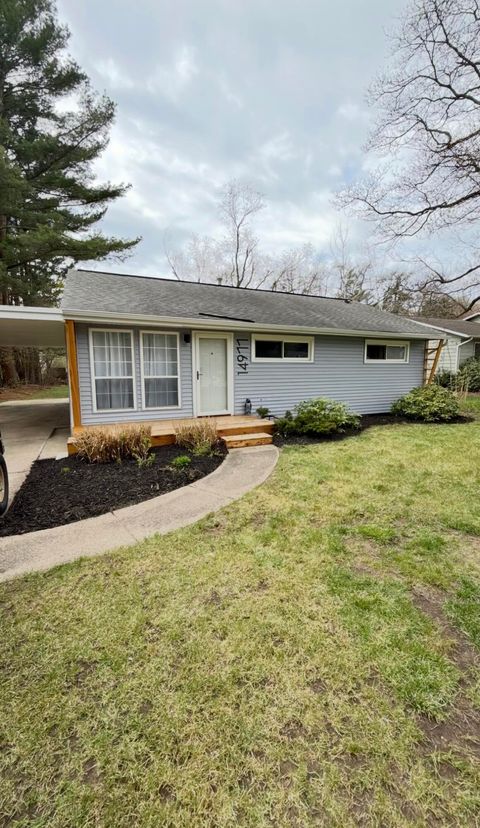
$193,000
2
bds
|
1
ba
|
1,159
sqft
|
built
1986
15330 Krueger St, Spring Lake, MI 49456
$-183
Cash flow
-4.9%
Cash-on-Cash Return
5.1%
Cap rate
1.0%
Rent to Value Ratio
Active
$550,000
4
bds
|
3
ba
|
3,038
sqft
|
built
2007
4087 Baldwin St, Hudsonville, MI 49426
$-1,408
Cash flow
-13.4%
Cash-on-Cash Return
3.2%
Cap rate
0.5%
Rent to Value Ratio

Active
$375,000
3
bds
|
3
ba
|
1,756
sqft
|
built
2018
920 W Savidge St, Spring Lake, MI 49456
$-1,198
Cash flow
-16.7%
Cash-on-Cash Return
2.4%
Cap rate
0.7%
Rent to Value Ratio

Active
$1,200,000
5
bds
|
3
ba
|
3,282
sqft
|
built
2022
2033 Ottawa Beach Rd, Holland, MI 49424
$-5,758
Cash flow
-25.0%
Cash-on-Cash Return
0.5%
Cap rate
0.3%
Rent to Value Ratio
Active
$359,000
3
bds
|
2
ba
|
1,480
sqft
|
built
1999
9415 Southwind Dr, Zeeland, MI 49464
$-706
Cash flow
-10.3%
Cash-on-Cash Return
3.9%
Cap rate
0.6%
Rent to Value Ratio
Active
$289,000
4
bds
|
2
ba
|
1,687
sqft
|
built
1902
98 W 16th St, Holland, MI 49423
$-424
Cash flow
-7.7%
Cash-on-Cash Return
4.5%
Cap rate
0.7%
Rent to Value Ratio
Active
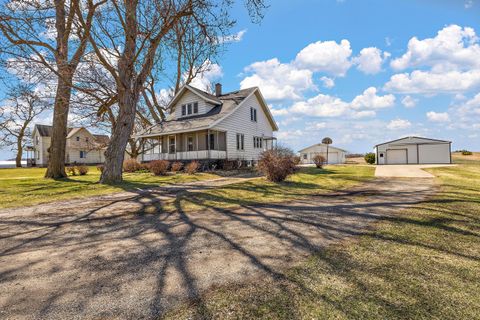
$2,150,000
4
bds
|
4
ba
|
3,072
sqft
|
built
1986
18215 Spindle Dr, Grand Haven, MI 49417
$-9,309
Cash flow
-22.6%
Cash-on-Cash Return
1.1%
Cap rate
0.1%
Rent to Value Ratio

Active
$389,900
3
bds
|
2
ba
|
1,737
sqft
|
built
1852
201 S 4th St, Grand Haven, MI 49417
$-516
Cash flow
-6.9%
Cash-on-Cash Return
4.7%
Cap rate
0.6%
Rent to Value Ratio

Active
$385,000
4
bds
|
2
ba
|
1,436
sqft
|
built
1900
520 Monroe Ave, Grand Haven, MI 49417
$-1,000
Cash flow
-13.6%
Cash-on-Cash Return
3.1%
Cap rate
0.5%
Rent to Value Ratio

Active
$995,000
5
bds
|
4
ba
|
4,353
sqft
|
built
1977
6051 Butternut Dr, West Olive, MI 49460
$-3,015
Cash flow
-15.8%
Cash-on-Cash Return
2.6%
Cap rate
0.4%
Rent to Value Ratio

Active
$326,500
3
bds
|
2
ba
|
2,039
sqft
|
built
1989
17922 Hidden Dunes Ln, Spring Lake, MI 49456
$-755
Cash flow
-12.1%
Cash-on-Cash Return
3.5%
Cap rate
0.7%
Rent to Value Ratio

Active
$365,000
2
bds
|
3
ba
|
1,235
sqft
|
built
2007
529 Miller Dr, Grand Haven, MI 49417
$-1,356
Cash flow
-19.4%
Cash-on-Cash Return
1.8%
Cap rate
0.5%
Rent to Value Ratio
Active
$349,595
3
bds
|
1
ba
|
1,008
sqft
|
built
1952
14977 Lakeshore Dr, Grand Haven, MI 49417
$-614
Cash flow
-9.2%
Cash-on-Cash Return
4.2%
Cap rate
0.6%
Rent to Value Ratio
Active
$879,900
4
bds
|
4
ba
|
4,331
sqft
|
built
1993
6340 Butternut Dr, West Olive, MI 49460
$-2,675
Cash flow
-15.9%
Cash-on-Cash Return
2.6%
Cap rate
0.5%
Rent to Value Ratio

Active
$925,000
4
bds
|
3
ba
|
3,630
sqft
|
built
2006
593 Old Macatawa Ct, Holland, MI 49423
$-3,944
Cash flow
-22.2%
Cash-on-Cash Return
1.1%
Cap rate
0.4%
Rent to Value Ratio
Active
$369,900
4
bds
|
1
ba
|
1,731
sqft
|
built
1920
2729 32nd Ave, Hudsonville, MI 49426
$-503
Cash flow
-7.1%
Cash-on-Cash Return
4.6%
Cap rate
0.6%
Rent to Value Ratio