Ottawa County Investment Properties for Sale
Browse homes for sale and investment properties in Ottawa County. Refine your search by price, property type, or more.
Best cash flowing properties in Ottawa County

Active
$289,000
4
bds
|
2
ba
|
1,687
sqft
|
built
1902
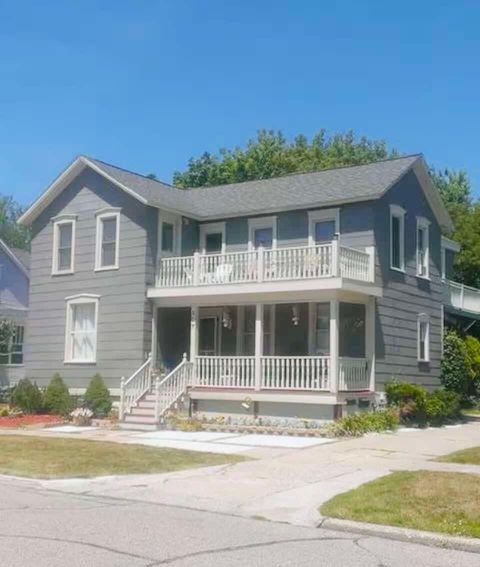
98 W 16th St, Holland, MI 49423
$-424
Cash flow
-7.7%
Cash-on-Cash Return
4.5%
Cap rate
0.7%
Rent to Value Ratio
Active
$369,900
4
bds
|
1
ba
|
1,731
sqft
|
built
1920
2729 32nd Ave, Hudsonville, MI 49426
$-503
Cash flow
-7.1%
Cash-on-Cash Return
4.6%
Cap rate
0.6%
Rent to Value Ratio
206 out of 325 properties for sale in Ottawa County
Limited Results Shown
Create a free account, or log in to reveal all property listings and enjoy the complete experience.
Active
$359,000
3
bds
|
2
ba
|
1,480
sqft
|
built
1999
9415 Southwind Dr, Zeeland, MI 49464
$-706
Cash flow
-10.3%
Cash-on-Cash Return
3.9%
Cap rate
0.6%
Rent to Value Ratio
Active
$289,000
4
bds
|
2
ba
|
1,687
sqft
|
built
1902
98 W 16th St, Holland, MI 49423
$-424
Cash flow
-7.7%
Cash-on-Cash Return
4.5%
Cap rate
0.7%
Rent to Value Ratio
Active
$2,150,000
4
bds
|
4
ba
|
3,072
sqft
|
built
1986
18215 Spindle Dr, Grand Haven, MI 49417
$-9,309
Cash flow
-22.6%
Cash-on-Cash Return
1.1%
Cap rate
0.1%
Rent to Value Ratio

Active
$389,900
3
bds
|
2
ba
|
1,737
sqft
|
built
1852
201 S 4th St, Grand Haven, MI 49417
$-516
Cash flow
-6.9%
Cash-on-Cash Return
4.7%
Cap rate
0.6%
Rent to Value Ratio

Active
$385,000
4
bds
|
2
ba
|
1,436
sqft
|
built
1900
520 Monroe Ave, Grand Haven, MI 49417
$-1,000
Cash flow
-13.6%
Cash-on-Cash Return
3.1%
Cap rate
0.5%
Rent to Value Ratio

Active
$995,000
5
bds
|
4
ba
|
4,353
sqft
|
built
1977
6051 Butternut Dr, West Olive, MI 49460
$-3,015
Cash flow
-15.8%
Cash-on-Cash Return
2.6%
Cap rate
0.4%
Rent to Value Ratio

Active
$326,500
3
bds
|
2
ba
|
2,039
sqft
|
built
1989
17922 Hidden Dunes Ln, Spring Lake, MI 49456
$-755
Cash flow
-12.1%
Cash-on-Cash Return
3.5%
Cap rate
0.7%
Rent to Value Ratio

Active
$365,000
2
bds
|
3
ba
|
1,235
sqft
|
built
2007
529 Miller Dr, Grand Haven, MI 49417
$-1,356
Cash flow
-19.4%
Cash-on-Cash Return
1.8%
Cap rate
0.5%
Rent to Value Ratio
Active
$349,595
3
bds
|
1
ba
|
1,008
sqft
|
built
1952
14977 Lakeshore Dr, Grand Haven, MI 49417
$-614
Cash flow
-9.2%
Cash-on-Cash Return
4.2%
Cap rate
0.6%
Rent to Value Ratio
Active
$879,900
4
bds
|
4
ba
|
4,331
sqft
|
built
1993
6340 Butternut Dr, West Olive, MI 49460
$-2,675
Cash flow
-15.9%
Cash-on-Cash Return
2.6%
Cap rate
0.5%
Rent to Value Ratio

Active
$925,000
4
bds
|
3
ba
|
3,630
sqft
|
built
2006
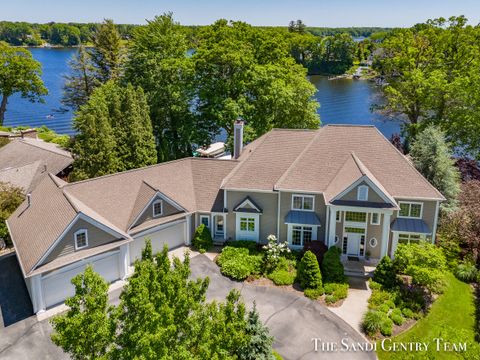
593 Old Macatawa Ct, Holland, MI 49423
$-3,944
Cash flow
-22.2%
Cash-on-Cash Return
1.1%
Cap rate
0.4%
Rent to Value Ratio
Active
$369,900
4
bds
|
1
ba
|
1,731
sqft
|
built
1920
2729 32nd Ave, Hudsonville, MI 49426
$-503
Cash flow
-7.1%
Cash-on-Cash Return
4.6%
Cap rate
0.6%
Rent to Value Ratio
Active
$1,299,000
4
bds
|
2
ba
|
1,946
sqft
|
built
1900
16631 Lakeview St, Spring Lake, MI 49456
$-3,756
Cash flow
-15.1%
Cash-on-Cash Return
2.8%
Cap rate
0.4%
Rent to Value Ratio
Active
$625,000
4
bds
|
2
ba
|
1,922
sqft
|
built
1989
2333 Eagle Dr, Holland, MI 49424
$-1,614
Cash flow
-13.5%
Cash-on-Cash Return
3.2%
Cap rate
0.4%
Rent to Value Ratio
Active
$1,470,000
5
bds
|
5
ba
|
4,037
sqft
|
built
2021
484 8th Ave SW, Byron Center, MI 49315
$-6,137
Cash flow
-21.8%
Cash-on-Cash Return
1.3%
Cap rate
0.2%
Rent to Value Ratio
Active
$775,000
3
bds
|
2
ba
|
1,551
sqft
|
built
1897
1200 Beach Dr, Holland, MI 49423
$-2,674
Cash flow
-18.0%
Cash-on-Cash Return
2.1%
Cap rate
0.5%
Rent to Value Ratio

Active
$506,000
4
bds
|
4
ba
|
3,831
sqft
|
built
1987
18642 Pawnee Dr, Spring Lake, MI 49456
$-561
Cash flow
-5.8%
Cash-on-Cash Return
4.9%
Cap rate
0.7%
Rent to Value Ratio

Active
$1,100,000
4
bds
|
4
ba
|
2,244
sqft
|
built
1996
19148 Maiden Ln, Spring Lake, MI 49456
$-4,924
Cash flow
-23.4%
Cash-on-Cash Return
0.9%
Cap rate
0.4%
Rent to Value Ratio
Active
$369,000
3
bds
|
2
ba
|
1,917
sqft
|
built
1957
311 W 32nd St, Holland, MI 49423
$-901
Cash flow
-12.7%
Cash-on-Cash Return
3.3%
Cap rate
0.6%
Rent to Value Ratio
Active
$415,000
1
bds
|
2
ba
|
1,322
sqft
|
built
2006
29 E 6th St, Holland, MI 49423
$-1,440
Cash flow
-18.1%
Cash-on-Cash Return
2.1%
Cap rate
0.6%
Rent to Value Ratio

Active
$279,900
2
bds
|
1
ba
|
1,000
sqft
|
built
1983
14200 Green St, Grand Haven, MI 49417
$-632
Cash flow
-11.8%
Cash-on-Cash Return
3.6%
Cap rate
0.6%
Rent to Value Ratio

Active
$884,900
5
bds
|
5
ba
|
4,314
sqft
|
built
2003
16659 Adler Dr, West Olive, MI 49460
$-2,508
Cash flow
-14.8%
Cash-on-Cash Return
2.9%
Cap rate
0.4%
Rent to Value Ratio

Active
$689,900
2
bds
|
3
ba
|
1,647
sqft
|
built
2023
300 Washington Ave, Grand Haven, MI 49417
$-2,530
Cash flow
-19.1%
Cash-on-Cash Return
1.9%
Cap rate
0.5%
Rent to Value Ratio

Active
$1,394,500
4
bds
|
4
ba
|
4,145
sqft
|
built
2022
49 Howard Ave, Grand Haven, MI 49417
$-5,093
Cash flow
-19.1%
Cash-on-Cash Return
1.9%
Cap rate
0.4%
Rent to Value Ratio
Active
$2,750,000
5
bds
|
6
ba
|
3,629
sqft
|
built
2023
16976 Lake Ave, West Olive, MI 49460
$-11,300
Cash flow
-21.4%
Cash-on-Cash Return
1.3%
Cap rate
0.3%
Rent to Value Ratio
Active
$5,995,000
4
bds
|
9
ba
|
14,415
sqft
|
built
2001
1933 S Shore Dr, Holland, MI 49423
$-31,481
Cash flow
-27.4%
Cash-on-Cash Return
0.0%
Cap rate
0.1%
Rent to Value Ratio

Active
$679,900
4
bds
|
0
ba
|
0
sqft
|
built
1980
108 Lafayette Ave, Grand Haven, MI 49417
$-2,755
Cash flow
-21.1%
Cash-on-Cash Return
1.4%
Cap rate
0.4%
Rent to Value Ratio
Active
$369,900
2
bds
|
2
ba
|
1,304
sqft
|
built
2006
917 W Savidge St, Spring Lake, MI 49456
$-1,152
Cash flow
-16.2%
Cash-on-Cash Return
2.5%
Cap rate
0.6%
Rent to Value Ratio
Active
$450,000
2
bds
|
1
ba
|
1,241
sqft
|
built
1969
17550 Doric St, Spring Lake, MI 49456
$-855
Cash flow
-9.9%
Cash-on-Cash Return
4.0%
Cap rate
0.6%
Rent to Value Ratio
Active
$319,999
2
bds
|
2
ba
|
2,550
sqft
|
built
1954
172 E 25th St, Holland, MI 49423
$-618
Cash flow
-10.1%
Cash-on-Cash Return
3.9%
Cap rate
0.6%
Rent to Value Ratio
Active
$309,000
2
bds
|
1
ba
|
942
sqft
|
built
1989
17512 N Fruitport Rd, Spring Lake, MI 49456
$-822
Cash flow
-13.9%
Cash-on-Cash Return
3.1%
Cap rate
0.7%
Rent to Value Ratio
Active
$2,495,900
7
bds
|
7
ba
|
7,826
sqft
|
built
2000
16076 Highland Dr, Spring Lake, MI 49456
$-10,044
Cash flow
-21.0%
Cash-on-Cash Return
1.4%
Cap rate
0.3%
Rent to Value Ratio
Active
$511,900
4
bds
|
2
ba
|
2,015
sqft
|
built
1901
207 Elliott Ave, Grand Haven, MI 49417
$-882
Cash flow
-9.0%
Cash-on-Cash Return
4.2%
Cap rate
0.6%
Rent to Value Ratio
Active
$389,900
3
bds
|
3
ba
|
1,848
sqft
|
built
1994
16905 Highland Ave, Spring Lake, MI 49456
$-685
Cash flow
-9.2%
Cash-on-Cash Return
4.2%
Cap rate
0.6%
Rent to Value Ratio

Active
$660,000
4
bds
|
3
ba
|
2,407
sqft
|
built
1871
1130 S Shore Dr, Holland, MI 49423
$-1,623
Cash flow
-12.8%
Cash-on-Cash Return
3.3%
Cap rate
0.5%
Rent to Value Ratio
Active
$975,000
7
bds
|
4
ba
|
3,409
sqft
|
built
2022
16500 Haven Woods Ct, West Olive, MI 49460
$-2,411
Cash flow
-12.9%
Cash-on-Cash Return
3.3%
Cap rate
0.5%
Rent to Value Ratio
Active
$3,499,900
5
bds
|
7
ba
|
5,435
sqft
|
built
2019
1819 S Shore Dr, Holland, MI 49423
$-17,295
Cash flow
-25.8%
Cash-on-Cash Return
0.3%
Cap rate
0.2%
Rent to Value Ratio

Active
$1,595,000
4
bds
|
3
ba
|
2,798
sqft
|
built
1999
585 Crescent Dr, Holland, MI 49423
$-5,999
Cash flow
-19.6%
Cash-on-Cash Return
1.8%
Cap rate
0.3%
Rent to Value Ratio
Active
$625,000
3
bds
|
3
ba
|
2,904
sqft
|
built
1992
2187 Riley St, Hudsonville, MI 49426
$-1,662
Cash flow
-13.9%
Cash-on-Cash Return
3.1%
Cap rate
0.5%
Rent to Value Ratio

Active
$650,000
3
bds
|
2
ba
|
1,734
sqft
|
built
1920
16248 Warner St, Grand Haven, MI 49417
$-1,995
Cash flow
-16.0%
Cash-on-Cash Return
2.6%
Cap rate
0.4%
Rent to Value Ratio