Ottawa County Investment Properties for Sale
Browse homes for sale and investment properties in Ottawa County. Refine your search by price, property type, or more.
Best cash flowing properties in Ottawa County

Active
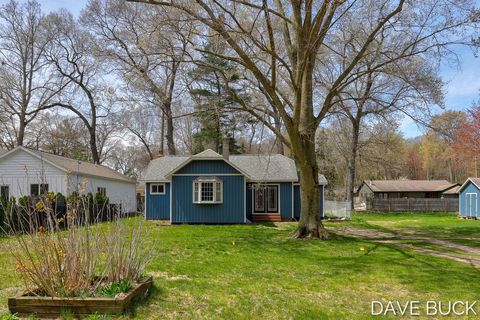
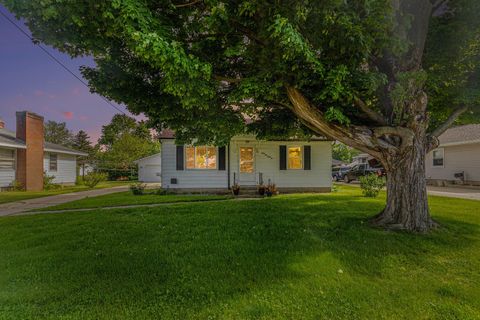
$265,000
4
bds
|
2
ba
|
2,603
sqft
|
built
1911
13 W 17th St, Holland, MI 49423
$-145
Cash flow
-2.9%
Cash-on-Cash Return
5.6%
Cap rate
0.8%
Rent to Value Ratio
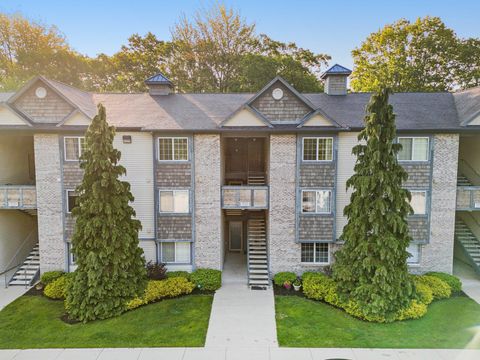
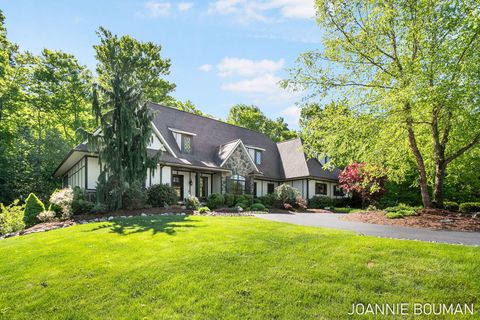
Active
$257,400
3
bds
|
1
ba
|
1,080
sqft
|
built
1920
15242 152nd Ave, Spring Lake, MI 49456
$-216
Cash flow
-4.4%
Cash-on-Cash Return
5.3%
Cap rate
0.9%
Rent to Value Ratio
194 out of 331 properties for sale in Ottawa County
Limited Results Shown
Create a free account, or log in to reveal all property listings and enjoy the complete experience.
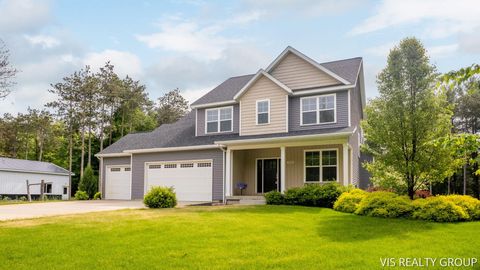
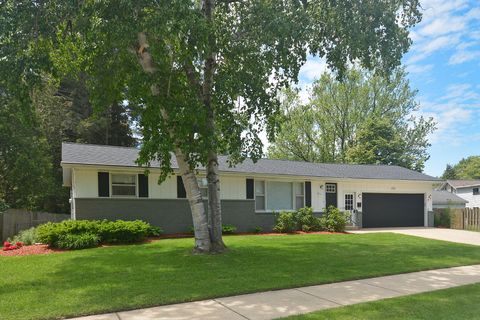
Active
$214,900
2
bds
|
1
ba
|
910
sqft
|
built
2001
18372 N Ridge Ct, Spring Lake, MI 49456
$-354
Cash flow
-8.6%
Cash-on-Cash Return
4.3%
Cap rate
0.7%
Rent to Value Ratio

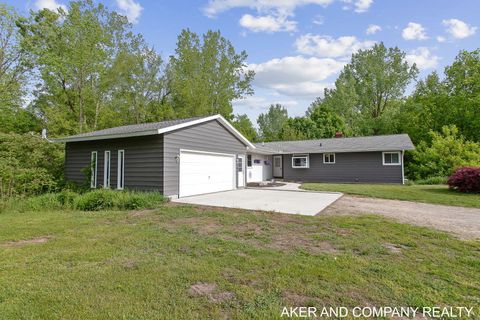
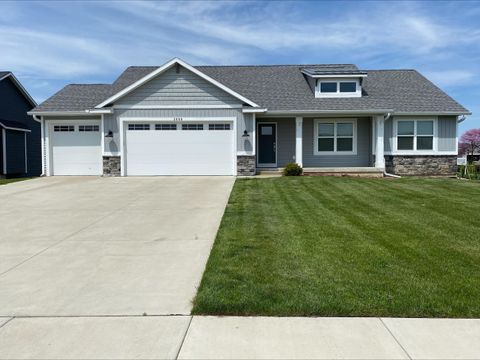
Active
$289,000
2
bds
|
2
ba
|
1,660
sqft
|
built
2003
302 Northeast Xing, Holland, MI 49423
$-712
Cash flow
-12.9%
Cash-on-Cash Return
3.3%
Cap rate
0.7%
Rent to Value Ratio

Active
$549,900
4
bds
|
3
ba
|
2,609
sqft
|
built
1997
2103 Woodlark Dr, Holland, MI 49424
$-1,290
Cash flow
-12.2%
Cash-on-Cash Return
3.5%
Cap rate
0.6%
Rent to Value Ratio
Active
$599,900
5
bds
|
4
ba
|
3,488
sqft
|
built
2015
9340 Freedom Dr, West Olive, MI 49460
$-1,050
Cash flow
-9.1%
Cash-on-Cash Return
4.2%
Cap rate
0.6%
Rent to Value Ratio

Active
$869,000
4
bds
|
3
ba
|
3,612
sqft
|
built
2018
13944 Harrington Lndg, Holland, MI 49424
$-3,093
Cash flow
-18.6%
Cash-on-Cash Return
2.0%
Cap rate
0.5%
Rent to Value Ratio

Active
$2,350,000
6
bds
|
4
ba
|
5,400
sqft
|
built
1965
945 N Baywood Dr, Holland, MI 49424
$-9,998
Cash flow
-22.2%
Cash-on-Cash Return
1.2%
Cap rate
0.2%
Rent to Value Ratio

Active
$369,900
2
bds
|
2
ba
|
1,454
sqft
|
built
1989
19151 Pine Grove Ct, Spring Lake, MI 49456
$-658
Cash flow
-9.3%
Cash-on-Cash Return
4.1%
Cap rate
0.6%
Rent to Value Ratio

Active
$479,900
4
bds
|
2
ba
|
2,084
sqft
|
built
2003
11185 Stanton St, West Olive, MI 49460
$-1,244
Cash flow
-13.5%
Cash-on-Cash Return
3.2%
Cap rate
0.5%
Rent to Value Ratio

Active
$599,900
3
bds
|
3
ba
|
2,966
sqft
|
built
1965
16507 Sleeper St, Grand Haven, MI 49417
$-1,666
Cash flow
-14.5%
Cash-on-Cash Return
2.9%
Cap rate
0.4%
Rent to Value Ratio

Active
$239,900
1
bds
|
1
ba
|
950
sqft
|
built
2000
335 Nestlewood Dr, Holland, MI 49424
$-540
Cash flow
-11.7%
Cash-on-Cash Return
3.6%
Cap rate
0.7%
Rent to Value Ratio
Active
$455,000
4
bds
|
2
ba
|
2,213
sqft
|
built
1957
8091 Warner St, Allendale, MI 49401
$-784
Cash flow
-9.0%
Cash-on-Cash Return
4.2%
Cap rate
0.6%
Rent to Value Ratio
Active
$257,400
3
bds
|
1
ba
|
1,080
sqft
|
built
1920
15242 152nd Ave, Spring Lake, MI 49456
$-216
Cash flow
-4.4%
Cash-on-Cash Return
5.3%
Cap rate
0.9%
Rent to Value Ratio

Active
$540,000
4
bds
|
3
ba
|
2,059
sqft
|
built
2020
14716 Arcadia Woods Dr, Spring Lake, MI 49456
$-1,444
Cash flow
-14.0%
Cash-on-Cash Return
2.9%
Cap rate
0.5%
Rent to Value Ratio
Active
$329,900
3
bds
|
2
ba
|
1,660
sqft
|
built
1955
3486 Oak St, Hudsonville, MI 49426
$-653
Cash flow
-10.3%
Cash-on-Cash Return
3.9%
Cap rate
0.6%
Rent to Value Ratio
Active
$999,900
5
bds
|
5
ba
|
4,113
sqft
|
built
2010
15611 River Woods, West Olive, MI 49460
$-3,550
Cash flow
-18.5%
Cash-on-Cash Return
2.0%
Cap rate
0.4%
Rent to Value Ratio

Active
$2,950,000
6
bds
|
8
ba
|
9,031
sqft
|
built
1998
19128 Rosemary Rd, Spring Lake, MI 49456
$-13,500
Cash flow
-23.9%
Cash-on-Cash Return
0.8%
Cap rate
0.2%
Rent to Value Ratio

Active
$492,400
4
bds
|
3
ba
|
1,874
sqft
|
built
2002
14956 Briarwood St, Grand Haven, MI 49417
$-958
Cash flow
-10.2%
Cash-on-Cash Return
3.9%
Cap rate
0.5%
Rent to Value Ratio
Active
$469,500
5
bds
|
2
ba
|
1,977
sqft
|
built
1969
222 S Park St, Zeeland, MI 49464
$-1,511
Cash flow
-16.8%
Cash-on-Cash Return
2.4%
Cap rate
0.5%
Rent to Value Ratio
Active
$578,000
4
bds
|
3
ba
|
2,747
sqft
|
built
2022
3699 Teton Dr, Hudsonville, MI 49426
$-1,530
Cash flow
-13.8%
Cash-on-Cash Return
3.1%
Cap rate
0.5%
Rent to Value Ratio
Active
$845,000
5
bds
|
4
ba
|
2,941
sqft
|
built
2021
104 River Hills Dr, Holland, MI 49424
$-3,099
Cash flow
-19.1%
Cash-on-Cash Return
1.9%
Cap rate
0.4%
Rent to Value Ratio
Active
$614,900
4
bds
|
2
ba
|
1,830
sqft
|
built
1950
3329 120th Ave, Holland, MI 49424
$-1,278
Cash flow
-10.8%
Cash-on-Cash Return
3.8%
Cap rate
0.5%
Rent to Value Ratio
Active
$499,900
4
bds
|
3
ba
|
3,100
sqft
|
built
1996
4524 Hidden Ridge Dr, Hudsonville, MI 49426
$-1,170
Cash flow
-12.2%
Cash-on-Cash Return
3.5%
Cap rate
0.6%
Rent to Value Ratio

Active
$478,500
4
bds
|
4
ba
|
2,159
sqft
|
built
2022
7584 Ridgeline Dr, Zeeland, MI 49464
$-1,121
Cash flow
-12.2%
Cash-on-Cash Return
3.5%
Cap rate
0.6%
Rent to Value Ratio
Active
$1,250,000
3
bds
|
3
ba
|
2,732
sqft
|
built
2018
225 Janes View Dr, Holland, MI 49424
$-5,826
Cash flow
-24.3%
Cash-on-Cash Return
0.7%
Cap rate
0.3%
Rent to Value Ratio

Active
$2,600,000
6
bds
|
6
ba
|
6,100
sqft
|
built
1993
15919 Orchard Point Dr, Spring Lake, MI 49456
$-11,819
Cash flow
-23.7%
Cash-on-Cash Return
0.8%
Cap rate
0.2%
Rent to Value Ratio
Active
$359,900
4
bds
|
3
ba
|
1,766
sqft
|
built
1955
3550 Oak St, Hudsonville, MI 49426
$-587
Cash flow
-8.5%
Cash-on-Cash Return
4.3%
Cap rate
0.6%
Rent to Value Ratio
Active
$769,900
5
bds
|
4
ba
|
3,732
sqft
|
built
2021
1509 Ponstein Dr, Hudsonville, MI 49426
$-1,801
Cash flow
-12.2%
Cash-on-Cash Return
3.5%
Cap rate
0.6%
Rent to Value Ratio
Active
$995,000
3
bds
|
3
ba
|
2,650
sqft
|
built
1986
16928 Landing Dr, Spring Lake, MI 49456
$-4,151
Cash flow
-21.8%
Cash-on-Cash Return
1.3%
Cap rate
0.3%
Rent to Value Ratio

Active
$649,900
3
bds
|
3
ba
|
3,655
sqft
|
built
1996
16173 Dana Ln, Grand Haven, MI 49417
$-1,577
Cash flow
-12.7%
Cash-on-Cash Return
3.4%
Cap rate
0.4%
Rent to Value Ratio
Active
$265,000
4
bds
|
2
ba
|
2,603
sqft
|
built
1911
13 W 17th St, Holland, MI 49423
$-145
Cash flow
-2.9%
Cash-on-Cash Return
5.6%
Cap rate
0.8%
Rent to Value Ratio
Active
$399,900
7
bds
|
3
ba
|
2,064
sqft
|
built
1977
17653 Hiawatha Dr, Spring Lake, MI 49456
$-834
Cash flow
-10.9%
Cash-on-Cash Return
3.8%
Cap rate
0.6%
Rent to Value Ratio
Active
$1,355,000
5
bds
|
6
ba
|
6,732
sqft
|
built
2006
10543 Lakeshore Dr, West Olive, MI 49460
$-4,949
Cash flow
-19.1%
Cash-on-Cash Return
1.9%
Cap rate
0.3%
Rent to Value Ratio

Active
$474,900
4
bds
|
2
ba
|
1,780
sqft
|
built
1940
17270 Taft Rd, Spring Lake, MI 49456
$-853
Cash flow
-9.4%
Cash-on-Cash Return
4.1%
Cap rate
0.6%
Rent to Value Ratio
Active
$1,289,000
3
bds
|
4
ba
|
2,475
sqft
|
built
1930
5011 Rosabelle Beach Ave, Holland, MI 49424
$-5,031
Cash flow
-20.4%
Cash-on-Cash Return
1.6%
Cap rate
0.3%
Rent to Value Ratio

Active
$1,500,000
3
bds
|
3
ba
|
2,576
sqft
|
built
1971
127 Emmet St, Grand Haven, MI 49417
$-6,408
Cash flow
-22.3%
Cash-on-Cash Return
1.1%
Cap rate
0.3%
Rent to Value Ratio
Active
$839,900
4
bds
|
3
ba
|
3,376
sqft
|
built
2016
1109 Kenowa Ave SW, Byron Center, MI 49315
$-2,589
Cash flow
-16.1%
Cash-on-Cash Return
2.6%
Cap rate
0.4%
Rent to Value Ratio

Active
$759,000
4
bds
|
2
ba
|
2,536
sqft
|
built
1963
16040 Robrick Ave, Grand Haven, MI 49417
$-2,667
Cash flow
-18.3%
Cash-on-Cash Return
2.0%
Cap rate
0.3%
Rent to Value Ratio
Active
$1,690,000
5
bds
|
3
ba
|
3,400
sqft
|
built
1890
18957 N Fruitport Rd, Spring Lake, MI 49456
$-6,397
Cash flow
-19.7%
Cash-on-Cash Return
1.7%
Cap rate
0.4%
Rent to Value Ratio

Active
$299,999
3
bds
|
1
ba
|
1,052
sqft
|
built
1872
69 W 13th St, Holland, MI 49423
$-487
Cash flow
-8.5%
Cash-on-Cash Return
4.3%
Cap rate
0.6%
Rent to Value Ratio

Active
$650,000
3
bds
|
1
ba
|
1,226
sqft
|
built
1963
12429 Lincoln St, Grand Haven, MI 49417
$-2,501
Cash flow
-20.1%
Cash-on-Cash Return
1.6%
Cap rate
0.3%
Rent to Value Ratio