Miami Beach, FL Investment Properties for Sale
Browse homes for sale and investment properties in Miami Beach, FL. Refine your search by price, property type, or more.
Best cash flowing properties in Miami Beach, FL
Active
$200,000
1
bds
|
1
ba
|
730
sqft
|
built
1948
1275 Marseille Dr, Miami Beach, FL 33141
$228
Cash flow
5.9%
Cash-on-Cash Return
7.5%
Cap rate
1.1%
Rent to Value Ratio

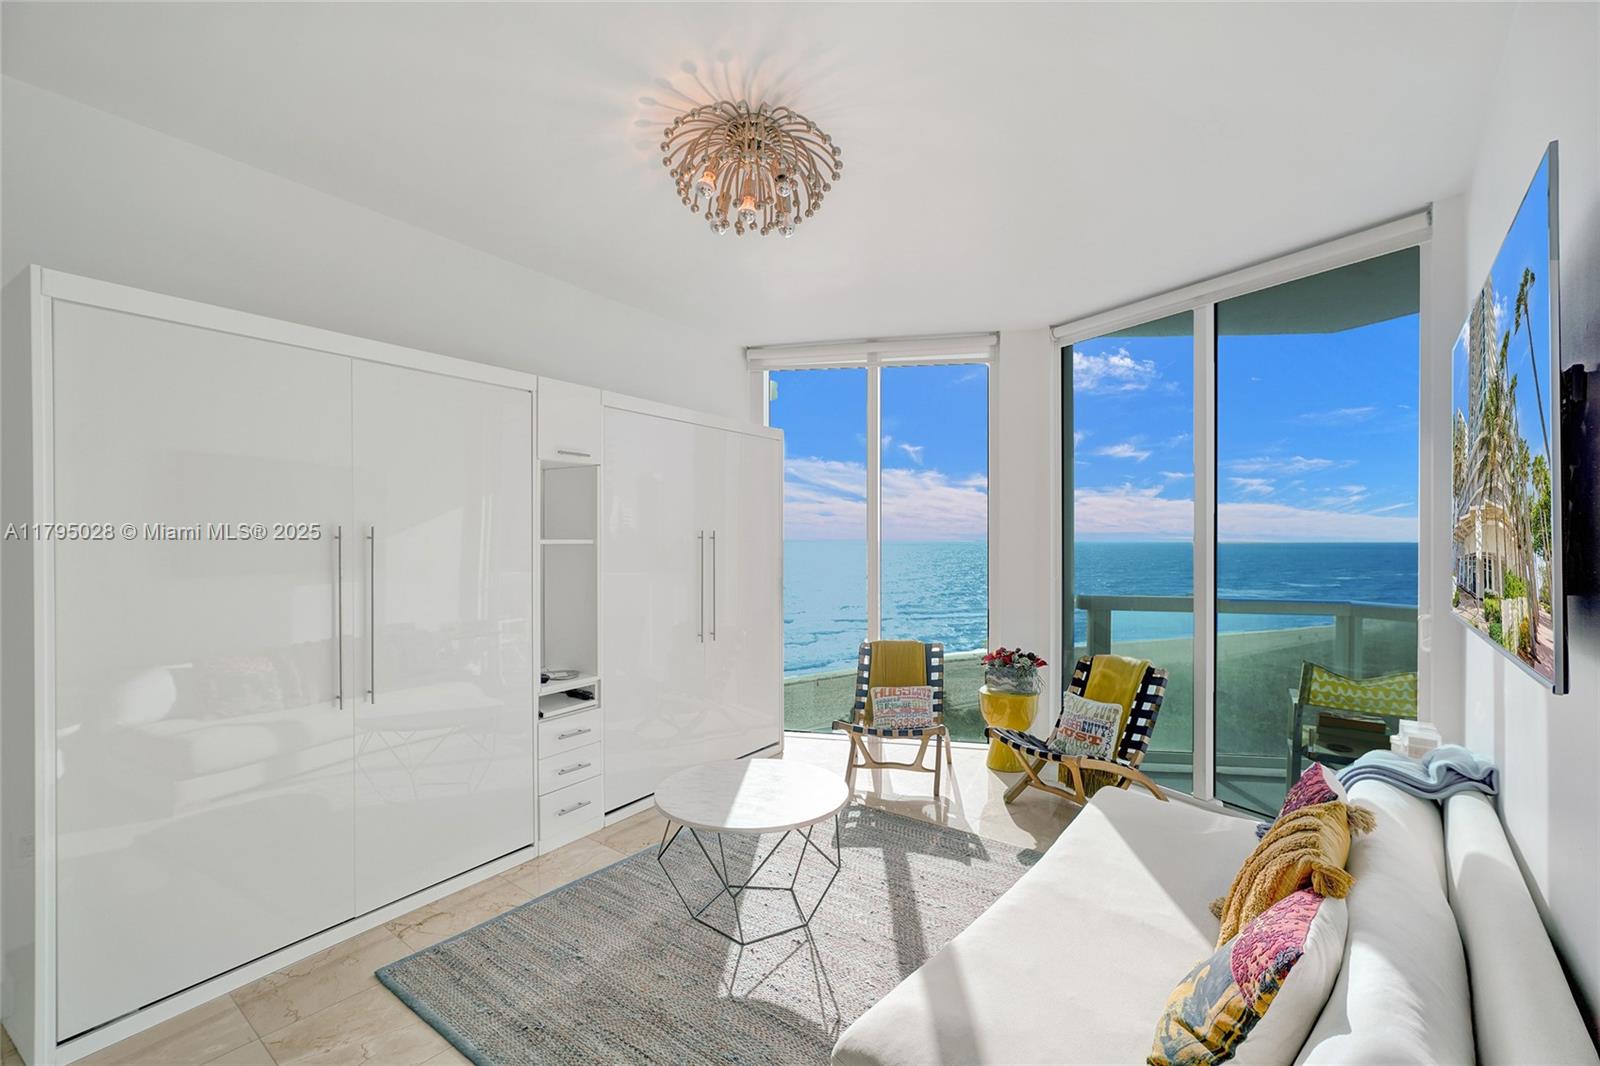
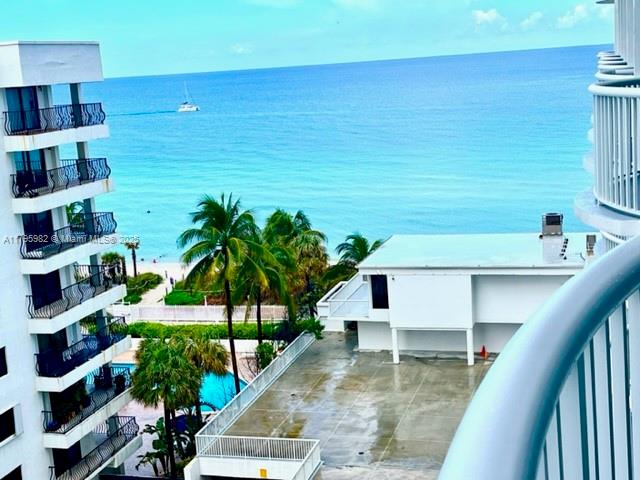
Active
$850,000
2
bds
|
2
ba
|
1,035
sqft
|
built
2008
6799 Collins Ave, Miami Beach, FL 33141
$36
Cash flow
0.2%
Cash-on-Cash Return
6.2%
Cap rate
0.9%
Rent to Value Ratio
1,961 out of 2,163 properties for sale in Miami Beach, FL
Limited Results Shown
Create a free account, or log in to reveal all property listings and enjoy the complete experience.
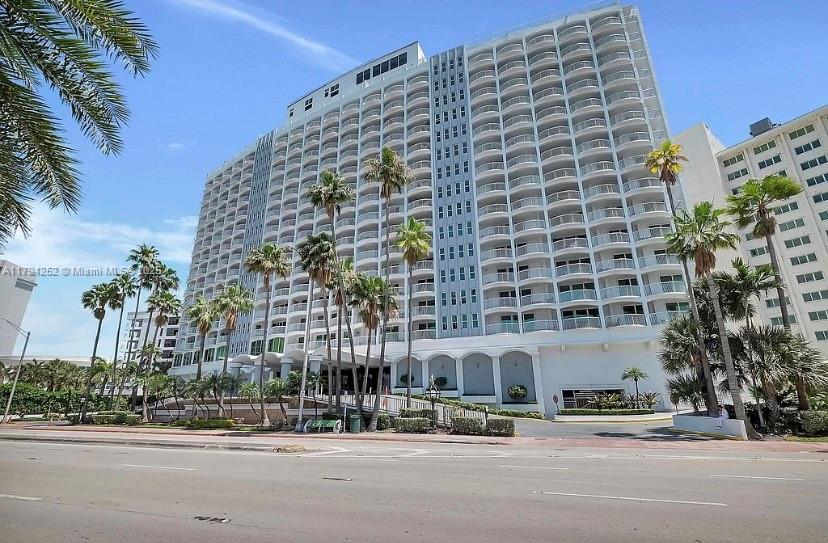
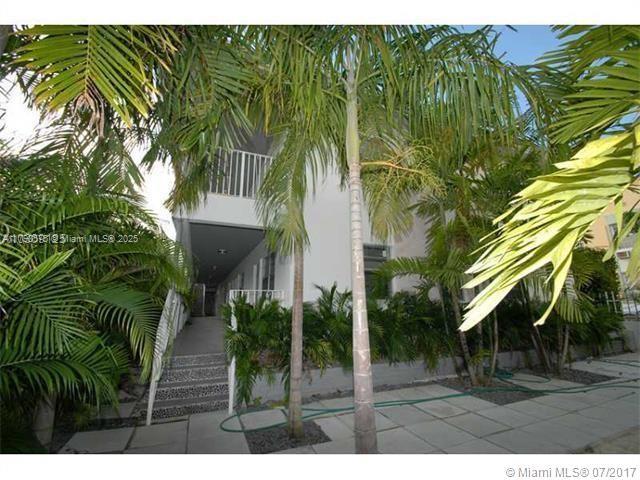
Active
$710,000
2
bds
|
2
ba
|
887
sqft
|
built
2008
6801 Collins Ave, Miami Beach, FL 33141
$-4,194
Cash flow
-30.8%
Cash-on-Cash Return
-0.9%
Cap rate
0.7%
Rent to Value Ratio

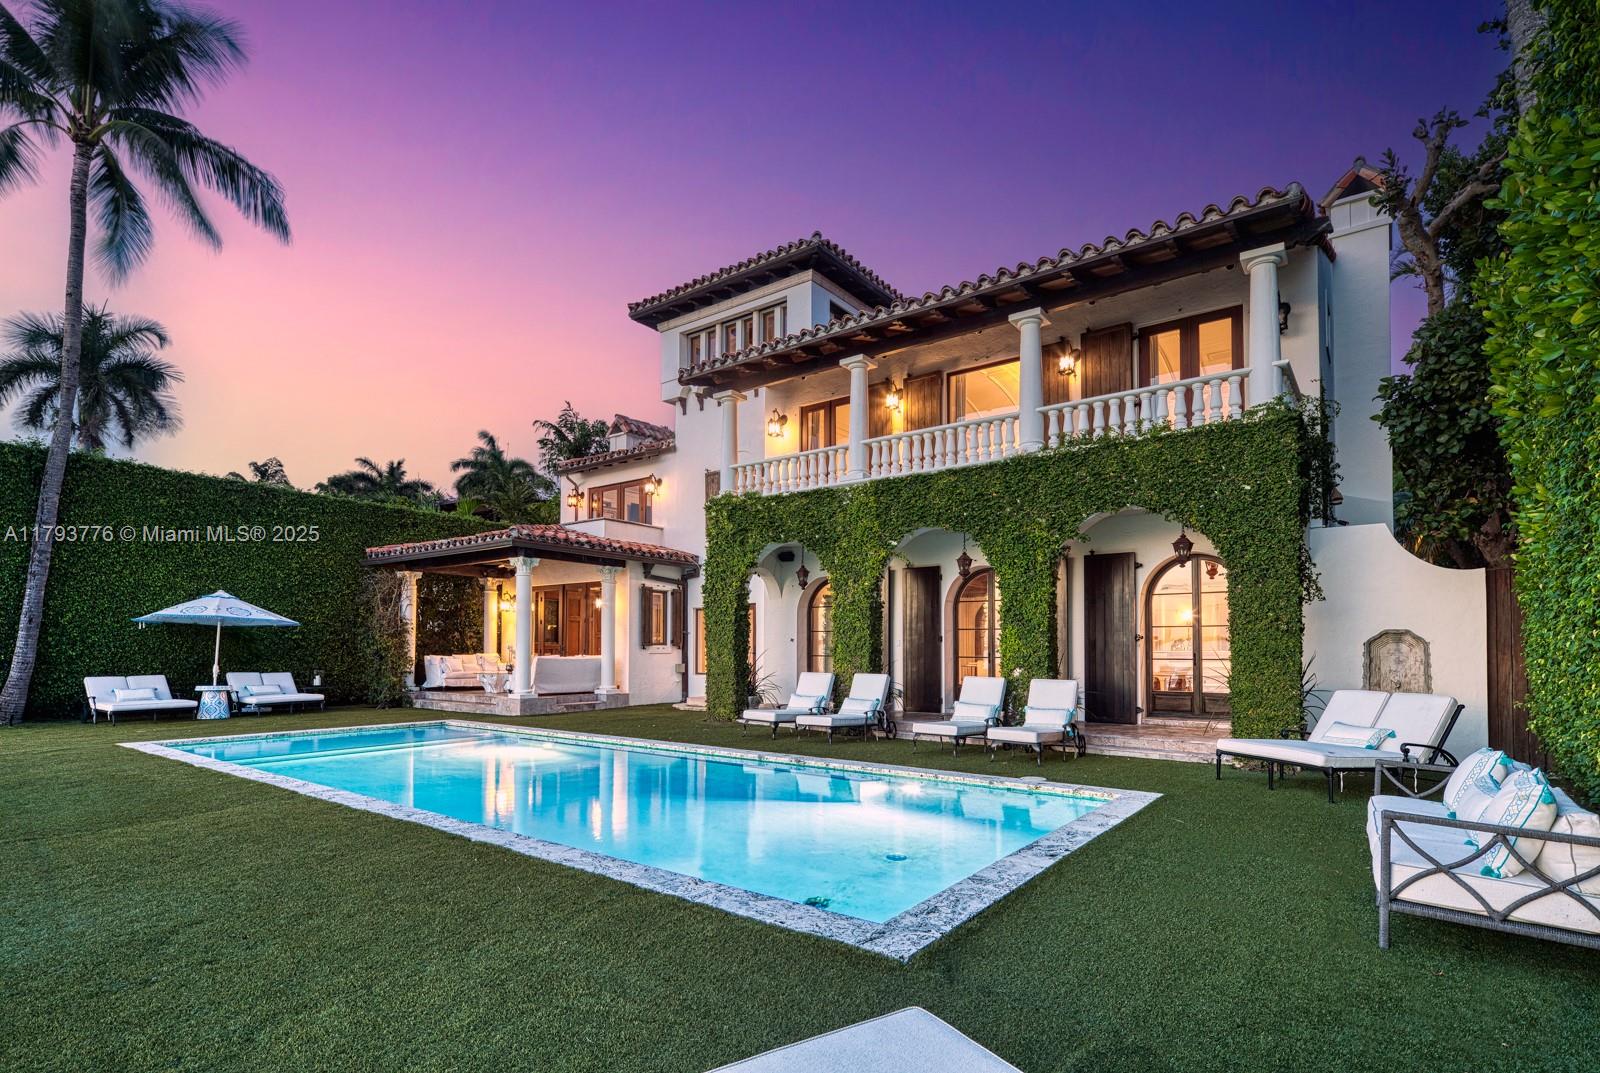
Active
$2,475,000
3
bds
|
2
ba
|
1,550
sqft
|
built
1997
1900 Purdy Ave, Miami Beach, FL 33139
$-10,245
Cash flow
-21.6%
Cash-on-Cash Return
1.2%
Cap rate
0.4%
Rent to Value Ratio
Active
$850,000
2
bds
|
2
ba
|
1,035
sqft
|
built
2008
6799 Collins Ave, Miami Beach, FL 33141
$36
Cash flow
0.2%
Cash-on-Cash Return
6.2%
Cap rate
0.9%
Rent to Value Ratio
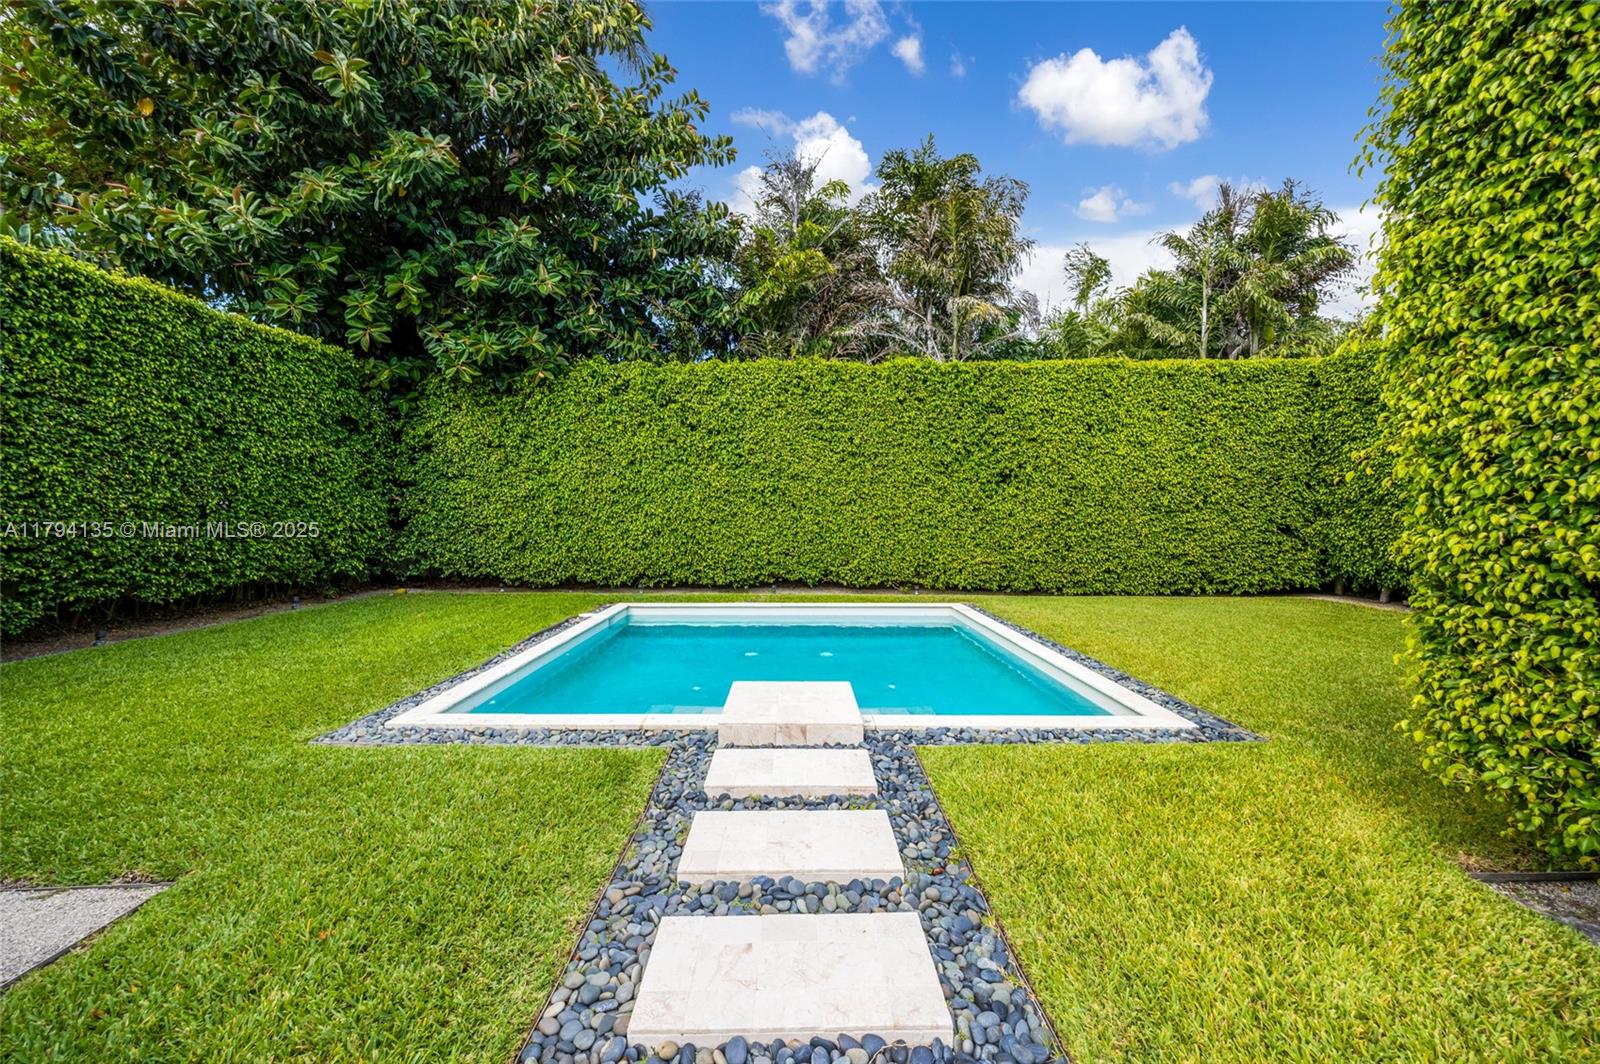
Active
$585,000
2
bds
|
2
ba
|
1,190
sqft
|
built
1967
5600 Collins Ave, Miami Beach, FL 33140
$-2,342
Cash flow
-20.9%
Cash-on-Cash Return
1.3%
Cap rate
0.6%
Rent to Value Ratio
Active
$589,000
1
bds
|
1
ba
|
659
sqft
|
built
1970
401 Ocean Dr, Miami Beach, FL 33139
$-1,476
Cash flow
-13.1%
Cash-on-Cash Return
3.1%
Cap rate
0.8%
Rent to Value Ratio

Active
$1,700,000
2
bds
|
2
ba
|
1,280
sqft
|
built
2006
3801 Collins Ave, Miami Beach, FL 33140
$-6,712
Cash flow
-20.6%
Cash-on-Cash Return
1.4%
Cap rate
0.5%
Rent to Value Ratio
Active
$1,849,000
3
bds
|
4
ba
|
2,367
sqft
|
built
2006
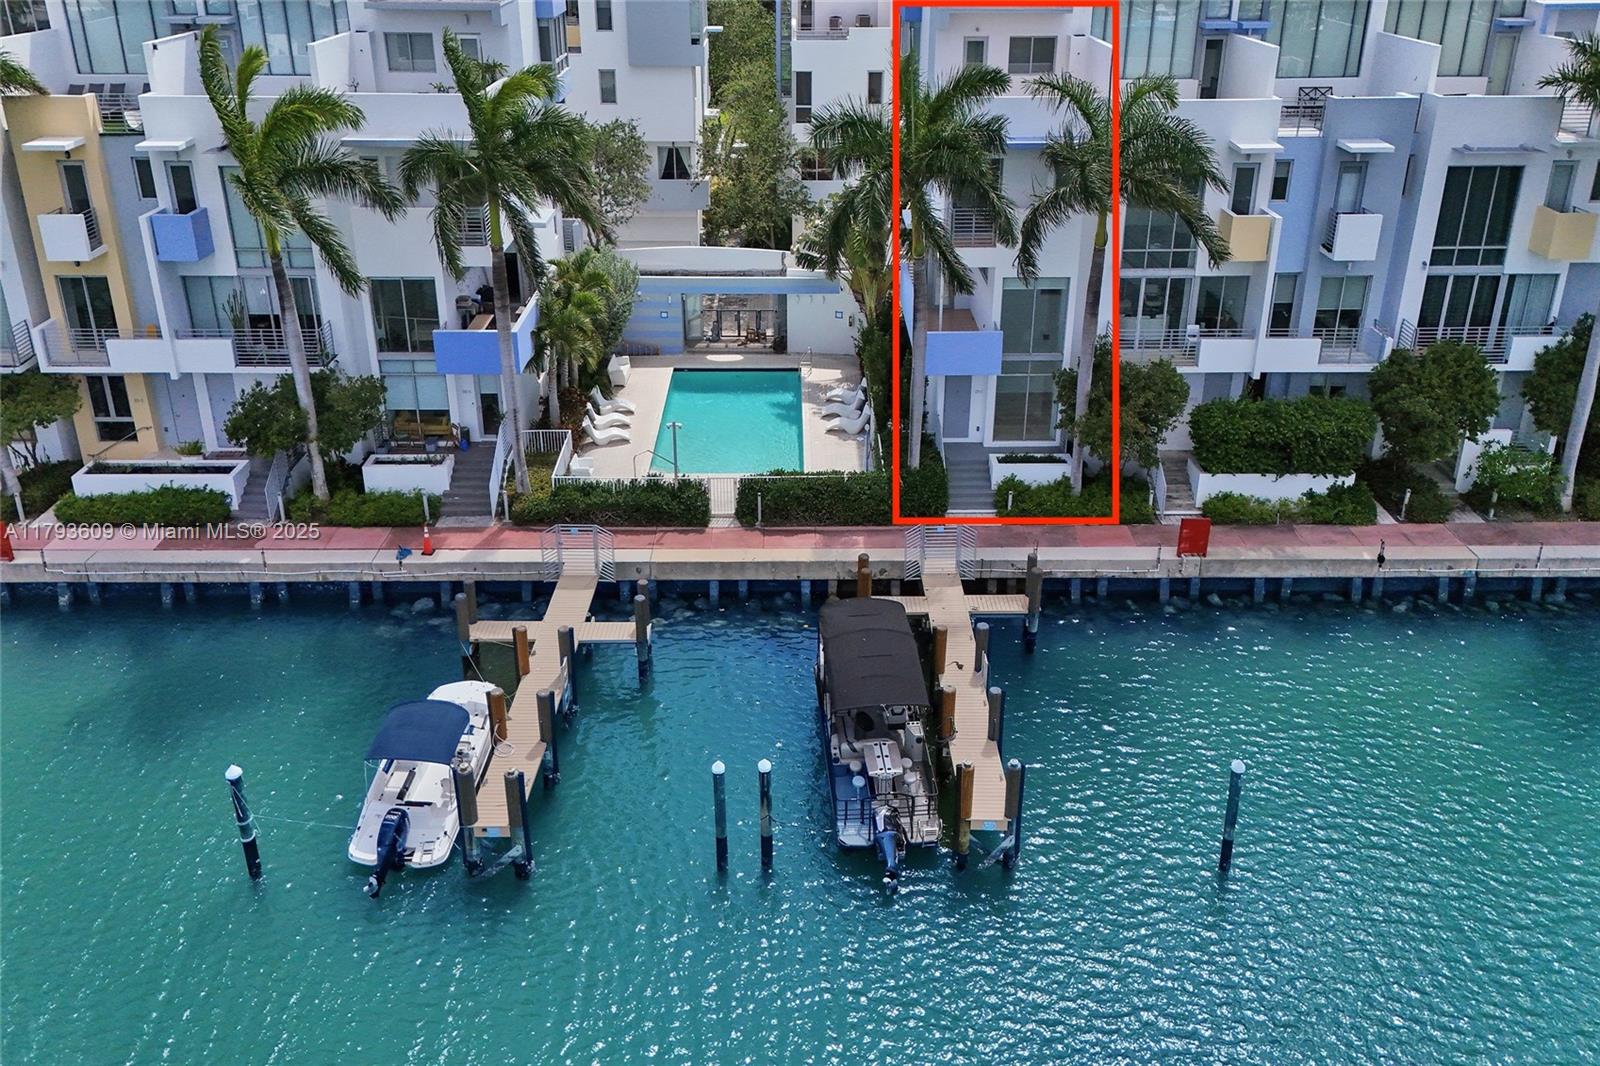
171 N Shore Dr, Miami Beach, FL 33141
$-6,873
Cash flow
-19.4%
Cash-on-Cash Return
1.7%
Cap rate
0.4%
Rent to Value Ratio
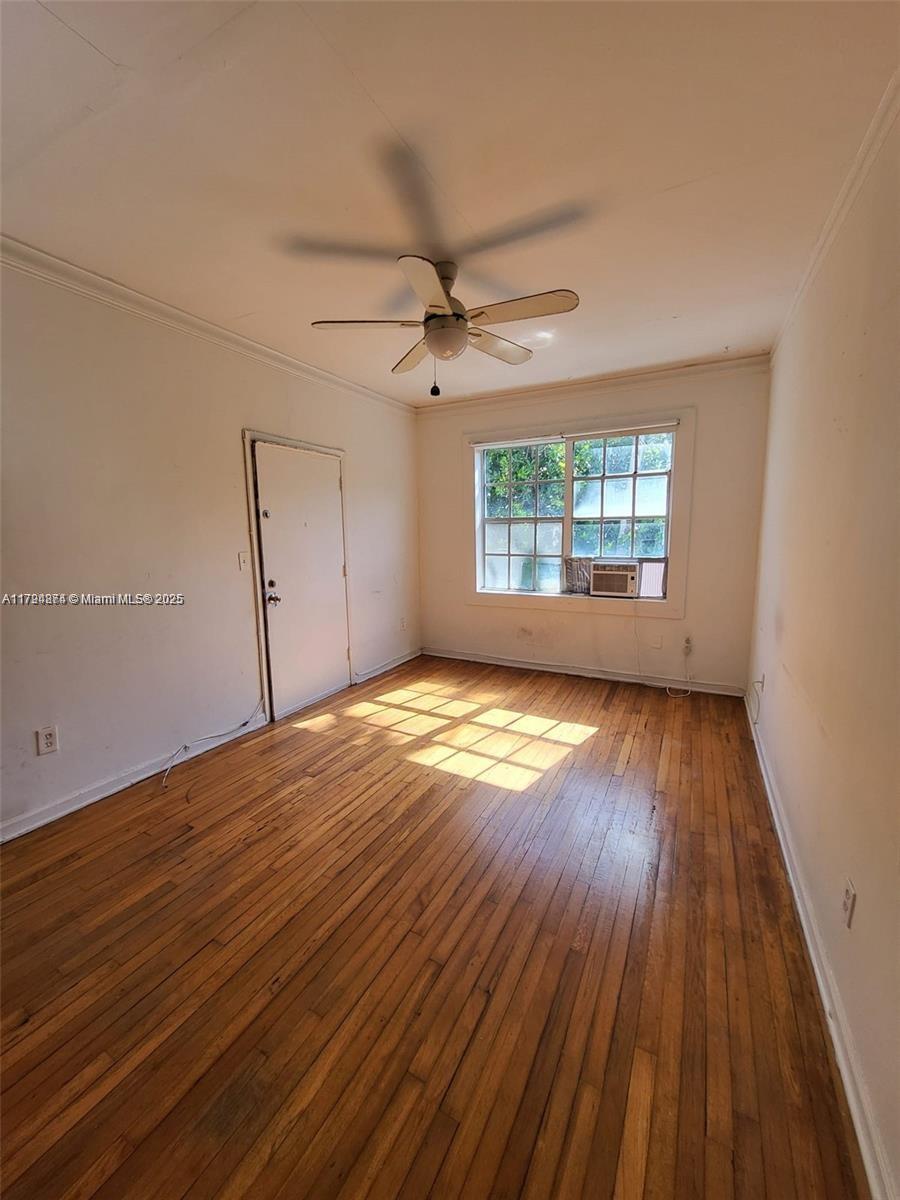
Active
$265,000
1
bds
|
1
ba
|
700
sqft
|
built
1938
1611 Michigan Ave, Miami Beach, FL 33139
$-524
Cash flow
-10.3%
Cash-on-Cash Return
3.8%
Cap rate
0.9%
Rent to Value Ratio

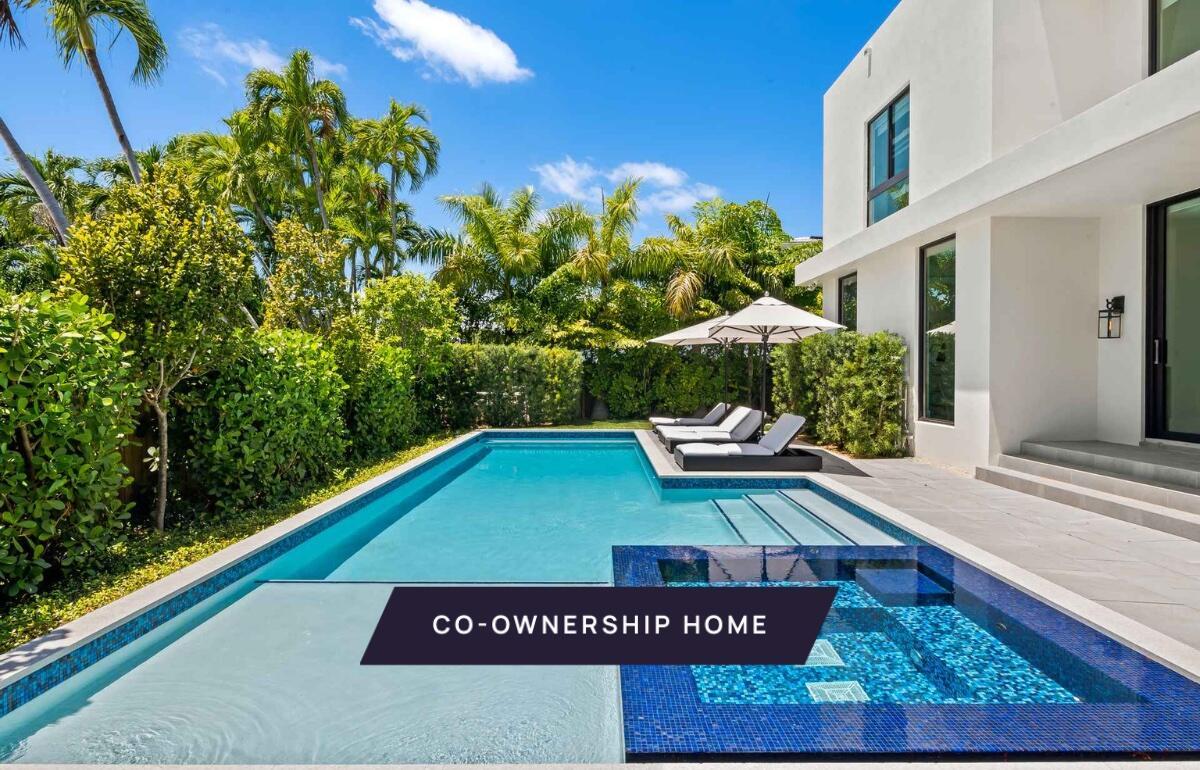
Active
$6,999,000
4
bds
|
5
ba
|
5,296
sqft
|
built
1935
3026 Flamingo Dr, Miami Beach, FL 33140
$-35,675
Cash flow
-26.6%
Cash-on-Cash Return
0.0%
Cap rate
0.1%
Rent to Value Ratio
Active
$550,000
2
bds
|
2
ba
|
1,184
sqft
|
built
2010
6305 Indian Creek Dr, Miami Beach, FL 33141
$-1,859
Cash flow
-17.6%
Cash-on-Cash Return
2.1%
Cap rate
0.7%
Rent to Value Ratio
Active
$1,199,000
3
bds
|
3
ba
|
2,425
sqft
|
built
1963
5255 Collins Ave, Miami Beach, FL 33140
$-4,567
Cash flow
-19.9%
Cash-on-Cash Return
1.6%
Cap rate
0.8%
Rent to Value Ratio
Active
$749,000
1
bds
|
2
ba
|
667
sqft
|
built
2004
6515 Collins Ave, Miami Beach, FL 33141
$-2,324
Cash flow
-16.2%
Cash-on-Cash Return
2.4%
Cap rate
0.7%
Rent to Value Ratio
Active
$489,000
1
bds
|
2
ba
|
980
sqft
|
built
1967
5401 Collins Ave, Miami Beach, FL 33140
$-1,906
Cash flow
-20.3%
Cash-on-Cash Return
1.5%
Cap rate
0.7%
Rent to Value Ratio

Active
$1,700,000
2
bds
|
2
ba
|
1,180
sqft
|
built
1926
2301 Collins Ave, Miami Beach, FL 33139
$-7,763
Cash flow
-23.8%
Cash-on-Cash Return
0.7%
Cap rate
0.4%
Rent to Value Ratio

Active
$550,000
2
bds
|
2
ba
|
1,047
sqft
|
built
1967
5555 Collins Ave, Miami Beach, FL 33140
$-2,506
Cash flow
-23.8%
Cash-on-Cash Return
0.7%
Cap rate
0.6%
Rent to Value Ratio

Active
$889,000
2
bds
|
2
ba
|
1,262
sqft
|
built
2001
1330 West Ave, Miami Beach, FL 33139
$-1,184
Cash flow
-6.9%
Cash-on-Cash Return
4.5%
Cap rate
0.7%
Rent to Value Ratio
Active
$208,000
1
bds
|
1
ba
|
480
sqft
|
built
1925
842 Meridian Ave, Miami Beach, FL 33139
$-710
Cash flow
-17.8%
Cash-on-Cash Return
2.0%
Cap rate
0.9%
Rent to Value Ratio

Active
$440,000
1
bds
|
2
ba
|
710
sqft
|
built
1981
1150 Collins Ave, Miami Beach, FL 33139
$-814
Cash flow
-9.7%
Cash-on-Cash Return
3.9%
Cap rate
0.6%
Rent to Value Ratio

Active
$425,000
1
bds
|
2
ba
|
750
sqft
|
built
1971
1228 West Ave, Miami Beach, FL 33139
$-1,071
Cash flow
-13.1%
Cash-on-Cash Return
3.1%
Cap rate
0.8%
Rent to Value Ratio

Active
$3,625,000
2
bds
|
3
ba
|
2,085
sqft
|
built
2019
4701 N Meridian Ave, Miami Beach, FL 33140
$-21,403
Cash flow
-30.8%
Cash-on-Cash Return
-0.9%
Cap rate
0.2%
Rent to Value Ratio
Active
$619,000
4
bds
|
4
ba
|
3,263
sqft
|
built
2021
5288 Alton Rd, Miami Beach, FL 33140
$-3,952
Cash flow
-33.3%
Cash-on-Cash Return
-1.5%
Cap rate
1.6%
Rent to Value Ratio
Active
$470,000
1
bds
|
2
ba
|
980
sqft
|
built
1967
5401 Collins Ave, Miami Beach, FL 33140
$-2,341
Cash flow
-26.0%
Cash-on-Cash Return
0.2%
Cap rate
0.6%
Rent to Value Ratio

Active
$223,000
0
bds
|
1
ba
|
436
sqft
|
built
1939
820 Euclid Ave, Miami Beach, FL 33139
$-875
Cash flow
-20.5%
Cash-on-Cash Return
1.4%
Cap rate
0.7%
Rent to Value Ratio
Active
$215,000
0
bds
|
1
ba
|
495
sqft
|
built
1952
1604 Drexel Ave, Miami Beach, FL 33139
$-605
Cash flow
-14.7%
Cash-on-Cash Return
2.8%
Cap rate
0.8%
Rent to Value Ratio

Active
$5,500,000
5
bds
|
7
ba
|
0
sqft
|
built
1945
230 N Hibiscus Dr, Miami Beach, FL 33139
$-25,506
Cash flow
-24.2%
Cash-on-Cash Return
0.6%
Cap rate
0.2%
Rent to Value Ratio
Active
$38,000,000
5
bds
|
6
ba
|
6,977
sqft
|
built
2005
5396 N Bay Rd, Miami Beach, FL 33140
$-195,281
Cash flow
-26.8%
Cash-on-Cash Return
0.0%
Cap rate
0.0%
Rent to Value Ratio
Active
$2,900,000
2
bds
|
3
ba
|
0
sqft
|
built
1941
5460 Alton Rd, Miami Beach, FL 33140
$-9,151
Cash flow
-16.5%
Cash-on-Cash Return
2.4%
Cap rate
0.4%
Rent to Value Ratio

Active
$523,800
2
bds
|
2
ba
|
1,122
sqft
|
built
1975
2655 Collins Ave, Miami Beach, FL 33140
$-1,489
Cash flow
-14.8%
Cash-on-Cash Return
2.7%
Cap rate
0.6%
Rent to Value Ratio
Active
$379,000
2
bds
|
1
ba
|
700
sqft
|
built
1940
1751 James Ave, Miami Beach, FL 33139
$-963
Cash flow
-13.3%
Cash-on-Cash Return
3.1%
Cap rate
0.8%
Rent to Value Ratio
Active
$1,200,000
2
bds
|
3
ba
|
1,817
sqft
|
built
2004
6101 Aqua Ave, Miami Beach, FL 33141
$-5,831
Cash flow
-25.4%
Cash-on-Cash Return
0.3%
Cap rate
0.7%
Rent to Value Ratio

Active
$299,900
1
bds
|
2
ba
|
905
sqft
|
built
1972
6801 Indian Creek Dr, Miami Beach, FL 33141
$-1,000
Cash flow
-17.4%
Cash-on-Cash Return
2.1%
Cap rate
0.7%
Rent to Value Ratio

Active
$2,600,000
3
bds
|
4
ba
|
1,742
sqft
|
built
2008
5875 Collins Ave, Miami Beach, FL 33140
$-12,866
Cash flow
-25.8%
Cash-on-Cash Return
0.2%
Cap rate
0.4%
Rent to Value Ratio

Active
$1,299,000
2
bds
|
2
ba
|
1,103
sqft
|
built
2008
6801 Collins Ave, Miami Beach, FL 33141
$-5,914
Cash flow
-23.8%
Cash-on-Cash Return
0.7%
Cap rate
0.6%
Rent to Value Ratio
Active
$200,000
1
bds
|
1
ba
|
730
sqft
|
built
1948
1275 Marseille Dr, Miami Beach, FL 33141
$228
Cash flow
5.9%
Cash-on-Cash Return
7.5%
Cap rate
1.1%
Rent to Value Ratio

Active
$649,000
1
bds
|
1
ba
|
793
sqft
|
built
2001
1330 West Ave, Miami Beach, FL 33139
$-1,970
Cash flow
-15.8%
Cash-on-Cash Return
2.5%
Cap rate
0.7%
Rent to Value Ratio
Active
$543,000
1
bds
|
2
ba
|
950
sqft
|
built
1967
5 Island Ave, Miami Beach, FL 33139
$-1,588
Cash flow
-15.3%
Cash-on-Cash Return
2.6%
Cap rate
0.9%
Rent to Value Ratio
Active
$4,450,000
3
bds
|
4
ba
|
3,321
sqft
|
built
2004
201 Aqua Ave, Miami Beach, FL 33141
$-24,199
Cash flow
-28.4%
Cash-on-Cash Return
-0.4%
Cap rate
0.2%
Rent to Value Ratio
Active
$565,000
2
bds
|
2
ba
|
980
sqft
|
built
1967
5401 Collins Ave, Miami Beach, FL 33140
$-1,907
Cash flow
-17.6%
Cash-on-Cash Return
2.1%
Cap rate
0.6%
Rent to Value Ratio

Active
$299,900
1
bds
|
2
ba
|
600
sqft
|
built
1925
747 Michigan Ave, Miami Beach, FL 33139
$-1,161
Cash flow
-20.2%
Cash-on-Cash Return
1.5%
Cap rate
0.7%
Rent to Value Ratio
Active
$3,349,000
5
bds
|
5
ba
|
3,325
sqft
|
built
1939
4545 Nautilus Ct, Miami Beach, FL 33140
$-13,414
Cash flow
-20.9%
Cash-on-Cash Return
1.3%
Cap rate
0.3%
Rent to Value Ratio