Miami Beach, FL Investment Properties for Sale
Browse homes for sale and investment properties in Miami Beach, FL. Refine your search by price, property type, or more.
Best cash flowing properties in Miami Beach, FL

Active
$217,000
1
bds
|
1
ba
|
406
sqft
|
built
1940
760 Jefferson Ave, Miami Beach, FL 33139
$-486
Cash flow
-11.7%
Cash-on-Cash Return
3.5%
Cap rate
0.8%
Rent to Value Ratio
Active
$621,000
2
bds
|
2
ba
|
1,010
sqft
|
built
1983
1775 Washington Ave, Miami Beach, FL 33139
$-695
Cash flow
-5.8%
Cash-on-Cash Return
4.8%
Cap rate
0.7%
Rent to Value Ratio
1,940 out of 2,138 properties for sale in Miami Beach, FL
Limited Results Shown
Create a free account, or log in to reveal all property listings and enjoy the complete experience.

Active
$250,000
bds
|
1
ba
|
510
sqft
|
built
1972
6801 Indian Creek Dr, Miami Beach, FL 33141
$-788
Cash flow
-16.4%
Cash-on-Cash Return
2.4%
Cap rate
0.7%
Rent to Value Ratio

Active
$24,500,000
5
bds
|
7
ba
|
4,827
sqft
|
built
2016
441 N Hibiscus Dr, Miami Beach, FL 33139
$-132,080
Cash flow
-28.1%
Cash-on-Cash Return
-0.3%
Cap rate
0.0%
Rent to Value Ratio
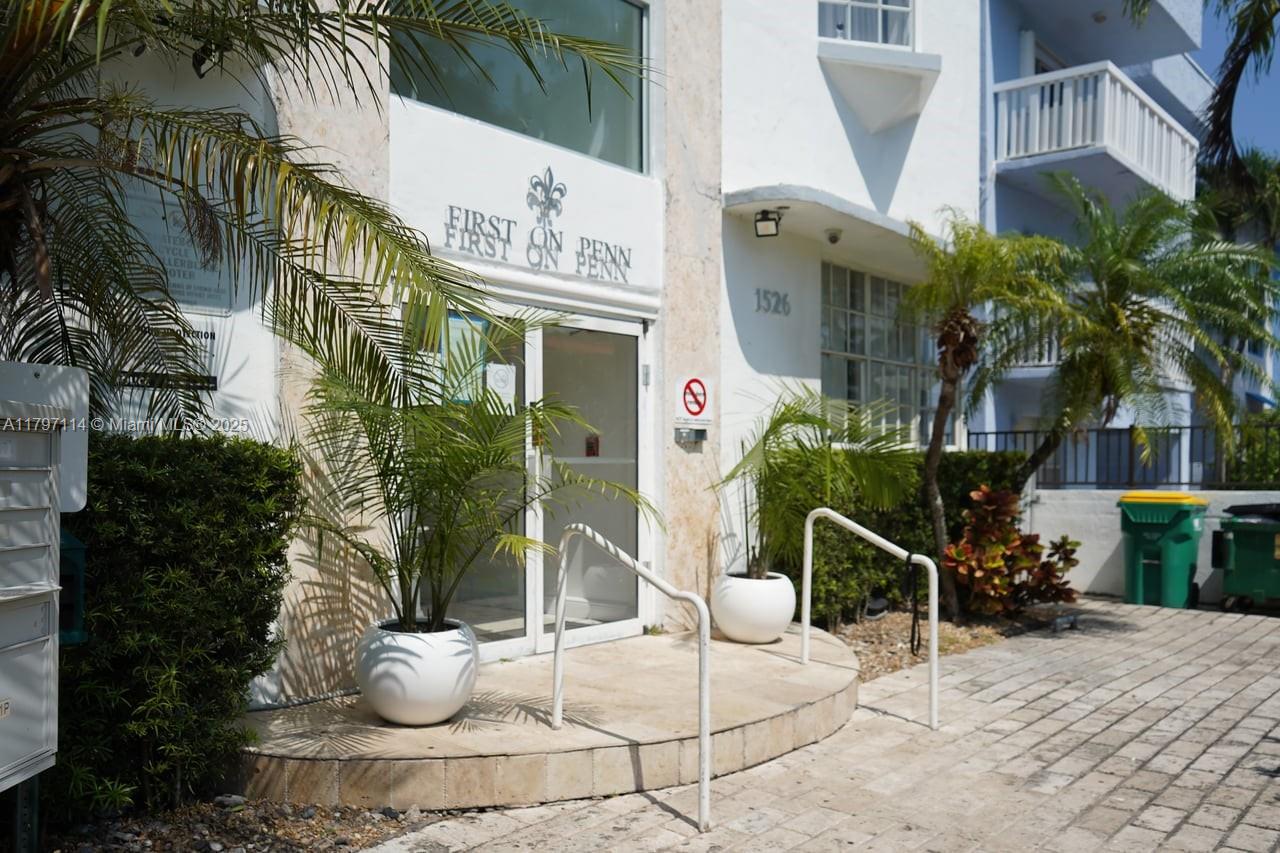
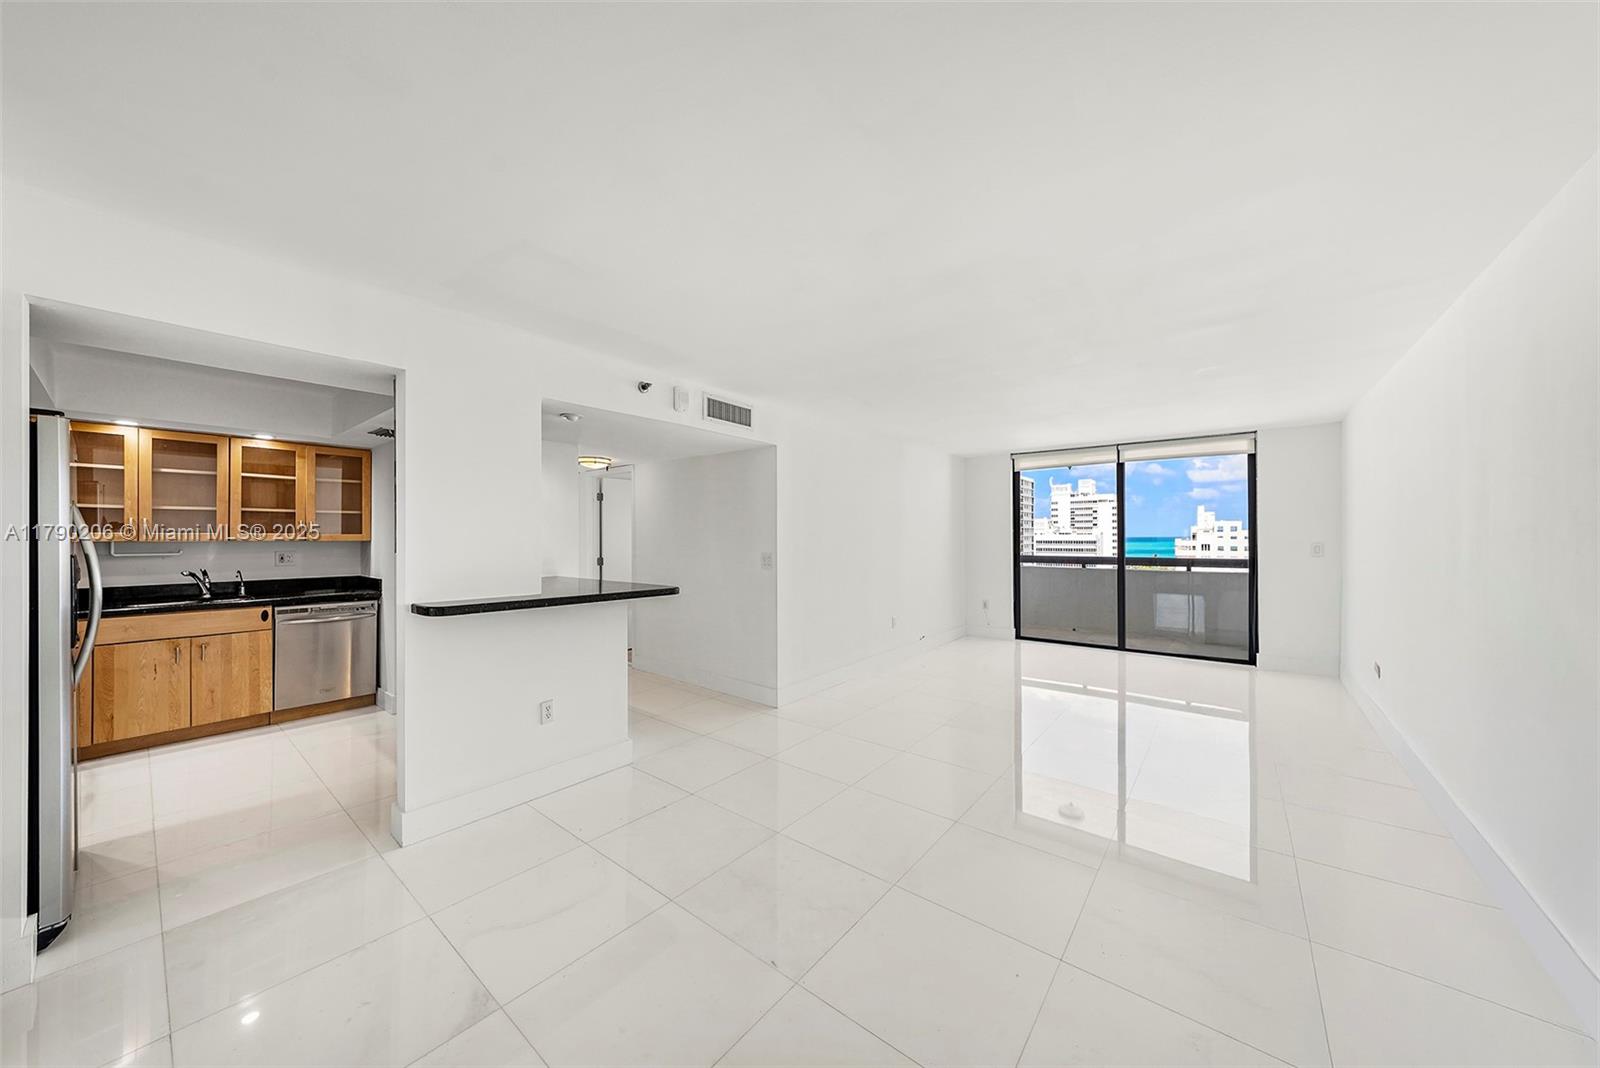
Active
$299,999
1
bds
|
1
ba
|
456
sqft
|
built
1938
1526 Pennsylvania Ave, Miami Beach, FL 33139
$-1,072
Cash flow
-18.6%
Cash-on-Cash Return
1.9%
Cap rate
0.7%
Rent to Value Ratio

Active
$2,450,000
1
bds
|
2
ba
|
1,969
sqft
|
built
2019
4701 N Meridian Ave, Miami Beach, FL 33140
$-15,220
Cash flow
-32.4%
Cash-on-Cash Return
-1.3%
Cap rate
0.2%
Rent to Value Ratio
Active
$450,000
1
bds
|
1
ba
|
477
sqft
|
built
2008
1100 West Ave, Miami Beach, FL 33139
$-2,006
Cash flow
-23.3%
Cash-on-Cash Return
0.8%
Cap rate
0.7%
Rent to Value Ratio
Active
$865,000
2
bds
|
2
ba
|
1,230
sqft
|
built
1991
6767 Collins Ave, Miami Beach, FL 33141
$-2,895
Cash flow
-17.5%
Cash-on-Cash Return
2.1%
Cap rate
0.6%
Rent to Value Ratio

Active
$399,000
bds
|
1
ba
|
545
sqft
|
built
1936
2421 Lake Pancoast Dr, Miami Beach, FL 33140
$-1,308
Cash flow
-17.1%
Cash-on-Cash Return
2.2%
Cap rate
0.7%
Rent to Value Ratio
Active
$319,000
bds
|
1
ba
|
320
sqft
|
built
1937
530 Ocean Dr, Miami Beach, FL 33139
$-1,209
Cash flow
-19.8%
Cash-on-Cash Return
1.6%
Cap rate
0.5%
Rent to Value Ratio
Active
$274,900
bds
|
1
ba
|
331
sqft
|
built
2019
6080 Collins Ave, Miami Beach, FL 33140
$-795
Cash flow
-15.1%
Cash-on-Cash Return
2.7%
Cap rate
0.9%
Rent to Value Ratio

Active under contract
$350,000
1
bds
|
1
ba
|
770
sqft
|
built
1938
1011 Michigan Ave, Miami Beach, FL 33139
$-1,120
Cash flow
-16.7%
Cash-on-Cash Return
2.3%
Cap rate
0.7%
Rent to Value Ratio

Active
$1,190,000
2
bds
|
2
ba
|
1,147
sqft
|
built
1997
650 West Ave, Miami Beach, FL 33139
$-4,208
Cash flow
-18.4%
Cash-on-Cash Return
1.9%
Cap rate
0.6%
Rent to Value Ratio
Active
$889,000
1
bds
|
2
ba
|
833
sqft
|
built
2008
5875 Collins Ave, Miami Beach, FL 33140
$-3,859
Cash flow
-22.6%
Cash-on-Cash Return
0.9%
Cap rate
0.6%
Rent to Value Ratio
Active
$409,000
1
bds
|
1
ba
|
460
sqft
|
built
2019
6080 Collins Ave, Miami Beach, FL 33140
$-1,549
Cash flow
-19.8%
Cash-on-Cash Return
1.6%
Cap rate
0.8%
Rent to Value Ratio
Active
$350,000
1
bds
|
2
ba
|
786
sqft
|
built
1970
1750 James Ave, Miami Beach, FL 33139
$-1,219
Cash flow
-18.2%
Cash-on-Cash Return
2.0%
Cap rate
0.6%
Rent to Value Ratio

Active
$599,000
2
bds
|
2
ba
|
1,030
sqft
|
built
1966
5161 Collins Ave, Miami Beach, FL 33140
$-2,562
Cash flow
-22.3%
Cash-on-Cash Return
1.0%
Cap rate
0.6%
Rent to Value Ratio
Active
$330,000
2
bds
|
2
ba
|
1,118
sqft
|
built
1976
7705 Abbott Ave, Miami Beach, FL 33141
$-1,106
Cash flow
-17.5%
Cash-on-Cash Return
2.1%
Cap rate
0.8%
Rent to Value Ratio

Active
$190,000
1
bds
|
1
ba
|
570
sqft
|
built
1940
7636 Abbott Ave, Miami Beach, FL 33141
$-819
Cash flow
-22.5%
Cash-on-Cash Return
1.0%
Cap rate
0.9%
Rent to Value Ratio

Active
$1,799,000
2
bds
|
2
ba
|
1,256
sqft
|
built
2023
540 West Ave, Miami Beach, FL 33139
$-7,194
Cash flow
-20.9%
Cash-on-Cash Return
1.3%
Cap rate
0.5%
Rent to Value Ratio
Active
$985,000
3
bds
|
3
ba
|
1,420
sqft
|
built
2004
5970 Indian Creek Dr, Miami Beach, FL 33140
$-4,040
Cash flow
-21.4%
Cash-on-Cash Return
1.2%
Cap rate
0.5%
Rent to Value Ratio

Active
$1,189,000
4
bds
|
3
ba
|
1,608
sqft
|
built
1950
1185 Biarritz Dr, Miami Beach, FL 33141
$-1,970
Cash flow
-8.6%
Cash-on-Cash Return
4.2%
Cap rate
0.5%
Rent to Value Ratio
Active
$217,000
1
bds
|
1
ba
|
406
sqft
|
built
1940
760 Jefferson Ave, Miami Beach, FL 33139
$-486
Cash flow
-11.7%
Cash-on-Cash Return
3.5%
Cap rate
0.8%
Rent to Value Ratio
Active
$340,000
2
bds
|
2
ba
|
1,077
sqft
|
built
1970
7850 Byron Ave, Miami Beach, FL 33141
$-922
Cash flow
-14.1%
Cash-on-Cash Return
2.9%
Cap rate
0.8%
Rent to Value Ratio
Active
$2,150,000
4
bds
|
3
ba
|
1,996
sqft
|
built
1937
1050 W 47th St, Miami Beach, FL 33140
$-8,651
Cash flow
-21.0%
Cash-on-Cash Return
1.3%
Cap rate
0.2%
Rent to Value Ratio
Active
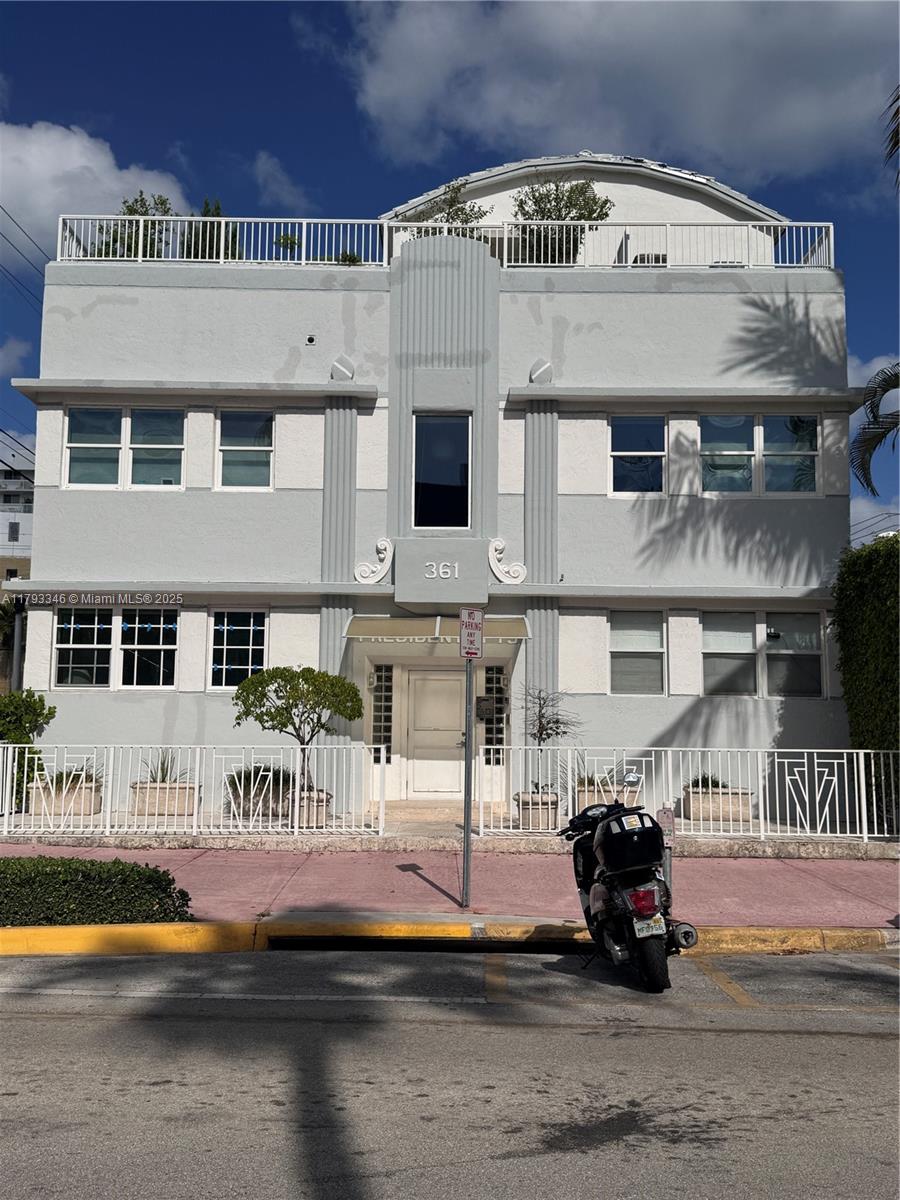
$335,000
1
bds
|
1
ba
|
480
sqft
|
built
1937
361 Collins Ave, Miami Beach, FL 33139
$-917
Cash flow
-14.3%
Cash-on-Cash Return
2.9%
Cap rate
0.7%
Rent to Value Ratio
Active
$1,650,000
2
bds
|
3
ba
|
1,484
sqft
|
built
1996
300 S Pointe Dr, Miami Beach, FL 33139
$-8,508
Cash flow
-26.9%
Cash-on-Cash Return
0.0%
Cap rate
0.3%
Rent to Value Ratio
Active
$439,000
1
bds
|
2
ba
|
1,323
sqft
|
built
1967
5825 Collins Ave, Miami Beach, FL 33140
$-1,677
Cash flow
-19.9%
Cash-on-Cash Return
1.6%
Cap rate
0.7%
Rent to Value Ratio

Active
$575,000
1
bds
|
1
ba
|
850
sqft
|
built
1966
800 West Ave, Miami Beach, FL 33139
$-2,107
Cash flow
-19.1%
Cash-on-Cash Return
1.7%
Cap rate
0.6%
Rent to Value Ratio

Active
$899,000
1
bds
|
1
ba
|
861
sqft
|
built
1982
2555 Collins Ave, Miami Beach, FL 33140
$-2,897
Cash flow
-16.8%
Cash-on-Cash Return
2.3%
Cap rate
0.6%
Rent to Value Ratio
Active
$621,000
2
bds
|
2
ba
|
1,010
sqft
|
built
1983
1775 Washington Ave, Miami Beach, FL 33139
$-695
Cash flow
-5.8%
Cash-on-Cash Return
4.8%
Cap rate
0.7%
Rent to Value Ratio
Active
$1,400,000
2
bds
|
2
ba
|
1,410
sqft
|
built
1999
7330 Ocean Ter, Miami Beach, FL 33141
$-5,255
Cash flow
-19.6%
Cash-on-Cash Return
1.6%
Cap rate
0.5%
Rent to Value Ratio
Active
$2,990,000
2
bds
|
2
ba
|
1,026
sqft
|
built
2009
2201 Collins Ave, Miami Beach, FL 33139
$-17,468
Cash flow
-30.5%
Cash-on-Cash Return
-0.9%
Cap rate
0.3%
Rent to Value Ratio

Active
$1,990,000
3
bds
|
3
ba
|
2,340
sqft
|
built
1996
300 S Pointe Dr, Miami Beach, FL 33139
$-10,668
Cash flow
-28.0%
Cash-on-Cash Return
-0.3%
Cap rate
0.5%
Rent to Value Ratio
Active
$4,395,000
2
bds
|
2
ba
|
1,279
sqft
|
built
2004
101 20th St, Miami Beach, FL 33139
$-27,001
Cash flow
-32.1%
Cash-on-Cash Return
-1.2%
Cap rate
0.2%
Rent to Value Ratio
Active
$188,000
bds
|
1
ba
|
270
sqft
|
built
1936
763 Pennsylvania Ave, Miami Beach, FL 33139
$-749
Cash flow
-20.8%
Cash-on-Cash Return
1.4%
Cap rate
1.0%
Rent to Value Ratio
Active
$317,400
2
bds
|
1
ba
|
750
sqft
|
built
1949
1751 Washington Ave, Miami Beach, FL 33139
$-887
Cash flow
-14.6%
Cash-on-Cash Return
2.8%
Cap rate
0.8%
Rent to Value Ratio

Active
$715,000
2
bds
|
2
ba
|
960
sqft
|
built
1962
5225 Collins Ave, Miami Beach, FL 33140
$-3,268
Cash flow
-23.8%
Cash-on-Cash Return
0.7%
Cap rate
0.6%
Rent to Value Ratio
Active
$1,050,000
2
bds
|
2
ba
|
1,130
sqft
|
built
1998
1800 Purdy Ave, Miami Beach, FL 33139
$-4,754
Cash flow
-23.6%
Cash-on-Cash Return
0.7%
Cap rate
0.5%
Rent to Value Ratio
Active
$242,500
1
bds
|
1
ba
|
430
sqft
|
built
1940
1561 Lenox Ave, Miami Beach, FL 33139
$-745
Cash flow
-16.0%
Cash-on-Cash Return
2.5%
Cap rate
0.7%
Rent to Value Ratio

Active
$850,000
2
bds
|
2
ba
|
1,262
sqft
|
built
2001
1330 West Ave, Miami Beach, FL 33139
$-3,939
Cash flow
-24.2%
Cash-on-Cash Return
0.6%
Cap rate
0.5%
Rent to Value Ratio
Active
$335,000
1
bds
|
1
ba
|
837
sqft
|
built
1965
1200 West Ave, Miami Beach, FL 33139
$-1,398
Cash flow
-21.8%
Cash-on-Cash Return
1.1%
Cap rate
0.8%
Rent to Value Ratio