Miami Beach, FL Investment Properties for Sale
Browse homes for sale and investment properties in Miami Beach, FL. Refine your search by price, property type, or more.
Best cash flowing properties in Miami Beach, FL

Active
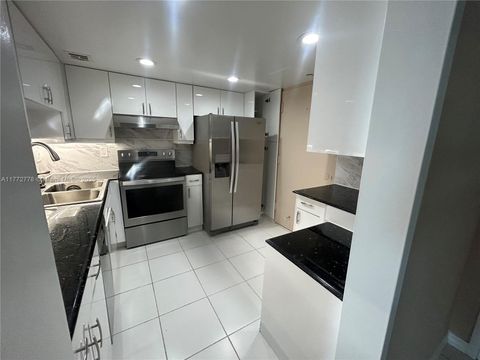
$499,000
bds
|
1
ba
|
500
sqft
|
built
2006
1437 Collins Ave, Miami Beach, FL 33139
$0
Cash flow
n/a
Cash-on-Cash Return
n/a
Cap rate
n/a
Rent to Value Ratio
Active
$4,150,000
3
bds
|
3
ba
|
2,761
sqft
|
built
1950
2575 Pine Tree Dr, Miami Beach, FL 33140
$0
Cash flow
n/a
Cash-on-Cash Return
n/a
Cap rate
n/a
Rent to Value Ratio
1,957 out of 2,239 properties for sale in Miami Beach, FL
Limited Results Shown
Create a free account, or log in to reveal all property listings and enjoy the complete experience.

Active
$330,000
1
bds
|
1
ba
|
898
sqft
|
built
1970
401 69th St, Miami Beach, FL 33141
$-1,137
Cash flow
-18.0%
Cash-on-Cash Return
2.0%
Cap rate
0.8%
Rent to Value Ratio

Active
$345,000
1
bds
|
1
ba
|
550
sqft
|
built
1965
100 Lincoln Rd, Miami Beach, FL 33139
$-1,033
Cash flow
-15.6%
Cash-on-Cash Return
2.6%
Cap rate
0.8%
Rent to Value Ratio
Active
$269,000
1
bds
|
1
ba
|
535
sqft
|
built
1951
900 Meridian Ave, Miami Beach, FL 33139
$-682
Cash flow
-13.2%
Cash-on-Cash Return
3.1%
Cap rate
0.7%
Rent to Value Ratio

Active
$265,000
1
bds
|
1
ba
|
674
sqft
|
built
1949
1616 Euclid Ave, Miami Beach, FL 33139
$-658
Cash flow
-13.0%
Cash-on-Cash Return
3.2%
Cap rate
0.9%
Rent to Value Ratio

Active
$2,690,000
5
bds
|
5
ba
|
4,232
sqft
|
built
1926
5208 Alton Rd, Miami Beach, FL 33140
$-11,785
Cash flow
-22.9%
Cash-on-Cash Return
0.9%
Cap rate
0.2%
Rent to Value Ratio

Active
$1,150,000
2
bds
|
2
ba
|
1,180
sqft
|
built
1980
1623 Collins Ave, Miami Beach, FL 33139
$-4,499
Cash flow
-20.4%
Cash-on-Cash Return
1.5%
Cap rate
0.5%
Rent to Value Ratio
Active
$339,000
2
bds
|
2
ba
|
1,021
sqft
|
built
1953
7712 Byron Ave, Miami Beach, FL 33141
$-467
Cash flow
-7.2%
Cash-on-Cash Return
4.5%
Cap rate
0.7%
Rent to Value Ratio

Active
$425,000
2
bds
|
3
ba
|
930
sqft
|
built
1925
1027 Pennsylvania Ave, Miami Beach, FL 33139
$-1,665
Cash flow
-20.4%
Cash-on-Cash Return
1.4%
Cap rate
0.6%
Rent to Value Ratio

Active
$325,000
0
bds
|
1
ba
|
376
sqft
|
built
1937
420 15th St, Miami Beach, FL 33139
$-1,012
Cash flow
-16.2%
Cash-on-Cash Return
2.4%
Cap rate
0.7%
Rent to Value Ratio

Active
$325,000
0
bds
|
1
ba
|
376
sqft
|
built
1937
420 15th St, Miami Beach, FL 33139
$-1,012
Cash flow
-16.2%
Cash-on-Cash Return
2.4%
Cap rate
0.7%
Rent to Value Ratio

Active
$1,100,000
2
bds
|
2
ba
|
1,805
sqft
|
built
1976
6423 Collins Ave, Miami Beach, FL 33141
$-4,696
Cash flow
-22.3%
Cash-on-Cash Return
1.0%
Cap rate
0.5%
Rent to Value Ratio

Active
$320,000
1
bds
|
1
ba
|
740
sqft
|
built
1957
653 Michigan Ave, Miami Beach, FL 33139
$-902
Cash flow
-14.7%
Cash-on-Cash Return
2.8%
Cap rate
0.9%
Rent to Value Ratio
Active
$339,900
1
bds
|
1
ba
|
742
sqft
|
built
1965
1030 9th St, Miami Beach, FL 33139
$-11
Cash flow
-0.2%
Cash-on-Cash Return
6.1%
Cap rate
0.8%
Rent to Value Ratio

Active
$320,000
1
bds
|
2
ba
|
855
sqft
|
built
1970
5838 Collins Ave, Miami Beach, FL 33140
$-1,059
Cash flow
-17.3%
Cash-on-Cash Return
2.2%
Cap rate
0.9%
Rent to Value Ratio

Active
$295,000
1
bds
|
1
ba
|
710
sqft
|
built
1939
1009 Meridian Ave, Miami Beach, FL 33139
$-1,360
Cash flow
-24.1%
Cash-on-Cash Return
0.6%
Cap rate
0.8%
Rent to Value Ratio

Active
$789,000
2
bds
|
2
ba
|
1,455
sqft
|
built
1970
7135 Collins Ave, Miami Beach, FL 33141
$-2,385
Cash flow
-15.8%
Cash-on-Cash Return
2.5%
Cap rate
0.7%
Rent to Value Ratio

Active
$1,550,000
2
bds
|
2
ba
|
1,322
sqft
|
built
2004
6365 Collins Ave, Miami Beach, FL 33141
$-4,647
Cash flow
-15.6%
Cash-on-Cash Return
2.5%
Cap rate
0.6%
Rent to Value Ratio

Active
$439,000
2
bds
|
2
ba
|
983
sqft
|
built
1979
1035 West Ave, Miami Beach, FL 33139
$-1,342
Cash flow
-15.9%
Cash-on-Cash Return
2.5%
Cap rate
0.7%
Rent to Value Ratio
Active
$675,000
2
bds
|
2
ba
|
1,031
sqft
|
built
1969
5701 Collins Ave, Miami Beach, FL 33140
$-3,312
Cash flow
-25.6%
Cash-on-Cash Return
0.3%
Cap rate
0.6%
Rent to Value Ratio

Active
$599,900
2
bds
|
2
ba
|
1,190
sqft
|
built
1967
5600 Collins Ave, Miami Beach, FL 33140
$-623
Cash flow
-5.4%
Cash-on-Cash Return
4.9%
Cap rate
0.7%
Rent to Value Ratio

Active
$285,000
2
bds
|
2
ba
|
798
sqft
|
built
1970
1990 Marseille Dr, Miami Beach, FL 33141
$-693
Cash flow
-12.7%
Cash-on-Cash Return
3.2%
Cap rate
0.9%
Rent to Value Ratio

Active
$3,895,000
2
bds
|
3
ba
|
1,778
sqft
|
built
2024
501 West Ave, Miami Beach, FL 33139
$0
Cash flow
n/a
Cash-on-Cash Return
n/a
Cap rate
n/a
Rent to Value Ratio

Active
$789,000
2
bds
|
2
ba
|
1,540
sqft
|
built
1963
900 Bay Dr, Miami Beach, FL 33141
$-3,454
Cash flow
-22.8%
Cash-on-Cash Return
0.9%
Cap rate
0.6%
Rent to Value Ratio

Active
$5,450,000
2
bds
|
3
ba
|
1,791
sqft
|
built
2003
100 S Pointe Dr, Miami Beach, FL 33139
$-34,169
Cash flow
-32.7%
Cash-on-Cash Return
-1.4%
Cap rate
0.1%
Rent to Value Ratio

Active
$3,199,000
4
bds
|
4
ba
|
2,790
sqft
|
built
1997
1415 20th St, Miami Beach, FL 33139
$-14,438
Cash flow
-23.5%
Cash-on-Cash Return
0.7%
Cap rate
0.3%
Rent to Value Ratio

Active
$315,000
2
bds
|
1
ba
|
690
sqft
|
built
1935
1008 Jefferson Ave, Miami Beach, FL 33139
$-880
Cash flow
-14.6%
Cash-on-Cash Return
2.8%
Cap rate
0.8%
Rent to Value Ratio
Active
$349,000
1
bds
|
1
ba
|
511
sqft
|
built
2022
1610 Euclid Ave, Miami Beach, FL 33139
$-899
Cash flow
-13.4%
Cash-on-Cash Return
3.1%
Cap rate
0.7%
Rent to Value Ratio

Active
$765,000
2
bds
|
2
ba
|
1,140
sqft
|
built
1967
5401 Collins Ave, Miami Beach, FL 33140
$-3,192
Cash flow
-21.8%
Cash-on-Cash Return
1.1%
Cap rate
0.6%
Rent to Value Ratio

Active
$1,495,000
1
bds
|
2
ba
|
960
sqft
|
built
1926
2301 Collins Ave, Miami Beach, FL 33139
$-6,530
Cash flow
-22.8%
Cash-on-Cash Return
0.9%
Cap rate
0.4%
Rent to Value Ratio

Active
$882,000
bds
|
1
ba
|
521
sqft
|
built
2008
4391 Collins Ave, Miami Beach, FL 33140
$-3,259
Cash flow
-19.3%
Cash-on-Cash Return
1.7%
Cap rate
0.5%
Rent to Value Ratio
Active
$305,000
2
bds
|
1
ba
|
608
sqft
|
built
2015
801 8th St, Miami Beach, FL 33139
$-901
Cash flow
-15.4%
Cash-on-Cash Return
2.6%
Cap rate
0.9%
Rent to Value Ratio

Active
$25,000,000
4
bds
|
4
ba
|
3,047
sqft
|
built
1950
851 N Venetian Dr, Miami Beach, FL 33139
$-142,722
Cash flow
-29.8%
Cash-on-Cash Return
-0.7%
Cap rate
0.0%
Rent to Value Ratio

Active
$900,000
bds
|
1
ba
|
554
sqft
|
built
2008
4391 Collins Ave, Miami Beach, FL 33140
$-3,308
Cash flow
-19.2%
Cash-on-Cash Return
1.7%
Cap rate
0.5%
Rent to Value Ratio

Active
$575,000
1
bds
|
2
ba
|
1,190
sqft
|
built
1973
2655 Collins Ave, Miami Beach, FL 33140
$-1,960
Cash flow
-17.8%
Cash-on-Cash Return
2.1%
Cap rate
0.6%
Rent to Value Ratio

Active
$499,000
bds
|
2
ba
|
500
sqft
|
built
2006
1437 Collins Ave, Miami Beach, FL 33139
$0
Cash flow
n/a
Cash-on-Cash Return
n/a
Cap rate
n/a
Rent to Value Ratio

Active
$2,750,000
6
bds
|
0
ba
|
3,952
sqft
|
built
1950
1471 Lincoln Ter, Miami Beach, FL 33139
$-14,038
Cash flow
-26.6%
Cash-on-Cash Return
0.0%
Cap rate
0.1%
Rent to Value Ratio
Active
$519,000
2
bds
|
2
ba
|
1,040
sqft
|
built
1966
5161 Collins Ave, Miami Beach, FL 33140
$-1,999
Cash flow
-20.1%
Cash-on-Cash Return
1.5%
Cap rate
0.7%
Rent to Value Ratio
Active
$4,150,000
3
bds
|
3
ba
|
2,761
sqft
|
built
1950
2575 Pine Tree Dr, Miami Beach, FL 33140
$0
Cash flow
n/a
Cash-on-Cash Return
n/a
Cap rate
n/a
Rent to Value Ratio
Active
$499,000
bds
|
1
ba
|
500
sqft
|
built
2006
1437 Collins Ave, Miami Beach, FL 33139
$0
Cash flow
n/a
Cash-on-Cash Return
n/a
Cap rate
n/a
Rent to Value Ratio

Active
$4,250,000
3
bds
|
5
ba
|
3,200
sqft
|
built
1941
7805 Noremac Ave, Miami Beach, FL 33141
$-17,234
Cash flow
-21.2%
Cash-on-Cash Return
1.3%
Cap rate
0.2%
Rent to Value Ratio