Miami Beach, FL Investment Properties for Sale
Browse homes for sale and investment properties in Miami Beach, FL. Refine your search by price, property type, or more.
Best cash flowing properties in Miami Beach, FL

Active
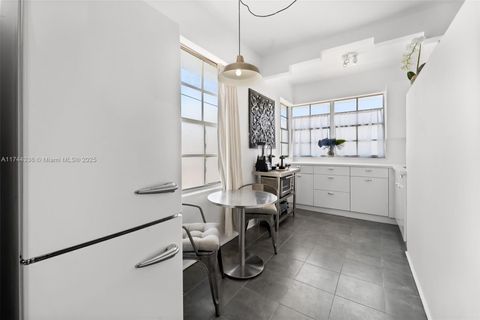
$349,000
bds
|
1
ba
|
566
sqft
|
built
1966
2899 Collins Ave, Miami Beach, FL 33140
$-461
Cash flow
-6.9%
Cash-on-Cash Return
4.7%
Cap rate
0.7%
Rent to Value Ratio
Active
$244,900
1
bds
|
1
ba
|
490
sqft
|
built
1947
730 12th St, Miami Beach, FL 33139
$-611
Cash flow
-13.0%
Cash-on-Cash Return
3.3%
Cap rate
0.8%
Rent to Value Ratio
1,935 out of 2,133 properties for sale in Miami Beach, FL
Limited Results Shown
Create a free account, or log in to reveal all property listings and enjoy the complete experience.

Active
$780,000
2
bds
|
2
ba
|
1,310
sqft
|
built
1991
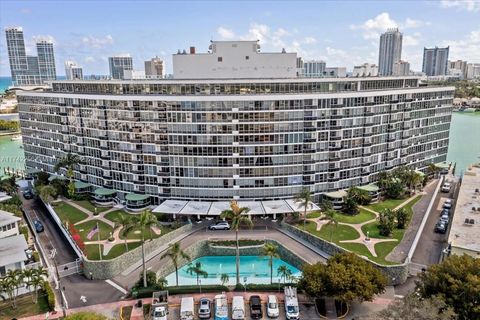
5757 Collins Ave, Miami Beach, FL 33140
$-3,666
Cash flow
-24.5%
Cash-on-Cash Return
0.6%
Cap rate
0.5%
Rent to Value Ratio

Active
$3,399,000
5
bds
|
6
ba
|
0
sqft
|
built
2026
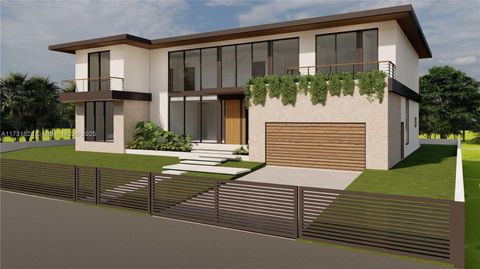
315 W San Marino Dr, Miami Beach, FL 33139
$-16,325
Cash flow
-25.1%
Cash-on-Cash Return
0.5%
Cap rate
0.2%
Rent to Value Ratio
Active
$377,000
1
bds
|
1
ba
|
837
sqft
|
built
1965
1200 West Ave, Miami Beach, FL 33139
$-1,351
Cash flow
-18.7%
Cash-on-Cash Return
2.0%
Cap rate
0.8%
Rent to Value Ratio
Active
$7,500,000
4
bds
|
4
ba
|
3,625
sqft
|
built
1949
1670 Daytonia Rd, Miami Beach, FL 33141
$-37,971
Cash flow
-26.4%
Cash-on-Cash Return
0.2%
Cap rate
0.1%
Rent to Value Ratio

Active
$375,000
1
bds
|
1
ba
|
938
sqft
|
built
1964
5005 Collins Ave, Miami Beach, FL 33140
$-1,675
Cash flow
-23.3%
Cash-on-Cash Return
0.9%
Cap rate
0.9%
Rent to Value Ratio

Active
$625,000
2
bds
|
2
ba
|
1,550
sqft
|
built
1963
900 Bay Dr, Miami Beach, FL 33141
$-2,919
Cash flow
-24.4%
Cash-on-Cash Return
0.7%
Cap rate
0.7%
Rent to Value Ratio
Active
$365,000
1
bds
|
2
ba
|
750
sqft
|
built
1971
1228 West Ave, Miami Beach, FL 33139
$-1,061
Cash flow
-15.2%
Cash-on-Cash Return
2.8%
Cap rate
0.8%
Rent to Value Ratio
Active
$399,000
1
bds
|
1
ba
|
1,136
sqft
|
built
1963
900 Bay Dr, Miami Beach, FL 33141
$-1,975
Cash flow
-25.8%
Cash-on-Cash Return
0.3%
Cap rate
0.7%
Rent to Value Ratio

Active
$916,000
2
bds
|
2
ba
|
1,037
sqft
|
built
1982
2555 Collins Ave, Miami Beach, FL 33140
$-3,061
Cash flow
-17.4%
Cash-on-Cash Return
2.3%
Cap rate
0.4%
Rent to Value Ratio
Active
$409,000
1
bds
|
2
ba
|
910
sqft
|
built
1968
6770 Indian Creek Dr, Miami Beach, FL 33141
$-642
Cash flow
-8.2%
Cash-on-Cash Return
4.4%
Cap rate
0.7%
Rent to Value Ratio
Active
$2,200,000
6
bds
|
7
ba
|
5,227
sqft
|
built
1928
969 W 34th St, Miami Beach, FL 33140
$-6,672
Cash flow
-15.8%
Cash-on-Cash Return
2.6%
Cap rate
0.5%
Rent to Value Ratio
Active
$349,000
bds
|
1
ba
|
566
sqft
|
built
1966
2899 Collins Ave, Miami Beach, FL 33140
$-461
Cash flow
-6.9%
Cash-on-Cash Return
4.7%
Cap rate
0.7%
Rent to Value Ratio

Active
$1,800,000
3
bds
|
4
ba
|
1,590
sqft
|
built
2002
361 Jefferson Ave, Miami Beach, FL 33139
$-7,833
Cash flow
-22.7%
Cash-on-Cash Return
1.0%
Cap rate
0.4%
Rent to Value Ratio
Active
$310,000
1
bds
|
2
ba
|
910
sqft
|
built
1968
6770 Indian Creek Dr, Miami Beach, FL 33141
$-1,311
Cash flow
-22.1%
Cash-on-Cash Return
1.2%
Cap rate
0.7%
Rent to Value Ratio

Active
$1,399,000
1
bds
|
2
ba
|
1,002
sqft
|
built
2005
4401 Collins Ave, Miami Beach, FL 33140
$-5,933
Cash flow
-22.1%
Cash-on-Cash Return
1.2%
Cap rate
0.5%
Rent to Value Ratio

Active
$740,000
1
bds
|
2
ba
|
861
sqft
|
built
1982
2555 Collins Ave, Miami Beach, FL 33140
$-2,035
Cash flow
-14.3%
Cash-on-Cash Return
3.0%
Cap rate
0.5%
Rent to Value Ratio
Active
$244,900
1
bds
|
1
ba
|
490
sqft
|
built
1947
730 12th St, Miami Beach, FL 33139
$-611
Cash flow
-13.0%
Cash-on-Cash Return
3.3%
Cap rate
0.8%
Rent to Value Ratio

Active
$2,650,000
2
bds
|
3
ba
|
1,287
sqft
|
built
2009
2201 Collins Ave, Miami Beach, FL 33139
$-15,225
Cash flow
-30.0%
Cash-on-Cash Return
-0.6%
Cap rate
0.3%
Rent to Value Ratio
Active
$225,000
1
bds
|
1
ba
|
410
sqft
|
built
1939
1005 Meridian Ave, Miami Beach, FL 33139
$-735
Cash flow
-17.0%
Cash-on-Cash Return
2.3%
Cap rate
0.8%
Rent to Value Ratio

Active
$355,000
1
bds
|
2
ba
|
750
sqft
|
built
1971
1228 West Ave, Miami Beach, FL 33139
$-1,123
Cash flow
-16.5%
Cash-on-Cash Return
2.5%
Cap rate
0.8%
Rent to Value Ratio

Active
$499,900
1
bds
|
1
ba
|
820
sqft
|
built
1965
100 Lincoln Rd, Miami Beach, FL 33139
$-2,164
Cash flow
-22.6%
Cash-on-Cash Return
1.1%
Cap rate
0.6%
Rent to Value Ratio

Active
$399,000
1
bds
|
1
ba
|
810
sqft
|
built
1966
800 West Ave, Miami Beach, FL 33139
$-1,362
Cash flow
-17.8%
Cash-on-Cash Return
2.2%
Cap rate
0.8%
Rent to Value Ratio
Active
$369,900
bds
|
1
ba
|
570
sqft
|
built
1967
5401 Collins Ave, Miami Beach, FL 33140
$-1,601
Cash flow
-22.6%
Cash-on-Cash Return
1.1%
Cap rate
0.7%
Rent to Value Ratio

Active
$750,000
2
bds
|
2
ba
|
1,290
sqft
|
built
1968
5601 Collins Ave, Miami Beach, FL 33140
$-1,632
Cash flow
-11.4%
Cash-on-Cash Return
3.7%
Cap rate
0.6%
Rent to Value Ratio

Active
$1,115,000
2
bds
|
2
ba
|
1,280
sqft
|
built
2008
6899 Collins Ave, Miami Beach, FL 33141
$-5,826
Cash flow
-27.3%
Cash-on-Cash Return
0.0%
Cap rate
0.6%
Rent to Value Ratio
Active
$279,999
bds
|
1
ba
|
781
sqft
|
built
1968
1000 West Ave, Miami Beach, FL 33139
$-1,128
Cash flow
-21.0%
Cash-on-Cash Return
1.4%
Cap rate
0.8%
Rent to Value Ratio

Active
$779,000
2
bds
|
2
ba
|
1,126
sqft
|
built
2006
6580 Indian Creek Dr, Miami Beach, FL 33141
$-2,135
Cash flow
-14.3%
Cash-on-Cash Return
3.0%
Cap rate
0.7%
Rent to Value Ratio

Active
$1,100,000
2
bds
|
3
ba
|
1,300
sqft
|
built
2006
6000 Indian Creek Dr, Miami Beach, FL 33140
$-4,283
Cash flow
-20.3%
Cash-on-Cash Return
1.6%
Cap rate
0.5%
Rent to Value Ratio
Active
$830,000
2
bds
|
2
ba
|
1,805
sqft
|
built
1976
6423 Collins Ave, Miami Beach, FL 33141
$-3,001
Cash flow
-18.9%
Cash-on-Cash Return
1.9%
Cap rate
0.7%
Rent to Value Ratio
Active
$1,195,000
1
bds
|
1
ba
|
723
sqft
|
built
2004
225 Collins Ave, Miami Beach, FL 33139
$-4,247
Cash flow
-18.5%
Cash-on-Cash Return
2.0%
Cap rate
0.5%
Rent to Value Ratio

Active
$300,000
1
bds
|
1
ba
|
714
sqft
|
built
1949
1045 Lenox Ave, Miami Beach, FL 33139
$-992
Cash flow
-17.3%
Cash-on-Cash Return
2.3%
Cap rate
0.8%
Rent to Value Ratio

Active
$530,000
2
bds
|
2
ba
|
1,290
sqft
|
built
1971
6039 Collins Ave, Miami Beach, FL 33140
$-1,414
Cash flow
-13.9%
Cash-on-Cash Return
3.1%
Cap rate
0.7%
Rent to Value Ratio

Active
$450,000
2
bds
|
2
ba
|
1,299
sqft
|
built
1970
401 69th St, Miami Beach, FL 33141
$-2,110
Cash flow
-24.5%
Cash-on-Cash Return
0.6%
Cap rate
0.7%
Rent to Value Ratio
Active
$490,000
2
bds
|
2
ba
|
1,190
sqft
|
built
1967
5600 Collins Ave, Miami Beach, FL 33140
$-1,585
Cash flow
-16.9%
Cash-on-Cash Return
2.4%
Cap rate
0.8%
Rent to Value Ratio
Active
$900,000
2
bds
|
2
ba
|
1,005
sqft
|
built
1982
2555 Collins Ave, Miami Beach, FL 33140
$-3,963
Cash flow
-23.0%
Cash-on-Cash Return
1.0%
Cap rate
0.4%
Rent to Value Ratio

Active
$820,000
1
bds
|
2
ba
|
701
sqft
|
built
2016
1201 20th St, Miami Beach, FL 33139
$-1,685
Cash flow
-10.7%
Cash-on-Cash Return
3.8%
Cap rate
0.8%
Rent to Value Ratio
Active
$17,500,000
5
bds
|
6
ba
|
4,703
sqft
|
built
2010
610 W Dilido Dr, Miami Beach, FL 33139
$-100,510
Cash flow
-30.0%
Cash-on-Cash Return
-0.6%
Cap rate
0.1%
Rent to Value Ratio

Active
$950,000
bds
|
1
ba
|
516
sqft
|
built
2005
4401 Collins Ave, Miami Beach, FL 33140
$-4,141
Cash flow
-22.7%
Cash-on-Cash Return
1.0%
Cap rate
0.4%
Rent to Value Ratio

Active
$849,000
2
bds
|
2
ba
|
1,035
sqft
|
built
2008
6799 Collins Ave, Miami Beach, FL 33141
$-1,600
Cash flow
-9.8%
Cash-on-Cash Return
4.0%
Cap rate
0.7%
Rent to Value Ratio

Active
$2,395,000
4
bds
|
4
ba
|
2,883
sqft
|
built
1930
3175 Sheridan Ave, Miami Beach, FL 33140
$-7,905
Cash flow
-17.2%
Cash-on-Cash Return
2.3%
Cap rate
0.4%
Rent to Value Ratio