Miami Beach, FL Investment Properties for Sale
Browse homes for sale and investment properties in Miami Beach, FL. Refine your search by price, property type, or more.
Best cash flowing properties in Miami Beach, FL
Active
$327,000
1
bds
|
1
ba
|
841
sqft
|
built
1965
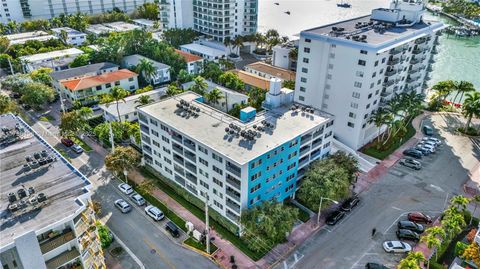
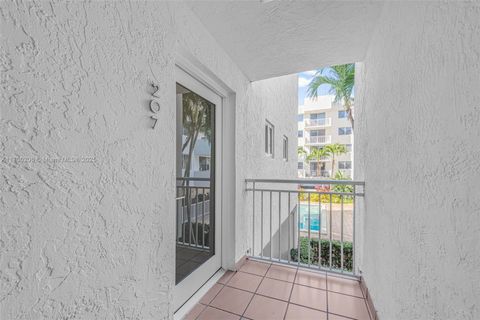
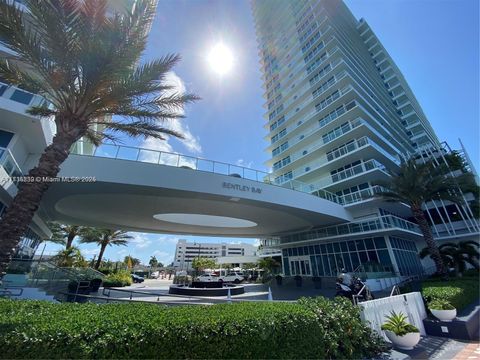
1400 Lincoln Rd, Miami Beach, FL 33139
$-298
Cash flow
-4.8%
Cash-on-Cash Return
5.2%
Cap rate
1.0%
Rent to Value Ratio

Active
$360,000
1
bds
|
2
ba
|
1,051
sqft
|
built
1981
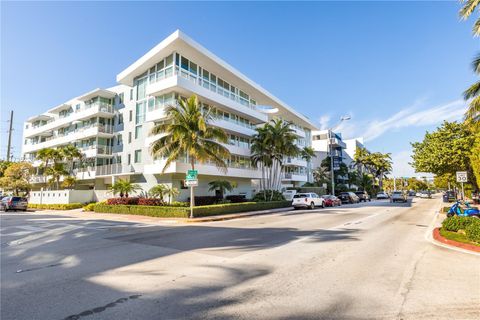
8255 Abbott Ave, Miami Beach, FL 33141
$-587
Cash flow
-8.5%
Cash-on-Cash Return
4.3%
Cap rate
0.8%
Rent to Value Ratio
1,935 out of 2,133 properties for sale in Miami Beach, FL
Limited Results Shown
Create a free account, or log in to reveal all property listings and enjoy the complete experience.

Active
$13,900,000
5
bds
|
6
ba
|
5,119
sqft
|
built
2015
3009 Pine Tree Dr, Miami Beach, FL 33140
$-73,579
Cash flow
-27.6%
Cash-on-Cash Return
-0.1%
Cap rate
0.1%
Rent to Value Ratio

Active
$3,100,000
6
bds
|
5
ba
|
3,785
sqft
|
built
1929
2424 Prairie Ave, Miami Beach, FL 33140
$-13,476
Cash flow
-22.7%
Cash-on-Cash Return
1.0%
Cap rate
0.3%
Rent to Value Ratio
Active
$327,000
1
bds
|
1
ba
|
841
sqft
|
built
1965
1400 Lincoln Rd, Miami Beach, FL 33139
$-298
Cash flow
-4.8%
Cash-on-Cash Return
5.2%
Cap rate
1.0%
Rent to Value Ratio
Active
$4,500,000
2
bds
|
3
ba
|
1,443
sqft
|
built
2008
50 S Pointe Dr, Miami Beach, FL 33139
$-25,127
Cash flow
-29.1%
Cash-on-Cash Return
-0.4%
Cap rate
0.2%
Rent to Value Ratio

Active
$950,000
2
bds
|
2
ba
|
1,060
sqft
|
built
1997
1900 Purdy Ave, Miami Beach, FL 33139
$-3,460
Cash flow
-19.0%
Cash-on-Cash Return
1.9%
Cap rate
0.6%
Rent to Value Ratio

Active
$990,000
2
bds
|
2
ba
|
729
sqft
|
built
1964
1036 Ocean Dr, Miami Beach, FL 33139
$-3,882
Cash flow
-20.5%
Cash-on-Cash Return
1.6%
Cap rate
0.6%
Rent to Value Ratio
Active
$8,475,000
3
bds
|
4
ba
|
2,756
sqft
|
built
2014
2901 Collins Ave, Miami Beach, FL 33140
$-52,912
Cash flow
-32.6%
Cash-on-Cash Return
-1.2%
Cap rate
0.1%
Rent to Value Ratio
Active
$360,000
1
bds
|
2
ba
|
1,051
sqft
|
built
1981
8255 Abbott Ave, Miami Beach, FL 33141
$-587
Cash flow
-8.5%
Cash-on-Cash Return
4.3%
Cap rate
0.8%
Rent to Value Ratio

Active
$280,000
1
bds
|
2
ba
|
800
sqft
|
built
1979
7830 Dickens Ave, Miami Beach, FL 33141
$-890
Cash flow
-16.6%
Cash-on-Cash Return
2.5%
Cap rate
0.7%
Rent to Value Ratio

Active
$375,000
bds
|
1
ba
|
510
sqft
|
built
1966
5445 Collins Ave, Miami Beach, FL 33140
$-1,672
Cash flow
-23.3%
Cash-on-Cash Return
0.9%
Cap rate
0.7%
Rent to Value Ratio

Active
$305,000
1
bds
|
2
ba
|
980
sqft
|
built
1972
6801 Indian Creek Dr, Miami Beach, FL 33141
$-828
Cash flow
-14.2%
Cash-on-Cash Return
3.0%
Cap rate
0.9%
Rent to Value Ratio

Active
$995,000
2
bds
|
2
ba
|
1,226
sqft
|
built
2011
2100 Park Ave, Miami Beach, FL 33139
$-1,214
Cash flow
-6.4%
Cash-on-Cash Return
4.8%
Cap rate
0.7%
Rent to Value Ratio
Active
$319,900
1
bds
|
1
ba
|
704
sqft
|
built
1965
851 Meridian Ave, Miami Beach, FL 33139
$-1,081
Cash flow
-17.6%
Cash-on-Cash Return
2.2%
Cap rate
0.8%
Rent to Value Ratio
Active
$475,000
2
bds
|
2
ba
|
1,065
sqft
|
built
1980
1666 West Ave, Miami Beach, FL 33139
$-1,200
Cash flow
-13.2%
Cash-on-Cash Return
3.2%
Cap rate
0.7%
Rent to Value Ratio
Active
$224,000
1
bds
|
1
ba
|
428
sqft
|
built
1947
1555 Pennsylvania Ave, Miami Beach, FL 33139
$-776
Cash flow
-18.1%
Cash-on-Cash Return
2.1%
Cap rate
0.9%
Rent to Value Ratio

Active
$3,750,000
4
bds
|
3
ba
|
3,248
sqft
|
built
1955
410 S Shore Dr, Miami Beach, FL 33141
$-16,215
Cash flow
-22.6%
Cash-on-Cash Return
1.1%
Cap rate
0.3%
Rent to Value Ratio
Active
$4,700,000
2
bds
|
2
ba
|
1,239
sqft
|
built
2009
2201 Collins Ave, Miami Beach, FL 33139
$-29,740
Cash flow
-33.0%
Cash-on-Cash Return
-1.3%
Cap rate
0.1%
Rent to Value Ratio

Active
$499,000
2
bds
|
2
ba
|
1,190
sqft
|
built
1973
2655 Collins Ave, Miami Beach, FL 33140
$-2,029
Cash flow
-21.2%
Cash-on-Cash Return
1.4%
Cap rate
0.7%
Rent to Value Ratio

Active
$599,000
1
bds
|
1
ba
|
659
sqft
|
built
1970
345 Ocean Dr, Miami Beach, FL 33139
$-2,395
Cash flow
-20.9%
Cash-on-Cash Return
1.5%
Cap rate
0.5%
Rent to Value Ratio

Active
$1,100,000
1
bds
|
1
ba
|
620
sqft
|
built
2004
101 Ocean Dr, Miami Beach, FL 33139
$-5,203
Cash flow
-24.7%
Cash-on-Cash Return
0.6%
Cap rate
0.4%
Rent to Value Ratio

Active
$850,000
2
bds
|
2
ba
|
1,078
sqft
|
built
1997
650 West Ave, Miami Beach, FL 33139
$-2,976
Cash flow
-18.3%
Cash-on-Cash Return
2.1%
Cap rate
0.7%
Rent to Value Ratio

Active
$389,990
bds
|
1
ba
|
0
sqft
|
built
1965
1200 West Ave, Miami Beach, FL 33139
$-1,193
Cash flow
-16.0%
Cash-on-Cash Return
2.6%
Cap rate
0.7%
Rent to Value Ratio

Active
$250,000
1
bds
|
1
ba
|
420
sqft
|
built
1937
349 Meridian Ave, Miami Beach, FL 33139
$-896
Cash flow
-18.7%
Cash-on-Cash Return
2.0%
Cap rate
0.8%
Rent to Value Ratio
Active
$699,000
1
bds
|
2
ba
|
950
sqft
|
built
1967
5 Island Ave, Miami Beach, FL 33139
$-2,018
Cash flow
-15.1%
Cash-on-Cash Return
2.8%
Cap rate
0.7%
Rent to Value Ratio
Active
$810,000
1
bds
|
1
ba
|
779
sqft
|
built
2004
540 West Ave, Miami Beach, FL 33139
$-2,621
Cash flow
-16.9%
Cash-on-Cash Return
2.4%
Cap rate
0.7%
Rent to Value Ratio
Active
$449,000
1
bds
|
1
ba
|
720
sqft
|
built
1999
7800 Collins Ave, Miami Beach, FL 33141
$-1,815
Cash flow
-21.1%
Cash-on-Cash Return
1.4%
Cap rate
0.5%
Rent to Value Ratio

Active
$950,000
2
bds
|
2
ba
|
1,078
sqft
|
built
1997
650 West Ave, Miami Beach, FL 33139
$-3,500
Cash flow
-19.2%
Cash-on-Cash Return
1.8%
Cap rate
0.6%
Rent to Value Ratio
Active
$245,000
1
bds
|
1
ba
|
500
sqft
|
built
1954
1551 Michigan Ave, Miami Beach, FL 33139
$-664
Cash flow
-14.1%
Cash-on-Cash Return
3.0%
Cap rate
0.8%
Rent to Value Ratio
Active
$895,000
2
bds
|
2
ba
|
1,660
sqft
|
built
1967
5600 Collins Ave, Miami Beach, FL 33140
$-2,158
Cash flow
-12.6%
Cash-on-Cash Return
3.4%
Cap rate
0.8%
Rent to Value Ratio

Active
$790,000
2
bds
|
2
ba
|
1,030
sqft
|
built
1966
5151 Collins Ave, Miami Beach, FL 33140
$-3,669
Cash flow
-24.2%
Cash-on-Cash Return
0.7%
Cap rate
0.4%
Rent to Value Ratio
Active
$1,675,000
2
bds
|
3
ba
|
1,755
sqft
|
built
2004
6103 Aqua Ave, Miami Beach, FL 33141
$-7,919
Cash flow
-24.7%
Cash-on-Cash Return
0.6%
Cap rate
0.5%
Rent to Value Ratio

Active
$980,000
2
bds
|
2
ba
|
1,372
sqft
|
built
1972
11 Island Ave, Miami Beach, FL 33139
$-4,099
Cash flow
-21.8%
Cash-on-Cash Return
1.2%
Cap rate
0.5%
Rent to Value Ratio

Active
$730,000
1
bds
|
1
ba
|
620
sqft
|
built
1960
405 N Hibiscus Dr, Miami Beach, FL 33139
$-2,080
Cash flow
-14.9%
Cash-on-Cash Return
2.8%
Cap rate
0.6%
Rent to Value Ratio
Active
$4,345,000
2
bds
|
2
ba
|
1,279
sqft
|
built
2004
101 20th St, Miami Beach, FL 33139
$-21,941
Cash flow
-26.3%
Cash-on-Cash Return
0.2%
Cap rate
0.2%
Rent to Value Ratio
Active
$310,000
1
bds
|
1
ba
|
746
sqft
|
built
1940
1605 Lenox Ave, Miami Beach, FL 33139
$-791
Cash flow
-13.3%
Cash-on-Cash Return
3.2%
Cap rate
0.8%
Rent to Value Ratio

Active
$549,000
2
bds
|
3
ba
|
1,068
sqft
|
built
2005
8041 Harding Ave, Miami Beach, FL 33141
$-2,046
Cash flow
-19.4%
Cash-on-Cash Return
1.8%
Cap rate
0.6%
Rent to Value Ratio

Active
$313,500
1
bds
|
2
ba
|
910
sqft
|
built
1968
6770 Indian Creek Dr, Miami Beach, FL 33141
$-1,377
Cash flow
-22.9%
Cash-on-Cash Return
1.0%
Cap rate
0.7%
Rent to Value Ratio
Active
$650,000
1
bds
|
1
ba
|
1,011
sqft
|
built
2010
6000 Collins Ave, Miami Beach, FL 33140
$-2,033
Cash flow
-16.3%
Cash-on-Cash Return
2.5%
Cap rate
0.7%
Rent to Value Ratio

Active
$895,000
1
bds
|
1
ba
|
820
sqft
|
built
2008
6899 Collins Ave, Miami Beach, FL 33141
$-3,091
Cash flow
-18.0%
Cash-on-Cash Return
2.1%
Cap rate
0.8%
Rent to Value Ratio

Active
$575,000
1
bds
|
1
ba
|
696
sqft
|
built
2008
1100 West Ave, Miami Beach, FL 33139
$-3,180
Cash flow
-28.9%
Cash-on-Cash Return
-0.4%
Cap rate
0.7%
Rent to Value Ratio