Miami Beach, FL Investment Properties for Sale
Browse homes for sale and investment properties in Miami Beach, FL. Refine your search by price, property type, or more.
Best cash flowing properties in Miami Beach, FL
Active
$219,000
bds
|
1
ba
|
440
sqft
|
built
1937
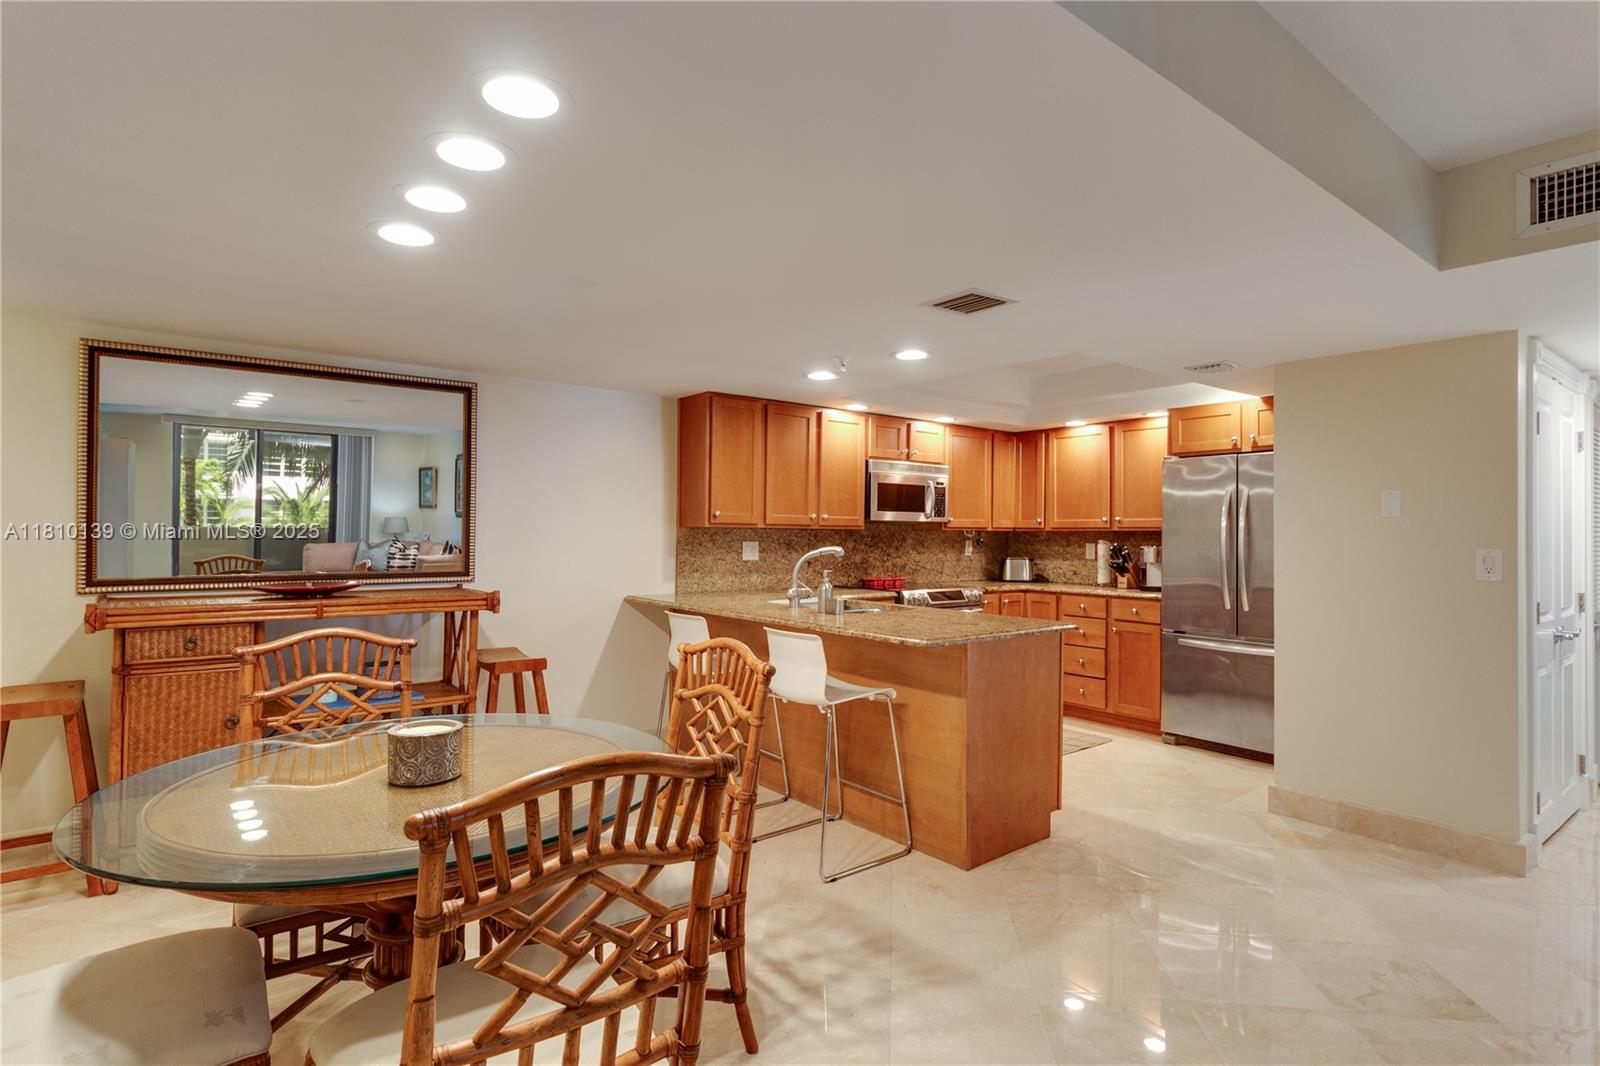
359 Meridian Ave, Miami Beach, FL 33139
$-295
Cash flow
-7.0%
Cash-on-Cash Return
4.5%
Cap rate
0.7%
Rent to Value Ratio
Active
$235,000
1
bds
|
1
ba
|
639
sqft
|
built
1963
8040 Tatum Waterway Dr, Miami Beach, FL 33141
$-574
Cash flow
-12.7%
Cash-on-Cash Return
3.2%
Cap rate
0.9%
Rent to Value Ratio
1,992 out of 2,195 properties for sale in Miami Beach, FL
Limited Results Shown
Create a free account, or log in to reveal all property listings and enjoy the complete experience.
Active
$299,000
1
bds
|
1
ba
|
510
sqft
|
built
1923
760 Meridian Ave, Miami Beach, FL 33139
$-682
Cash flow
-11.9%
Cash-on-Cash Return
3.4%
Cap rate
0.8%
Rent to Value Ratio
Active
$320,000
bds
|
1
ba
|
404
sqft
|
built
1970
401 Ocean Dr, Miami Beach, FL 33139
$-1,709
Cash flow
-27.9%
Cash-on-Cash Return
-0.3%
Cap rate
0.6%
Rent to Value Ratio
Active
$565,000
1
bds
|
2
ba
|
930
sqft
|
built
1968
5601 Collins Ave, Miami Beach, FL 33140
$-1,354
Cash flow
-12.5%
Cash-on-Cash Return
3.3%
Cap rate
0.5%
Rent to Value Ratio
Active
$3,750,000
3
bds
|
3
ba
|
1,860
sqft
|
built
2008
6799 Collins Ave, Miami Beach, FL 33141
$-21,366
Cash flow
-29.7%
Cash-on-Cash Return
-0.7%
Cap rate
0.2%
Rent to Value Ratio
Active
$4,200,000
2
bds
|
2
ba
|
1,050
sqft
|
built
1923
2234 Prairie Ave, Miami Beach, FL 33139
$-19,844
Cash flow
-24.7%
Cash-on-Cash Return
0.5%
Cap rate
0.2%
Rent to Value Ratio
Active
$475,000
1
bds
|
1
ba
|
745
sqft
|
built
1960
1500 Bay Rd, Miami Beach, FL 33139
$-2,009
Cash flow
-22.1%
Cash-on-Cash Return
1.1%
Cap rate
0.7%
Rent to Value Ratio

Active
$1,150,000
1
bds
|
2
ba
|
940
sqft
|
built
1998
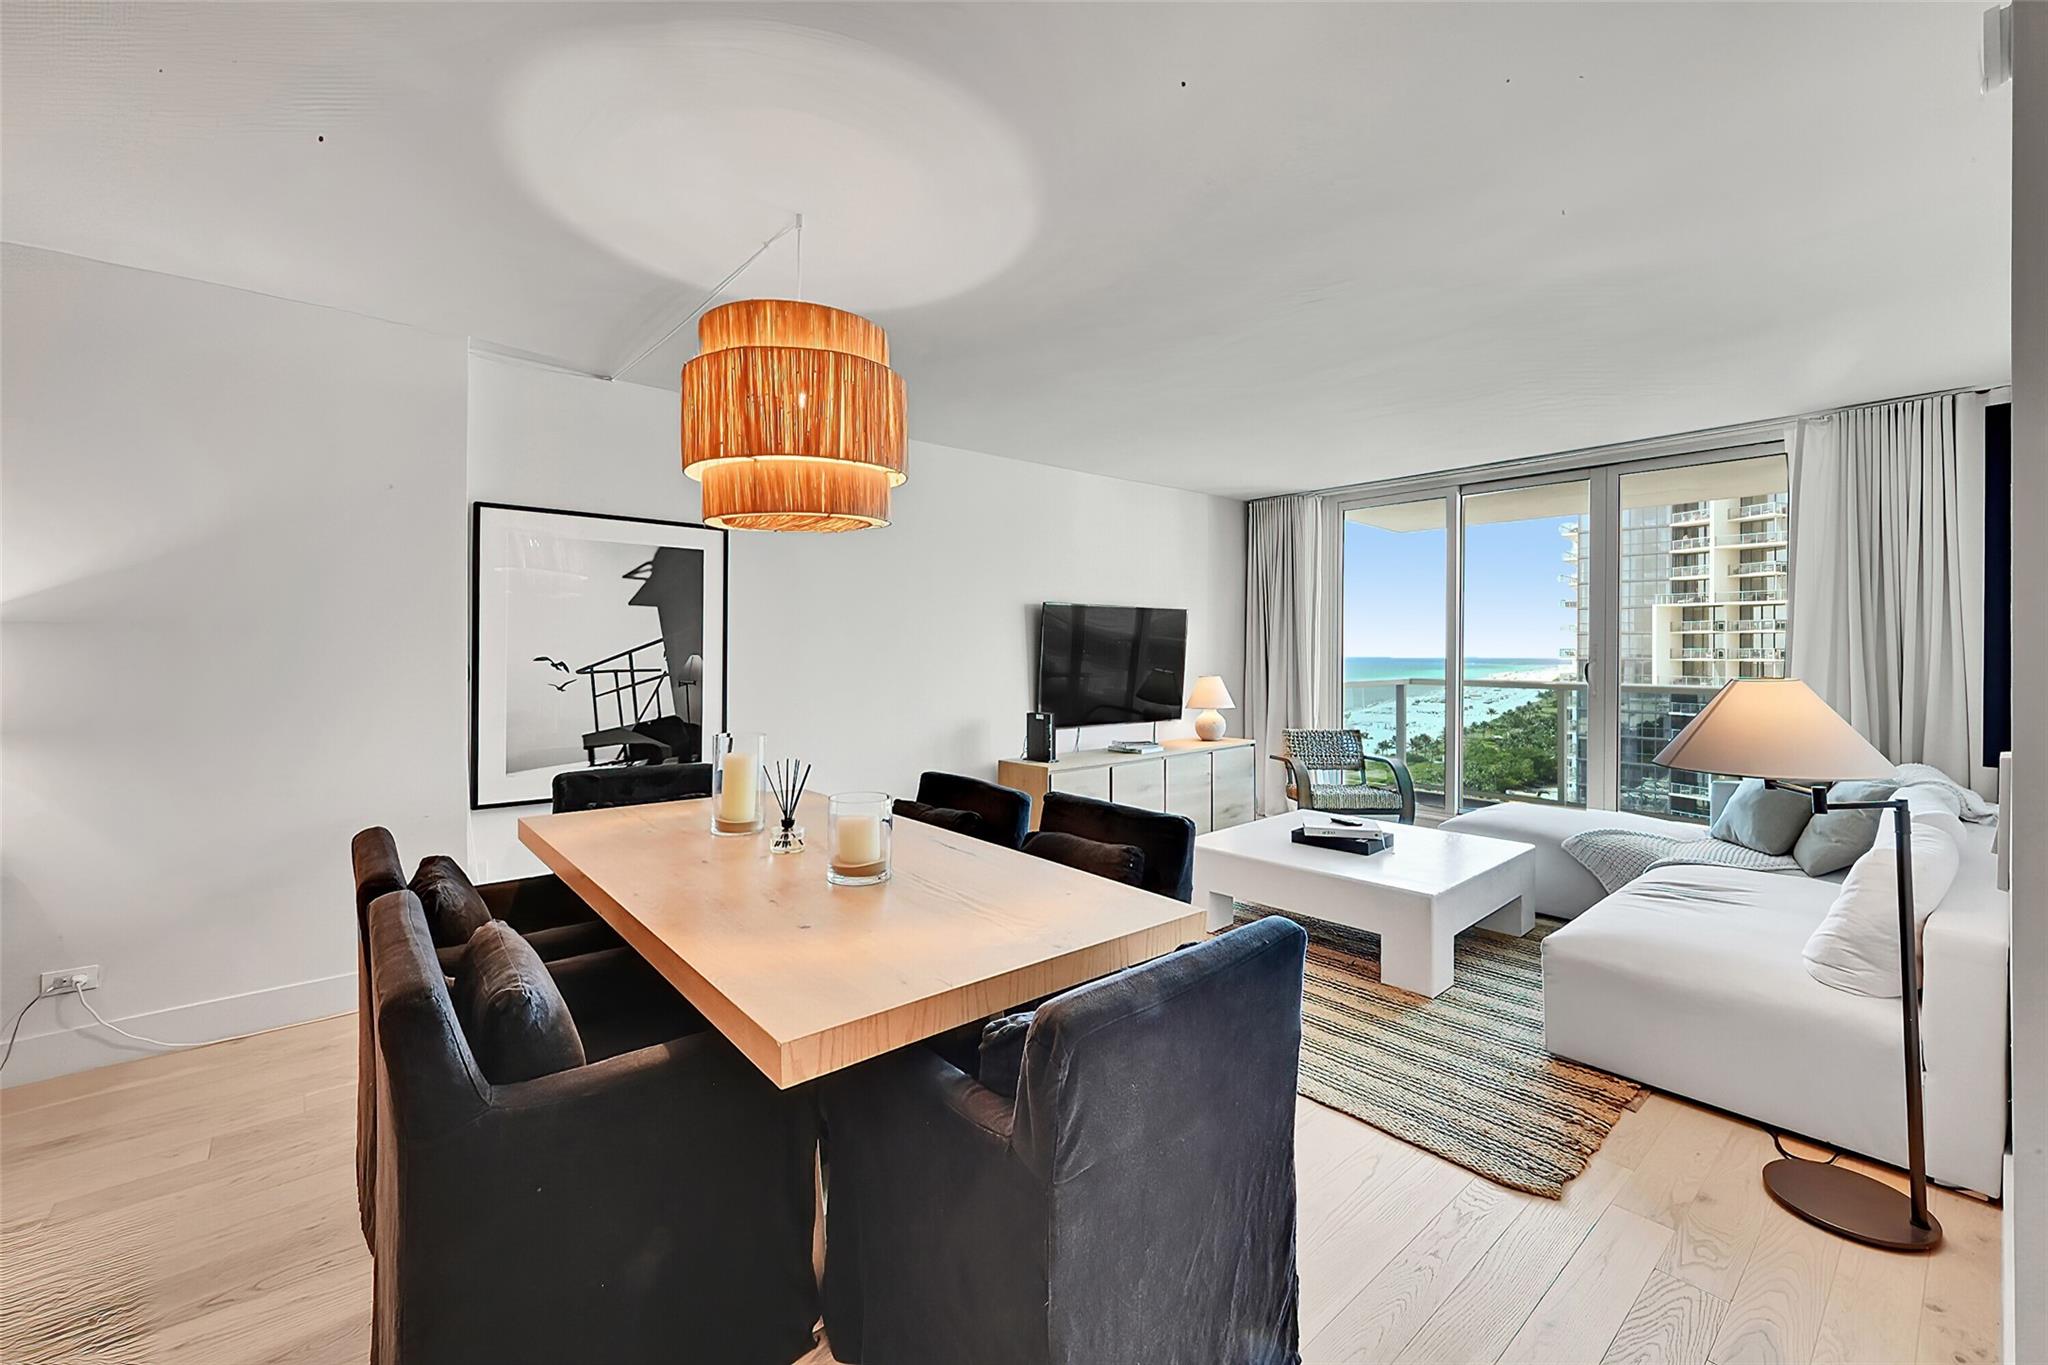
1500 Ocean Dr, Miami Beach, FL 33139
$-4,334
Cash flow
-19.7%
Cash-on-Cash Return
1.6%
Cap rate
0.5%
Rent to Value Ratio
Active
$2,995,000
4
bds
|
5
ba
|
2,290
sqft
|
built
1931
3747 Royal Palm Ave, Miami Beach, FL 33140
$-11,541
Cash flow
-20.1%
Cash-on-Cash Return
1.5%
Cap rate
0.3%
Rent to Value Ratio
Active
$310,000
1
bds
|
2
ba
|
920
sqft
|
built
1963
900 Bay Dr, Miami Beach, FL 33141
$-1,519
Cash flow
-25.6%
Cash-on-Cash Return
0.3%
Cap rate
0.8%
Rent to Value Ratio
Active
$375,000
bds
|
1
ba
|
552
sqft
|
built
1965
1200 West Ave, Miami Beach, FL 33139
$-839
Cash flow
-11.7%
Cash-on-Cash Return
3.5%
Cap rate
0.9%
Rent to Value Ratio
Active
$1,800,000
1
bds
|
1
ba
|
900
sqft
|
built
1926
2301 Collins Ave, Miami Beach, FL 33139
$-6,317
Cash flow
-18.3%
Cash-on-Cash Return
1.9%
Cap rate
0.5%
Rent to Value Ratio
Active
$690,000
2
bds
|
2
ba
|
1,088
sqft
|
built
1980
1623 Collins Ave, Miami Beach, FL 33139
$-2,541
Cash flow
-19.2%
Cash-on-Cash Return
1.7%
Cap rate
0.7%
Rent to Value Ratio
Active
$615,000
2
bds
|
2
ba
|
978
sqft
|
built
2003
1532 Drexel Ave, Miami Beach, FL 33139
$-1,828
Cash flow
-15.5%
Cash-on-Cash Return
2.6%
Cap rate
0.7%
Rent to Value Ratio
Active
$2,450,000
2
bds
|
2
ba
|
1,230
sqft
|
built
1926
2301 Collins Ave, Miami Beach, FL 33139
$-10,716
Cash flow
-22.8%
Cash-on-Cash Return
0.9%
Cap rate
0.4%
Rent to Value Ratio
Active
$2,550,000
8
bds
|
0
ba
|
4,524
sqft
|
built
1947
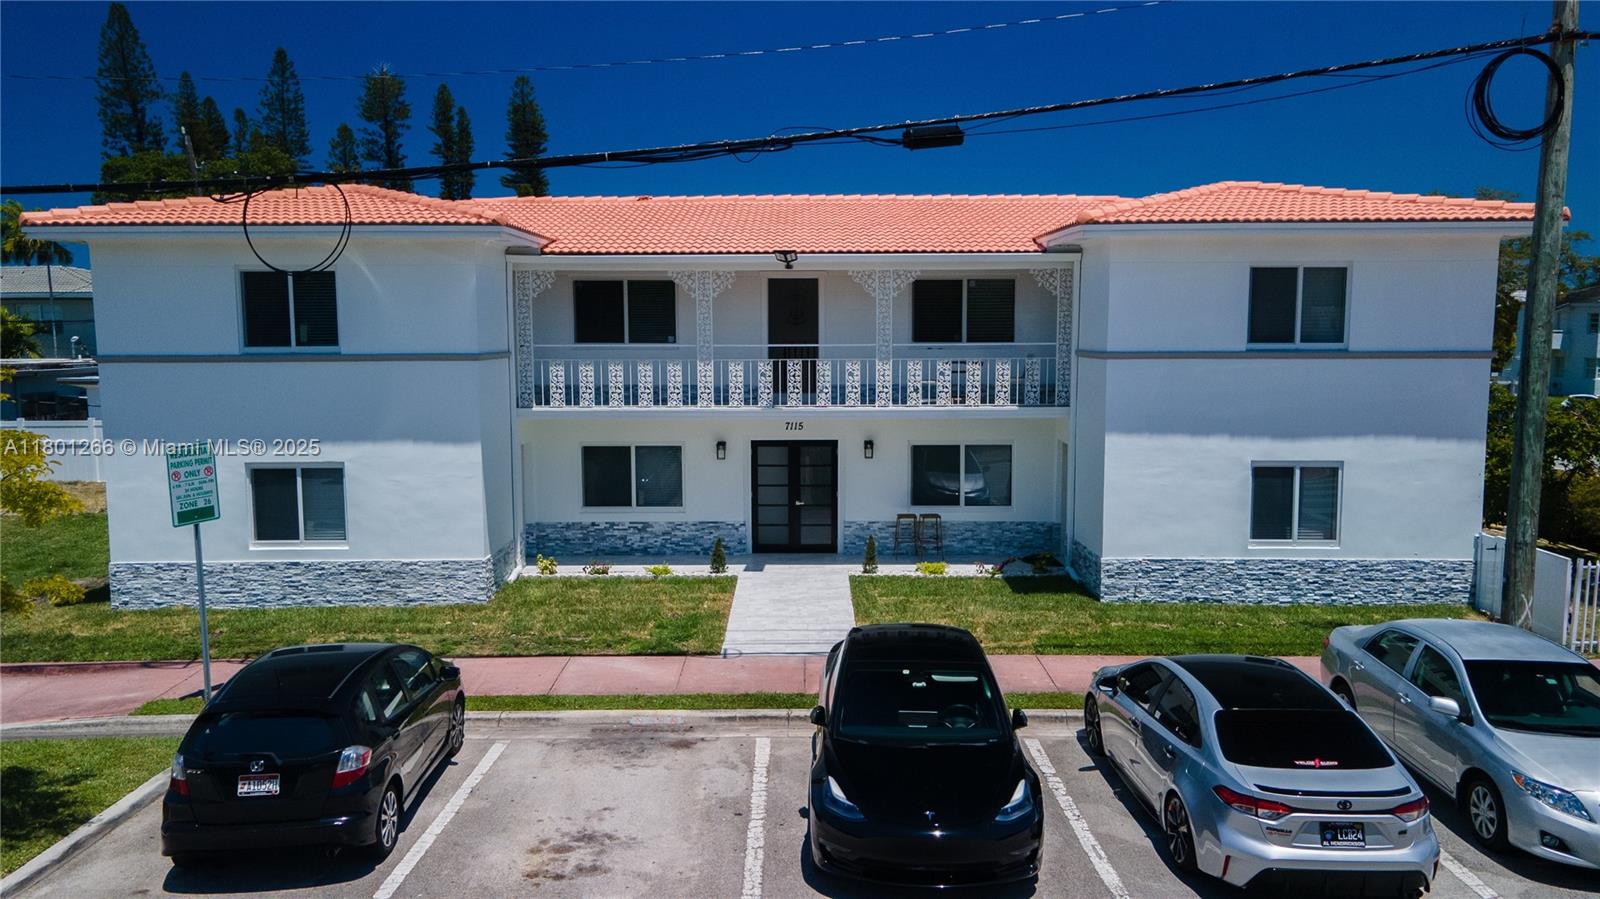
7115 Rue Granville, Miami Beach, FL 33141
$-12,602
Cash flow
-25.8%
Cash-on-Cash Return
0.2%
Cap rate
0.1%
Rent to Value Ratio
Active
$425,000
1
bds
|
1
ba
|
731
sqft
|
built
1960
1500 Bay Rd, Miami Beach, FL 33139
$-1,823
Cash flow
-22.4%
Cash-on-Cash Return
1.0%
Cap rate
0.7%
Rent to Value Ratio

Active
$269,000
1
bds
|
1
ba
|
609
sqft
|
built
1965
1200 West Ave, Miami Beach, FL 33139
$-806
Cash flow
-15.6%
Cash-on-Cash Return
2.6%
Cap rate
0.9%
Rent to Value Ratio
Active
$7,650,000
6
bds
|
4
ba
|
5,700
sqft
|
built
1936
5905 N Bay Rd, Miami Beach, FL 33140
$-43,008
Cash flow
-29.3%
Cash-on-Cash Return
-0.6%
Cap rate
0.1%
Rent to Value Ratio
Active
$219,000
bds
|
1
ba
|
440
sqft
|
built
1937
359 Meridian Ave, Miami Beach, FL 33139
$-295
Cash flow
-7.0%
Cash-on-Cash Return
4.5%
Cap rate
0.7%
Rent to Value Ratio
Active
$995,000
3
bds
|
2
ba
|
1,780
sqft
|
built
1982
5845 Collins Ave, Miami Beach, FL 33140
$-4,160
Cash flow
-21.8%
Cash-on-Cash Return
1.1%
Cap rate
0.5%
Rent to Value Ratio
Active
$1,600,000
2
bds
|
2
ba
|
1,437
sqft
|
built
2003
400 Alton Rd, Miami Beach, FL 33139
$-5,731
Cash flow
-18.7%
Cash-on-Cash Return
1.8%
Cap rate
0.6%
Rent to Value Ratio

Active
$450,000
1
bds
|
1
ba
|
810
sqft
|
built
1966
5161 Collins Ave, Miami Beach, FL 33140
$-1,057
Cash flow
-12.3%
Cash-on-Cash Return
3.3%
Cap rate
0.8%
Rent to Value Ratio
Active
$1,280,000
2
bds
|
2
ba
|
1,058
sqft
|
built
2005
540 West Ave, Miami Beach, FL 33139
$-4,024
Cash flow
-16.4%
Cash-on-Cash Return
2.4%
Cap rate
0.4%
Rent to Value Ratio
Active
$999,000
2
bds
|
2
ba
|
1,524
sqft
|
built
1982
6061 Collins Ave, Miami Beach, FL 33140
$-3,785
Cash flow
-19.8%
Cash-on-Cash Return
1.6%
Cap rate
0.6%
Rent to Value Ratio

Active
$699,900
2
bds
|
2
ba
|
824
sqft
|
built
1969
5701 Collins Ave, Miami Beach, FL 33140
$-3,323
Cash flow
-24.8%
Cash-on-Cash Return
0.4%
Cap rate
0.5%
Rent to Value Ratio
Active
$2,150,000
5
bds
|
5
ba
|
2,474
sqft
|
built
1952
420 N Shore Dr, Miami Beach, FL 33141
$-4,197
Cash flow
-10.2%
Cash-on-Cash Return
3.8%
Cap rate
0.5%
Rent to Value Ratio
Active
$318,000
1
bds
|
1
ba
|
1,005
sqft
|
built
1973
6900 Bay Dr, Miami Beach, FL 33141
$-1,343
Cash flow
-22.0%
Cash-on-Cash Return
1.1%
Cap rate
0.8%
Rent to Value Ratio
Active
$579,000
3
bds
|
2
ba
|
0
sqft
|
built
1948
759 85th St, Miami Beach, FL 33141
$-997
Cash flow
-9.0%
Cash-on-Cash Return
4.1%
Cap rate
0.6%
Rent to Value Ratio
Active
$1,980,000
3
bds
|
3
ba
|
1,505
sqft
|
built
1947
1201 S Biscayne Point Rd, Miami Beach, FL 33141
$-8,039
Cash flow
-21.2%
Cash-on-Cash Return
1.3%
Cap rate
0.3%
Rent to Value Ratio
Active
$598,900
4
bds
|
3
ba
|
1,632
sqft
|
built
1956
7342 Gary Ave, Miami Beach, FL 33141
$-1,071
Cash flow
-9.3%
Cash-on-Cash Return
4.0%
Cap rate
0.7%
Rent to Value Ratio
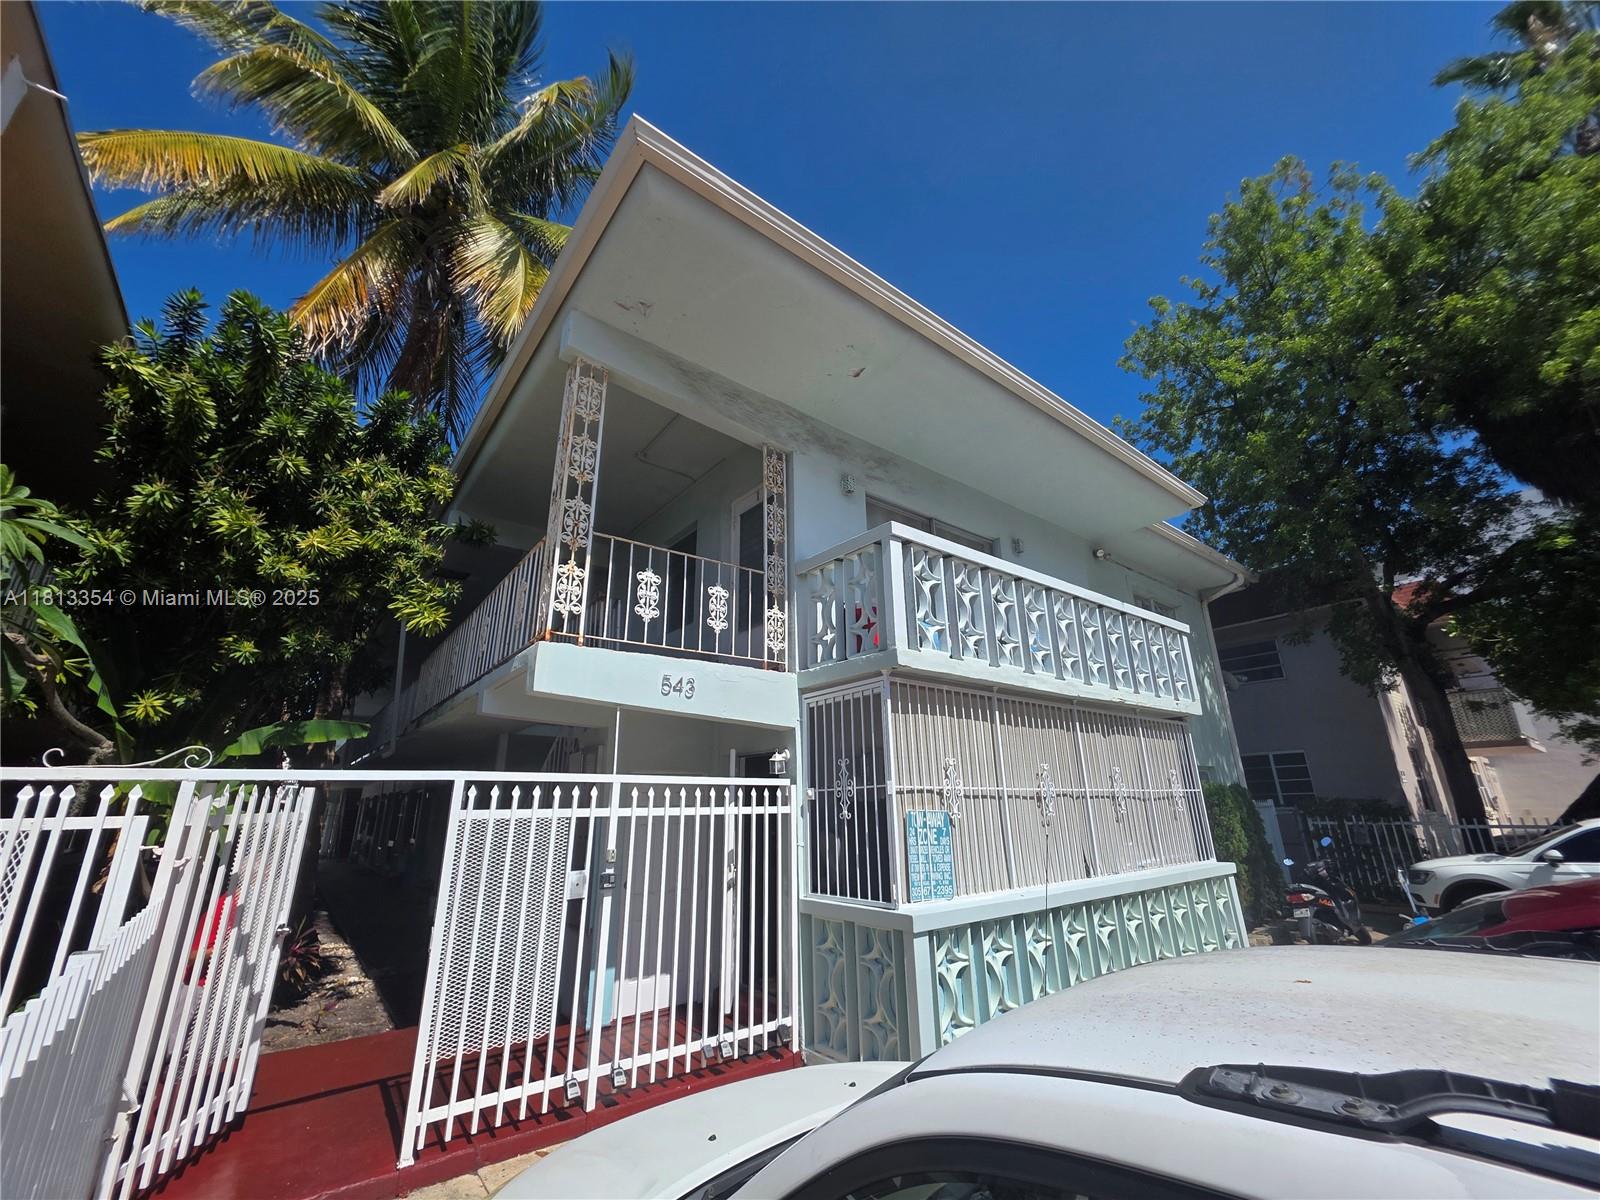
Active
$279,999
1
bds
|
1
ba
|
600
sqft
|
built
1965
543 Meridian Ave, Miami Beach, FL 33139
$-881
Cash flow
-16.4%
Cash-on-Cash Return
2.4%
Cap rate
0.8%
Rent to Value Ratio
Active
$790,000
2
bds
|
2
ba
|
1,190
sqft
|
built
1965
100 Lincoln Rd, Miami Beach, FL 33139
$-1,323
Cash flow
-8.7%
Cash-on-Cash Return
4.1%
Cap rate
0.6%
Rent to Value Ratio
Active
$345,000
2
bds
|
2
ba
|
1,100
sqft
|
built
1966
2016 Bay Dr, Miami Beach, FL 33141
$-1,464
Cash flow
-22.1%
Cash-on-Cash Return
1.1%
Cap rate
0.8%
Rent to Value Ratio

Active
$525,000
2
bds
|
2
ba
|
870
sqft
|
built
1997
1621 Bay Rd, Miami Beach, FL 33139
$-1,988
Cash flow
-19.8%
Cash-on-Cash Return
1.6%
Cap rate
0.7%
Rent to Value Ratio
Active
$299,000
0
bds
|
1
ba
|
326
sqft
|
built
1926
1619 Jefferson Ave, Miami Beach, FL 33139
$-749
Cash flow
-13.1%
Cash-on-Cash Return
3.1%
Cap rate
0.6%
Rent to Value Ratio
Active
$305,000
2
bds
|
1
ba
|
931
sqft
|
built
1955
340 84th St, Miami Beach, FL 33141
$-842
Cash flow
-14.4%
Cash-on-Cash Return
2.8%
Cap rate
0.8%
Rent to Value Ratio
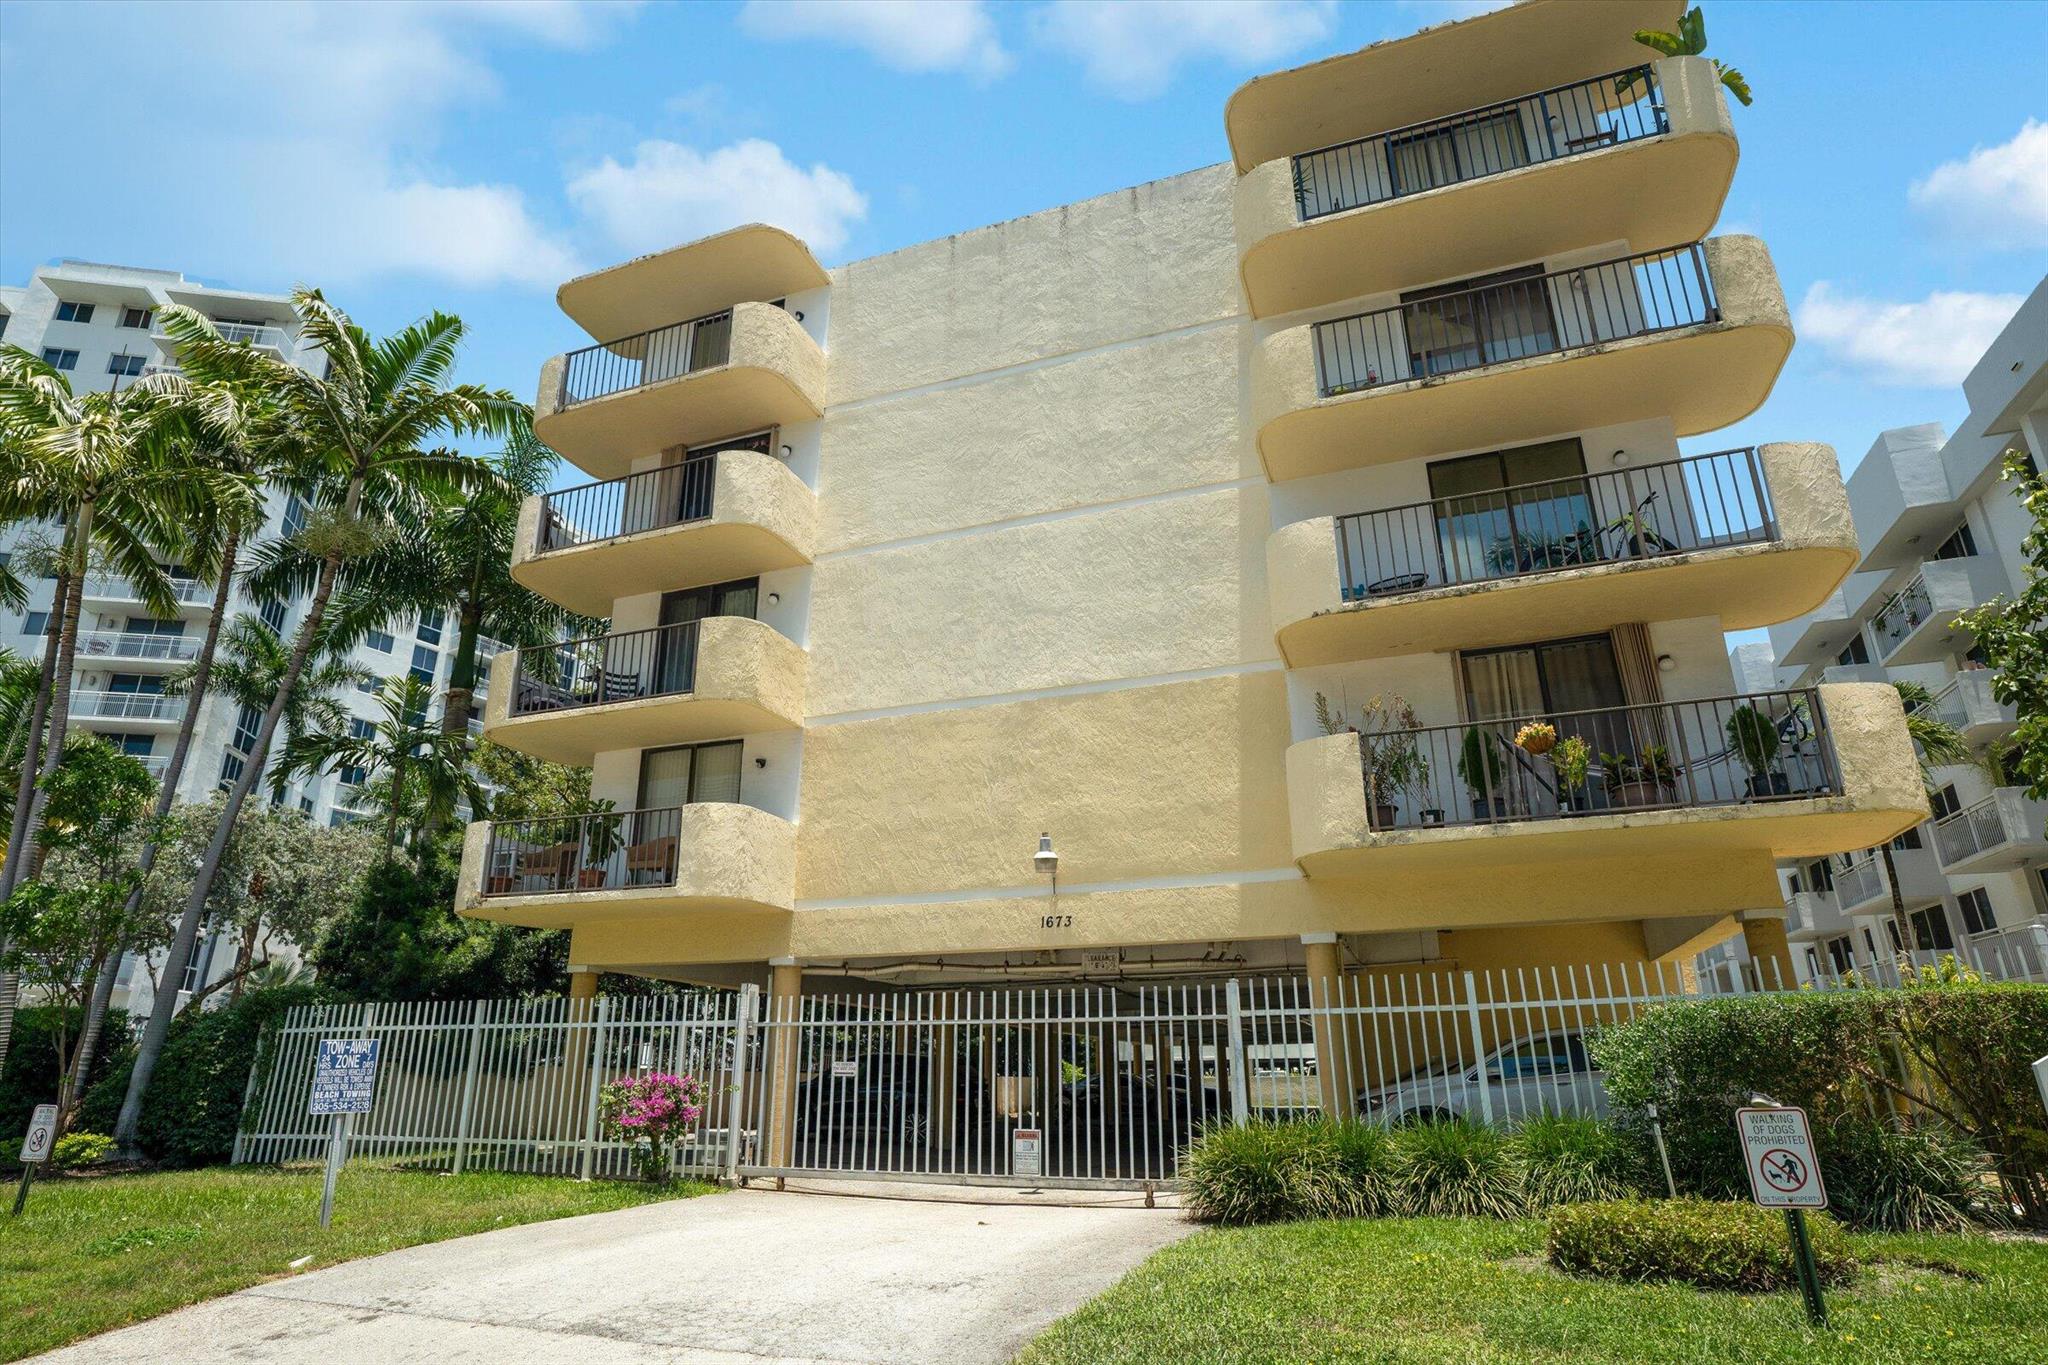
Active
$425,000
2
bds
|
2
ba
|
875
sqft
|
built
1980
1673 Bay Rd, Miami Beach, FL 33139
$-857
Cash flow
-10.5%
Cash-on-Cash Return
3.7%
Cap rate
0.8%
Rent to Value Ratio
Active
$695,000
2
bds
|
2
ba
|
1,300
sqft
|
built
1976
2455 Flamingo Dr, Miami Beach, FL 33140
$-3,028
Cash flow
-22.7%
Cash-on-Cash Return
0.9%
Cap rate
0.5%
Rent to Value Ratio
Active
$235,000
1
bds
|
1
ba
|
639
sqft
|
built
1963
8040 Tatum Waterway Dr, Miami Beach, FL 33141
$-574
Cash flow
-12.7%
Cash-on-Cash Return
3.2%
Cap rate
0.9%
Rent to Value Ratio
Active
$319,000
0
bds
|
1
ba
|
682
sqft
|
built
1968
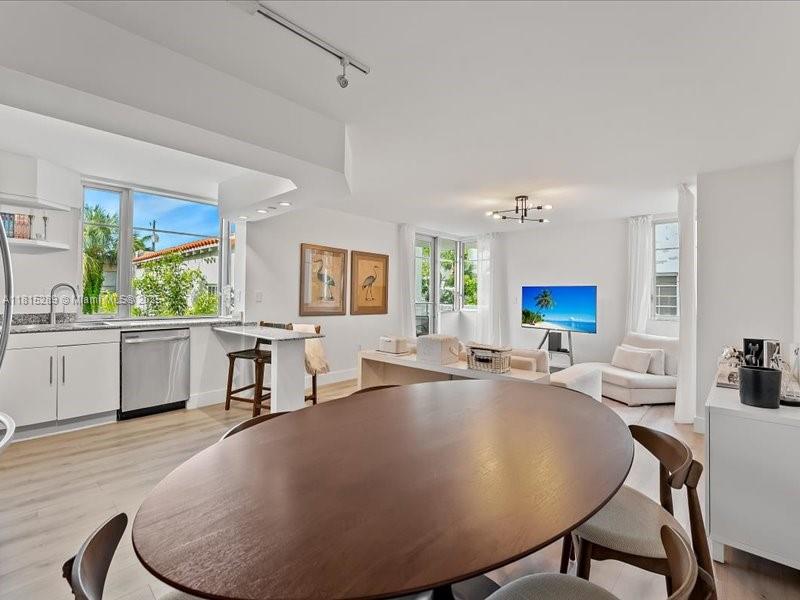
1000 West Ave, Miami Beach, FL 33139
$-1,033
Cash flow
-16.9%
Cash-on-Cash Return
2.3%
Cap rate
0.8%
Rent to Value Ratio