Miami Beach, FL Investment Properties for Sale
Browse homes for sale and investment properties in Miami Beach, FL. Refine your search by price, property type, or more.
Best cash flowing properties in Miami Beach, FL

Active
$259,000
1
bds
|
1
ba
|
750
sqft
|
built
1965
8000 Harding Ave, Miami Beach, FL 33141
$-540
Cash flow
-10.9%
Cash-on-Cash Return
3.8%
Cap rate
0.8%
Rent to Value Ratio
Active
$199,000
1
bds
|
1
ba
|
500
sqft
|
built
1970
631 Jefferson Ave, Miami Beach, FL 33139
$-650
Cash flow
-17.0%
Cash-on-Cash Return
2.3%
Cap rate
0.9%
Rent to Value Ratio
1,940 out of 2,138 properties for sale in Miami Beach, FL
Limited Results Shown
Create a free account, or log in to reveal all property listings and enjoy the complete experience.
Active
$650,000
1
bds
|
1
ba
|
1,011
sqft
|
built
2010
6000 Collins Ave, Miami Beach, FL 33140
$-2,033
Cash flow
-16.3%
Cash-on-Cash Return
2.5%
Cap rate
0.7%
Rent to Value Ratio

Active
$895,000
1
bds
|
1
ba
|
820
sqft
|
built
2008
6899 Collins Ave, Miami Beach, FL 33141
$-3,091
Cash flow
-18.0%
Cash-on-Cash Return
2.1%
Cap rate
0.8%
Rent to Value Ratio

Active
$575,000
1
bds
|
1
ba
|
696
sqft
|
built
2008
1100 West Ave, Miami Beach, FL 33139
$-3,180
Cash flow
-28.9%
Cash-on-Cash Return
-0.4%
Cap rate
0.7%
Rent to Value Ratio

Active
$333,000
2
bds
|
2
ba
|
1,038
sqft
|
built
1969
8001 Crespi Blvd, Miami Beach, FL 33141
$-1,084
Cash flow
-17.0%
Cash-on-Cash Return
2.4%
Cap rate
0.8%
Rent to Value Ratio
Active
$199,000
1
bds
|
1
ba
|
500
sqft
|
built
1970
631 Jefferson Ave, Miami Beach, FL 33139
$-650
Cash flow
-17.0%
Cash-on-Cash Return
2.3%
Cap rate
0.9%
Rent to Value Ratio

Active
$3,399,000
3
bds
|
3
ba
|
1,761
sqft
|
built
2004
6365 Collins Ave, Miami Beach, FL 33141
$-14,914
Cash flow
-22.9%
Cash-on-Cash Return
1.0%
Cap rate
0.3%
Rent to Value Ratio

Active
$3,700,000
2
bds
|
3
ba
|
1,565
sqft
|
built
2004
101 20th St, Miami Beach, FL 33139
$-24,882
Cash flow
-35.1%
Cash-on-Cash Return
-1.8%
Cap rate
0.2%
Rent to Value Ratio

Active
$820,000
1
bds
|
2
ba
|
930
sqft
|
built
1968
5601 Collins Ave, Miami Beach, FL 33140
$-3,090
Cash flow
-19.7%
Cash-on-Cash Return
1.7%
Cap rate
0.5%
Rent to Value Ratio
Active
$385,000
1
bds
|
2
ba
|
855
sqft
|
built
1970
5838 Collins Ave, Miami Beach, FL 33140
$-1,840
Cash flow
-24.9%
Cash-on-Cash Return
0.5%
Cap rate
0.6%
Rent to Value Ratio
Active
$399,000
2
bds
|
2
ba
|
1,020
sqft
|
built
1964
7441 Wayne Ave, Miami Beach, FL 33141
$-1,783
Cash flow
-23.3%
Cash-on-Cash Return
0.9%
Cap rate
0.7%
Rent to Value Ratio
Active
$520,000
2
bds
|
2
ba
|
1,010
sqft
|
built
1971
6039 Collins Ave, Miami Beach, FL 33140
$-1,989
Cash flow
-20.0%
Cash-on-Cash Return
1.7%
Cap rate
0.6%
Rent to Value Ratio
Active
$1,160,000
bds
|
1
ba
|
490
sqft
|
built
2009
2201 Collins Ave, Miami Beach, FL 33139
$-4,103
Cash flow
-18.5%
Cash-on-Cash Return
2.0%
Cap rate
0.4%
Rent to Value Ratio

Active
$950,000
2
bds
|
2
ba
|
1,403
sqft
|
built
1962
20 Island Ave, Miami Beach, FL 33139
$-2,465
Cash flow
-13.5%
Cash-on-Cash Return
3.2%
Cap rate
0.7%
Rent to Value Ratio
Active
$259,000
1
bds
|
1
ba
|
750
sqft
|
built
1965
8000 Harding Ave, Miami Beach, FL 33141
$-540
Cash flow
-10.9%
Cash-on-Cash Return
3.8%
Cap rate
0.8%
Rent to Value Ratio

Active
$350,000
bds
|
1
ba
|
565
sqft
|
built
1965
100 Lincoln Rd, Miami Beach, FL 33139
$-1,329
Cash flow
-19.8%
Cash-on-Cash Return
1.7%
Cap rate
0.7%
Rent to Value Ratio
Active
$15,999,000
5
bds
|
3
ba
|
2,293
sqft
|
built
1925
7837 Atlantic Way, Miami Beach, FL 33141
$-85,341
Cash flow
-27.8%
Cash-on-Cash Return
-0.1%
Cap rate
0.1%
Rent to Value Ratio

Active
$290,000
bds
|
1
ba
|
290
sqft
|
built
1941
255 W 24th St, Miami Beach, FL 33140
$-977
Cash flow
-17.6%
Cash-on-Cash Return
2.2%
Cap rate
0.8%
Rent to Value Ratio
Active
$699,000
1
bds
|
2
ba
|
1,060
sqft
|
built
1966
5151 Collins Ave, Miami Beach, FL 33140
$-3,007
Cash flow
-22.4%
Cash-on-Cash Return
1.1%
Cap rate
0.6%
Rent to Value Ratio
Active
$499,000
1
bds
|
2
ba
|
808
sqft
|
built
1969
6917 Collins Ave, Miami Beach, FL 33141
$-2,217
Cash flow
-23.2%
Cash-on-Cash Return
0.9%
Cap rate
0.6%
Rent to Value Ratio

Active
$320,000
1
bds
|
1
ba
|
720
sqft
|
built
1949
1330 Drexel Ave, Miami Beach, FL 33139
$-995
Cash flow
-16.2%
Cash-on-Cash Return
2.5%
Cap rate
0.7%
Rent to Value Ratio
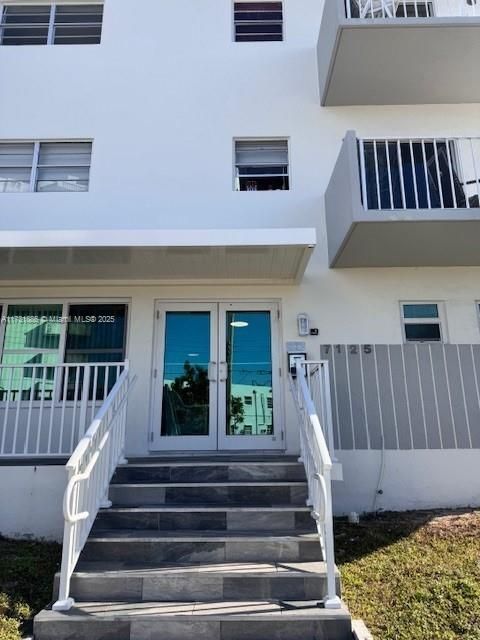
Active under contract
$235,000
1
bds
|
2
ba
|
750
sqft
|
built
1978
7125 Bonita Dr, Miami Beach, FL 33141
$-894
Cash flow
-19.8%
Cash-on-Cash Return
1.7%
Cap rate
0.9%
Rent to Value Ratio

Active
$270,000
1
bds
|
2
ba
|
676
sqft
|
built
1971
6969 Collins Ave, Miami Beach, FL 33141
$-906
Cash flow
-17.5%
Cash-on-Cash Return
2.2%
Cap rate
0.8%
Rent to Value Ratio
Active
$4,975,000
2
bds
|
2
ba
|
1,316
sqft
|
built
2004
101 20th St, Miami Beach, FL 33139
$-30,839
Cash flow
-32.3%
Cash-on-Cash Return
-1.2%
Cap rate
0.2%
Rent to Value Ratio
Active
$2,475,000
1
bds
|
2
ba
|
821
sqft
|
built
2004
101 20th St, Miami Beach, FL 33139
$-14,408
Cash flow
-30.4%
Cash-on-Cash Return
-0.7%
Cap rate
0.3%
Rent to Value Ratio

Active
$2,850,000
3
bds
|
3
ba
|
2,452
sqft
|
built
1940
3722 Royal Palm Ave, Miami Beach, FL 33140
$-10,655
Cash flow
-19.5%
Cash-on-Cash Return
1.8%
Cap rate
0.3%
Rent to Value Ratio
Active
$8,399,000
3
bds
|
4
ba
|
2,774
sqft
|
built
2015
321 Ocean Dr, Miami Beach, FL 33139
$-54,770
Cash flow
-34.0%
Cash-on-Cash Return
-1.6%
Cap rate
0.1%
Rent to Value Ratio
Active
$2,150,000
3
bds
|
2
ba
|
2,179
sqft
|
built
1949
835 Fairway Dr, Miami Beach, FL 33141
$-5,095
Cash flow
-12.4%
Cash-on-Cash Return
3.4%
Cap rate
0.5%
Rent to Value Ratio

Active
$339,000
1
bds
|
1
ba
|
726
sqft
|
built
1966
2899 Collins Ave, Miami Beach, FL 33140
$-871
Cash flow
-13.4%
Cash-on-Cash Return
3.2%
Cap rate
0.8%
Rent to Value Ratio

Active
$785,000
1
bds
|
2
ba
|
890
sqft
|
built
1982
2555 Collins Ave, Miami Beach, FL 33140
$-3,480
Cash flow
-23.1%
Cash-on-Cash Return
0.9%
Cap rate
0.5%
Rent to Value Ratio

Active
$325,000
2
bds
|
2
ba
|
1,181
sqft
|
built
1964
7441 Wayne Ave, Miami Beach, FL 33141
$-843
Cash flow
-13.5%
Cash-on-Cash Return
3.2%
Cap rate
1.0%
Rent to Value Ratio

Active
$925,000
1
bds
|
1
ba
|
720
sqft
|
built
2008
6801 Collins Ave, Miami Beach, FL 33141
$-2,743
Cash flow
-15.5%
Cash-on-Cash Return
2.7%
Cap rate
0.8%
Rent to Value Ratio

Active
$348,500
1
bds
|
1
ba
|
613
sqft
|
built
1936
435 21st St, Miami Beach, FL 33139
$-1,447
Cash flow
-21.7%
Cash-on-Cash Return
1.3%
Cap rate
0.8%
Rent to Value Ratio

Active
$695,000
1
bds
|
2
ba
|
930
sqft
|
built
1968
5601 Collins Ave, Miami Beach, FL 33140
$-2,958
Cash flow
-22.2%
Cash-on-Cash Return
1.2%
Cap rate
0.5%
Rent to Value Ratio

Active
$670,000
1
bds
|
2
ba
|
930
sqft
|
built
1968
5601 Collins Ave, Miami Beach, FL 33140
$-2,510
Cash flow
-19.5%
Cash-on-Cash Return
1.8%
Cap rate
0.6%
Rent to Value Ratio
Active
$259,000
1
bds
|
1
ba
|
900
sqft
|
built
1969
7133 Bay Dr, Miami Beach, FL 33141
$-975
Cash flow
-19.6%
Cash-on-Cash Return
1.7%
Cap rate
0.9%
Rent to Value Ratio

Active
$780,000
2
bds
|
2
ba
|
1,290
sqft
|
built
1968
5601 Collins Ave, Miami Beach, FL 33140
$-3,459
Cash flow
-23.1%
Cash-on-Cash Return
0.9%
Cap rate
0.5%
Rent to Value Ratio

Active
$850,000
2
bds
|
2
ba
|
1,088
sqft
|
built
1980
1623 Collins Ave, Miami Beach, FL 33139
$-2,771
Cash flow
-17.0%
Cash-on-Cash Return
2.4%
Cap rate
0.6%
Rent to Value Ratio
Active
$395,000
1
bds
|
2
ba
|
1,046
sqft
|
built
1964
5005 Collins Ave, Miami Beach, FL 33140
$-1,993
Cash flow
-26.3%
Cash-on-Cash Return
0.2%
Cap rate
0.7%
Rent to Value Ratio
Active
$185,000
1
bds
|
1
ba
|
440
sqft
|
built
1940
900 Jefferson Ave, Miami Beach, FL 33139
$-715
Cash flow
-20.2%
Cash-on-Cash Return
1.6%
Cap rate
0.9%
Rent to Value Ratio

Active
$765,000
2
bds
|
2
ba
|
1,515
sqft
|
built
1968
5750 Collins Ave, Miami Beach, FL 33140
$-1,310
Cash flow
-8.9%
Cash-on-Cash Return
4.2%
Cap rate
0.6%
Rent to Value Ratio