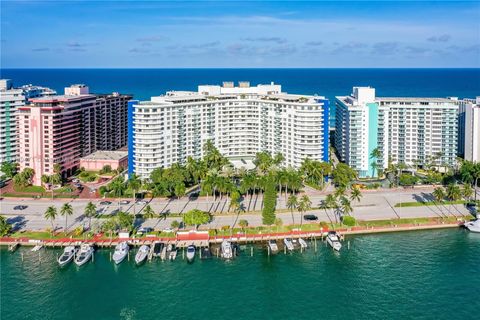
Miami Beach, FL Investment Properties for Sale
Browse homes for sale and investment properties in Miami Beach, FL. Refine your search by price, property type, or more.
Best cash flowing properties in Miami Beach, FL

Active
$255,000
bds
|
1
ba
|
470
sqft
|
built
1962
641 Espanola Way, Miami Beach, FL 33139
$-323
Cash flow
-6.6%
Cash-on-Cash Return
4.6%
Cap rate
0.9%
Rent to Value Ratio

Active
$259,000
1
bds
|
1
ba
|
750
sqft
|
built
1965
8000 Harding Ave, Miami Beach, FL 33141
$-515
Cash flow
-10.4%
Cash-on-Cash Return
3.8%
Cap rate
0.8%
Rent to Value Ratio
1,961 out of 2,246 properties for sale in Miami Beach, FL
Limited Results Shown
Create a free account, or log in to reveal all property listings and enjoy the complete experience.

Active
$3,399,000
3
bds
|
3
ba
|
1,761
sqft
|
built
2004
6365 Collins Ave, Miami Beach, FL 33141
$-14,580
Cash flow
-22.4%
Cash-on-Cash Return
1.0%
Cap rate
0.3%
Rent to Value Ratio

Active
$950,000
2
bds
|
2
ba
|
1,403
sqft
|
built
1962
20 Island Ave, Miami Beach, FL 33139
$-2,371
Cash flow
-13.0%
Cash-on-Cash Return
3.2%
Cap rate
0.7%
Rent to Value Ratio
Active
$259,000
1
bds
|
1
ba
|
750
sqft
|
built
1965
8000 Harding Ave, Miami Beach, FL 33141
$-515
Cash flow
-10.4%
Cash-on-Cash Return
3.8%
Cap rate
0.8%
Rent to Value Ratio

Active
$320,000
1
bds
|
1
ba
|
720
sqft
|
built
1949
1330 Drexel Ave, Miami Beach, FL 33139
$-963
Cash flow
-15.7%
Cash-on-Cash Return
2.5%
Cap rate
0.7%
Rent to Value Ratio
Active
$699,000
1
bds
|
2
ba
|
1,060
sqft
|
built
1966
5151 Collins Ave, Miami Beach, FL 33140
$-2,939
Cash flow
-21.9%
Cash-on-Cash Return
1.1%
Cap rate
0.6%
Rent to Value Ratio
Active
$499,000
1
bds
|
2
ba
|
808
sqft
|
built
1969
6917 Collins Ave, Miami Beach, FL 33141
$-2,168
Cash flow
-22.7%
Cash-on-Cash Return
0.9%
Cap rate
0.6%
Rent to Value Ratio

Active
$290,000
bds
|
1
ba
|
290
sqft
|
built
1941
255 W 24th St, Miami Beach, FL 33140
$-949
Cash flow
-17.1%
Cash-on-Cash Return
2.2%
Cap rate
0.8%
Rent to Value Ratio
Active
$15,999,000
5
bds
|
3
ba
|
2,293
sqft
|
built
1925
7837 Atlantic Way, Miami Beach, FL 33141
$-83,770
Cash flow
-27.3%
Cash-on-Cash Return
-0.1%
Cap rate
0.1%
Rent to Value Ratio

Active
$350,000
bds
|
1
ba
|
565
sqft
|
built
1965
100 Lincoln Rd, Miami Beach, FL 33139
$-1,295
Cash flow
-19.3%
Cash-on-Cash Return
1.7%
Cap rate
0.7%
Rent to Value Ratio

Active
$270,000
1
bds
|
2
ba
|
676
sqft
|
built
1971
6969 Collins Ave, Miami Beach, FL 33141
$-879
Cash flow
-17.0%
Cash-on-Cash Return
2.2%
Cap rate
0.8%
Rent to Value Ratio
Active
$4,975,000
2
bds
|
2
ba
|
1,316
sqft
|
built
2004
101 20th St, Miami Beach, FL 33139
$-30,350
Cash flow
-31.8%
Cash-on-Cash Return
-1.2%
Cap rate
0.2%
Rent to Value Ratio
Active
$8,399,000
3
bds
|
4
ba
|
2,774
sqft
|
built
2015
321 Ocean Dr, Miami Beach, FL 33139
$-53,945
Cash flow
-33.5%
Cash-on-Cash Return
-1.6%
Cap rate
0.1%
Rent to Value Ratio

Active
$2,850,000
3
bds
|
3
ba
|
2,452
sqft
|
built
1940
3722 Royal Palm Ave, Miami Beach, FL 33140
$-10,375
Cash flow
-19.0%
Cash-on-Cash Return
1.8%
Cap rate
0.3%
Rent to Value Ratio
Active
$2,475,000
1
bds
|
2
ba
|
821
sqft
|
built
2004
101 20th St, Miami Beach, FL 33139
$-14,165
Cash flow
-29.9%
Cash-on-Cash Return
-0.7%
Cap rate
0.3%
Rent to Value Ratio
Active
$2,150,000
3
bds
|
2
ba
|
2,179
sqft
|
built
1949
835 Fairway Dr, Miami Beach, FL 33141
$-4,883
Cash flow
-11.8%
Cash-on-Cash Return
3.4%
Cap rate
0.5%
Rent to Value Ratio

Active
$348,500
1
bds
|
1
ba
|
613
sqft
|
built
1936
435 21st St, Miami Beach, FL 33139
$-1,413
Cash flow
-21.2%
Cash-on-Cash Return
1.3%
Cap rate
0.8%
Rent to Value Ratio

Active
$339,000
1
bds
|
1
ba
|
726
sqft
|
built
1966
2899 Collins Ave, Miami Beach, FL 33140
$-838
Cash flow
-12.9%
Cash-on-Cash Return
3.2%
Cap rate
0.8%
Rent to Value Ratio

Active
$785,000
1
bds
|
2
ba
|
890
sqft
|
built
1982
2555 Collins Ave, Miami Beach, FL 33140
$-3,403
Cash flow
-22.6%
Cash-on-Cash Return
0.9%
Cap rate
0.5%
Rent to Value Ratio

Active
$925,000
1
bds
|
1
ba
|
720
sqft
|
built
2008
6801 Collins Ave, Miami Beach, FL 33141
$-2,652
Cash flow
-15.0%
Cash-on-Cash Return
2.7%
Cap rate
0.8%
Rent to Value Ratio

Active
$325,000
2
bds
|
2
ba
|
1,181
sqft
|
built
1964
7441 Wayne Ave, Miami Beach, FL 33141
$-811
Cash flow
-13.0%
Cash-on-Cash Return
3.2%
Cap rate
1.0%
Rent to Value Ratio

Active
$695,000
1
bds
|
2
ba
|
930
sqft
|
built
1968
5601 Collins Ave, Miami Beach, FL 33140
$-2,890
Cash flow
-21.7%
Cash-on-Cash Return
1.2%
Cap rate
0.5%
Rent to Value Ratio

Active
$780,000
2
bds
|
2
ba
|
1,290
sqft
|
built
1968
5601 Collins Ave, Miami Beach, FL 33140
$-3,383
Cash flow
-22.6%
Cash-on-Cash Return
0.9%
Cap rate
0.5%
Rent to Value Ratio

Active
$850,000
2
bds
|
2
ba
|
1,088
sqft
|
built
1980
1623 Collins Ave, Miami Beach, FL 33139
$-2,687
Cash flow
-16.5%
Cash-on-Cash Return
2.4%
Cap rate
0.6%
Rent to Value Ratio

Active
$670,000
1
bds
|
2
ba
|
930
sqft
|
built
1968
5601 Collins Ave, Miami Beach, FL 33140
$-2,444
Cash flow
-19.0%
Cash-on-Cash Return
1.8%
Cap rate
0.6%
Rent to Value Ratio
Active
$259,000
1
bds
|
1
ba
|
900
sqft
|
built
1969
7133 Bay Dr, Miami Beach, FL 33141
$-950
Cash flow
-19.1%
Cash-on-Cash Return
1.7%
Cap rate
0.9%
Rent to Value Ratio
Active
$395,000
1
bds
|
2
ba
|
1,046
sqft
|
built
1964
5005 Collins Ave, Miami Beach, FL 33140
$-1,954
Cash flow
-25.8%
Cash-on-Cash Return
0.2%
Cap rate
0.7%
Rent to Value Ratio
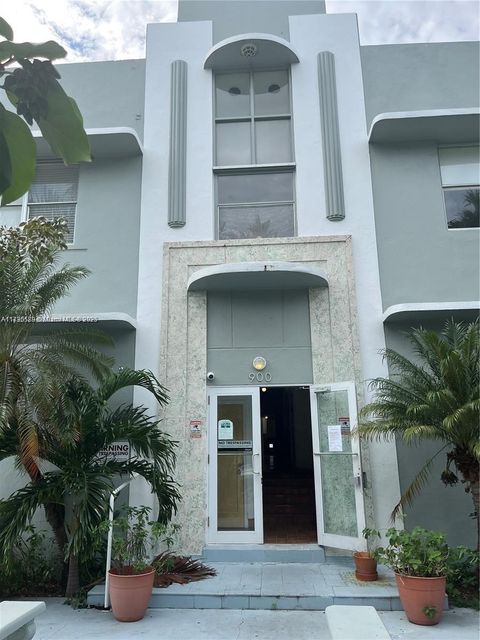
Active
$185,000
1
bds
|
1
ba
|
440
sqft
|
built
1940
900 Jefferson Ave, Miami Beach, FL 33139
$-697
Cash flow
-19.7%
Cash-on-Cash Return
1.6%
Cap rate
0.9%
Rent to Value Ratio
Active
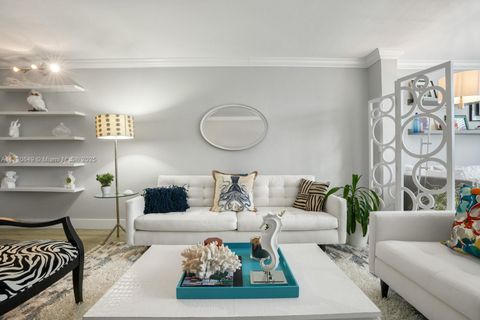
$255,000
bds
|
1
ba
|
470
sqft
|
built
1962
641 Espanola Way, Miami Beach, FL 33139
$-323
Cash flow
-6.6%
Cash-on-Cash Return
4.6%
Cap rate
0.9%
Rent to Value Ratio

Active
$200,000
bds
|
1
ba
|
392
sqft
|
built
1965
900 Euclid Ave, Miami Beach, FL 33139
$-542
Cash flow
-14.1%
Cash-on-Cash Return
2.9%
Cap rate
0.8%
Rent to Value Ratio
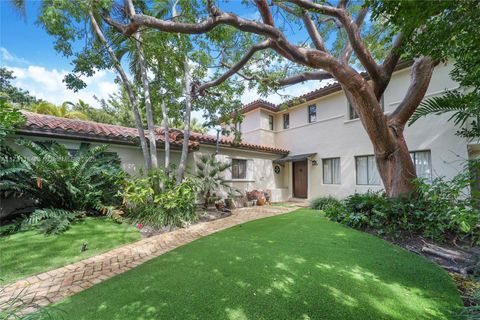
Active
$2,997,000
4
bds
|
2
ba
|
2,359
sqft
|
built
1937
6121 Lagorce Dr, Miami Beach, FL 33140
$-9,385
Cash flow
-16.3%
Cash-on-Cash Return
2.4%
Cap rate
0.3%
Rent to Value Ratio
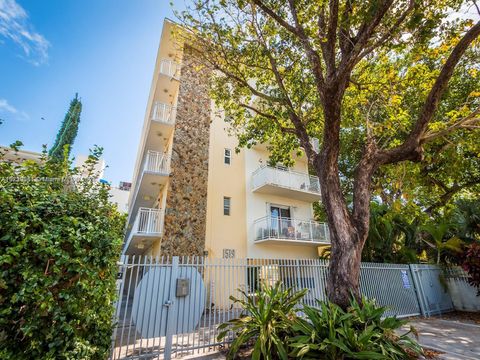
Active
$245,000
1
bds
|
1
ba
|
767
sqft
|
built
1970
1519 Drexel Ave, Miami Beach, FL 33139
$-808
Cash flow
-17.2%
Cash-on-Cash Return
2.2%
Cap rate
0.9%
Rent to Value Ratio

Active
$765,000
2
bds
|
2
ba
|
1,515
sqft
|
built
1968
5750 Collins Ave, Miami Beach, FL 33140
$-1,235
Cash flow
-8.4%
Cash-on-Cash Return
4.2%
Cap rate
0.6%
Rent to Value Ratio
Active
$899,000
2
bds
|
2
ba
|
1,200
sqft
|
built
1962
5225 Collins Ave, Miami Beach, FL 33140
$-3,495
Cash flow
-20.3%
Cash-on-Cash Return
1.5%
Cap rate
0.7%
Rent to Value Ratio
Active
$359,000
1
bds
|
1
ba
|
726
sqft
|
built
1966
2899 Collins Ave, Miami Beach, FL 33140
$-1,239
Cash flow
-18.0%
Cash-on-Cash Return
2.0%
Cap rate
0.7%
Rent to Value Ratio

Active
$399,999
2
bds
|
2
ba
|
1,064
sqft
|
built
1967
5555 Collins Ave, Miami Beach, FL 33140
$-2,132
Cash flow
-27.8%
Cash-on-Cash Return
-0.2%
Cap rate
0.7%
Rent to Value Ratio

Active
$1,125,000
3
bds
|
2
ba
|
1,191
sqft
|
built
1997
650 West Ave, Miami Beach, FL 33139
$-2,516
Cash flow
-11.7%
Cash-on-Cash Return
3.5%
Cap rate
0.7%
Rent to Value Ratio

Active
$1,225,000
2
bds
|
3
ba
|
1,450
sqft
|
built
2005
2001 Meridian Ave, Miami Beach, FL 33139
$-5,040
Cash flow
-21.5%
Cash-on-Cash Return
1.2%
Cap rate
0.6%
Rent to Value Ratio
Active
$1,155,500
3
bds
|
2
ba
|
1,710
sqft
|
built
1982
5845 Collins Ave, Miami Beach, FL 33140
$-4,444
Cash flow
-20.1%
Cash-on-Cash Return
1.5%
Cap rate
0.4%
Rent to Value Ratio
Active
$435,000
1
bds
|
2
ba
|
910
sqft
|
built
1968
6770 Indian Creek Dr, Miami Beach, FL 33141
$-970
Cash flow
-11.6%
Cash-on-Cash Return
3.5%
Cap rate
0.8%
Rent to Value Ratio

Active
$315,000
1
bds
|
1
ba
|
475
sqft
|
built
1939
1419 West Ave, Miami Beach, FL 33139
$-1,063
Cash flow
-17.6%
Cash-on-Cash Return
2.1%
Cap rate
0.6%
Rent to Value Ratio