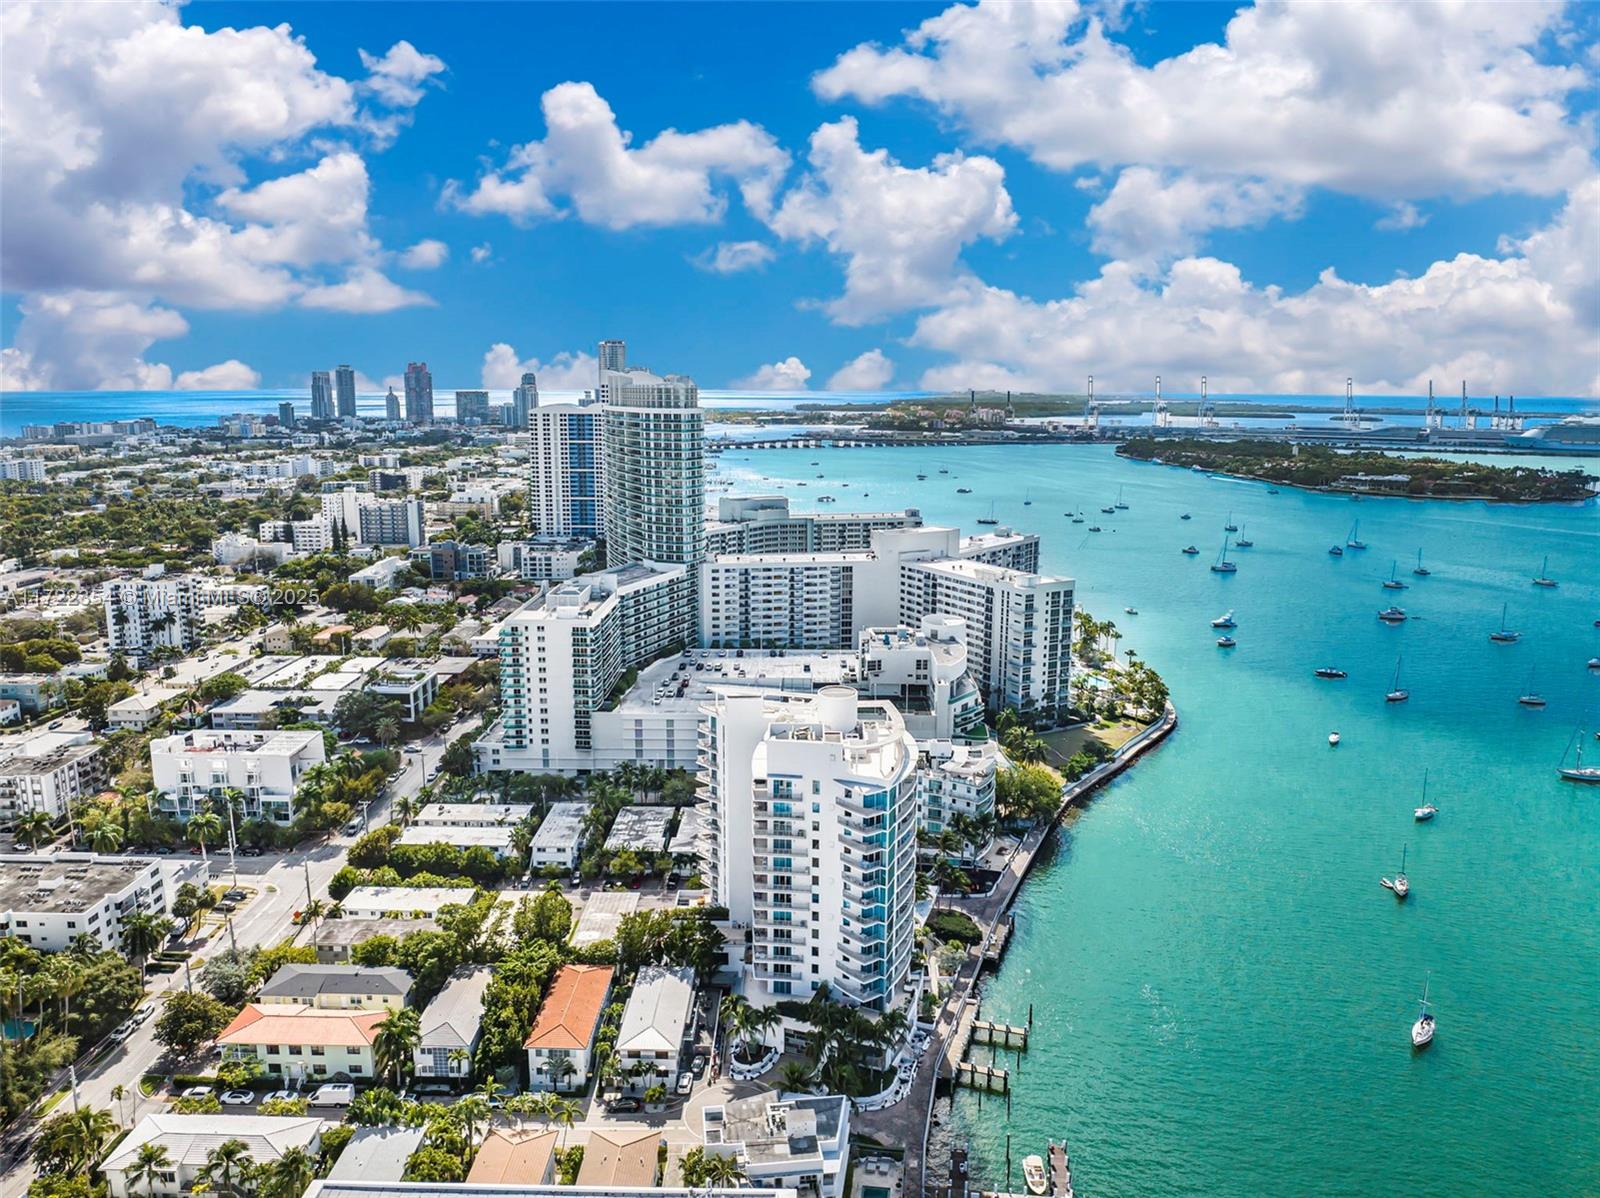
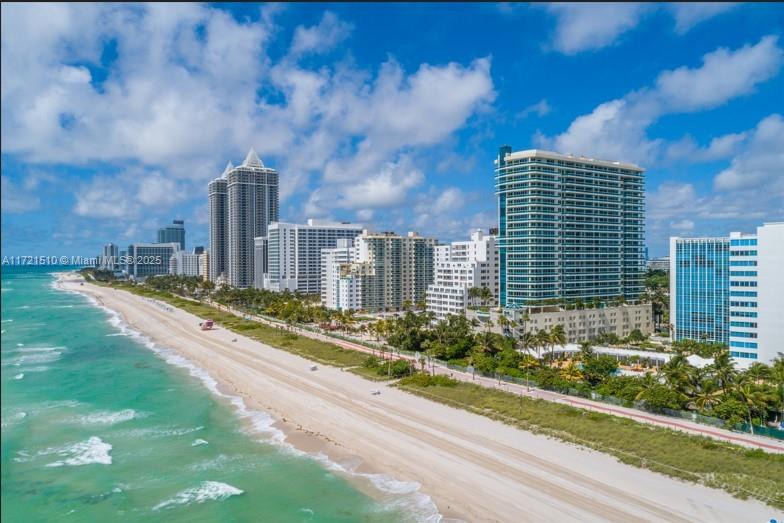
Miami Beach, FL Investment Properties for Sale
Browse homes for sale and investment properties in Miami Beach, FL. Refine your search by price, property type, or more.
Best cash flowing properties in Miami Beach, FL
Active
$240,000
1
bds
|
1
ba
|
450
sqft
|
built
1940
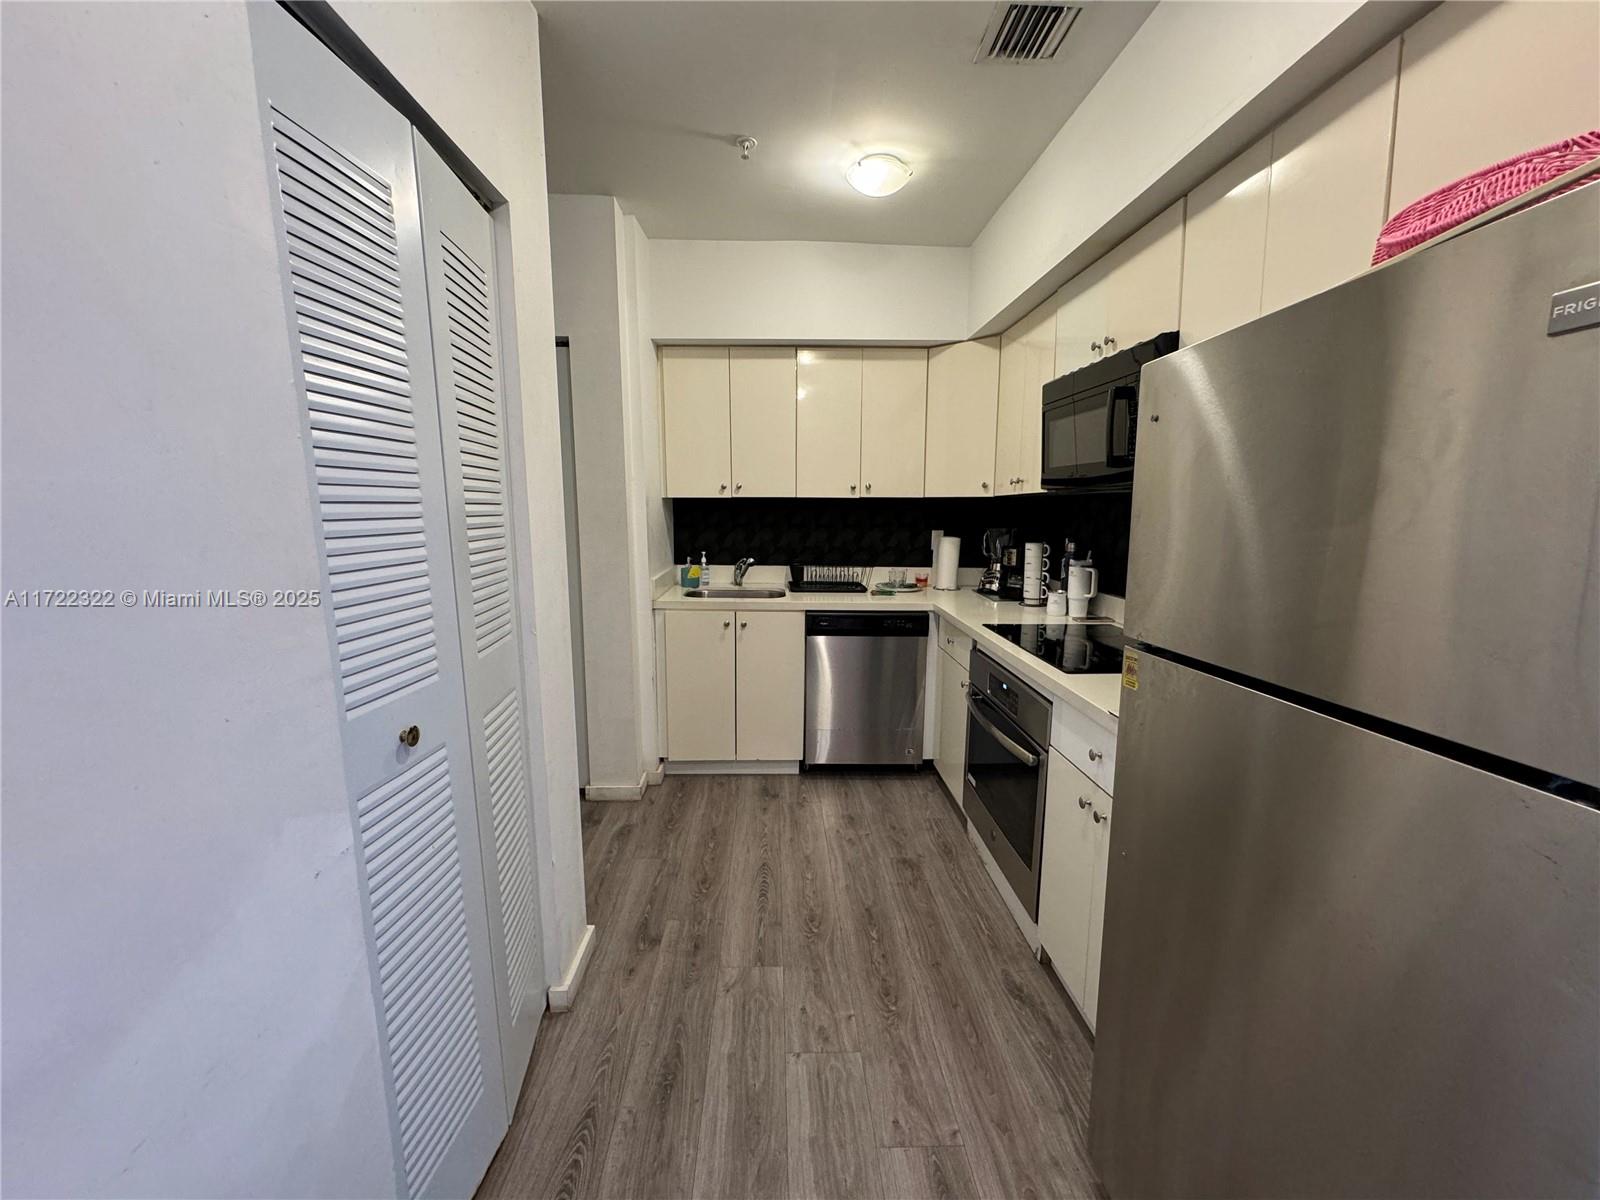
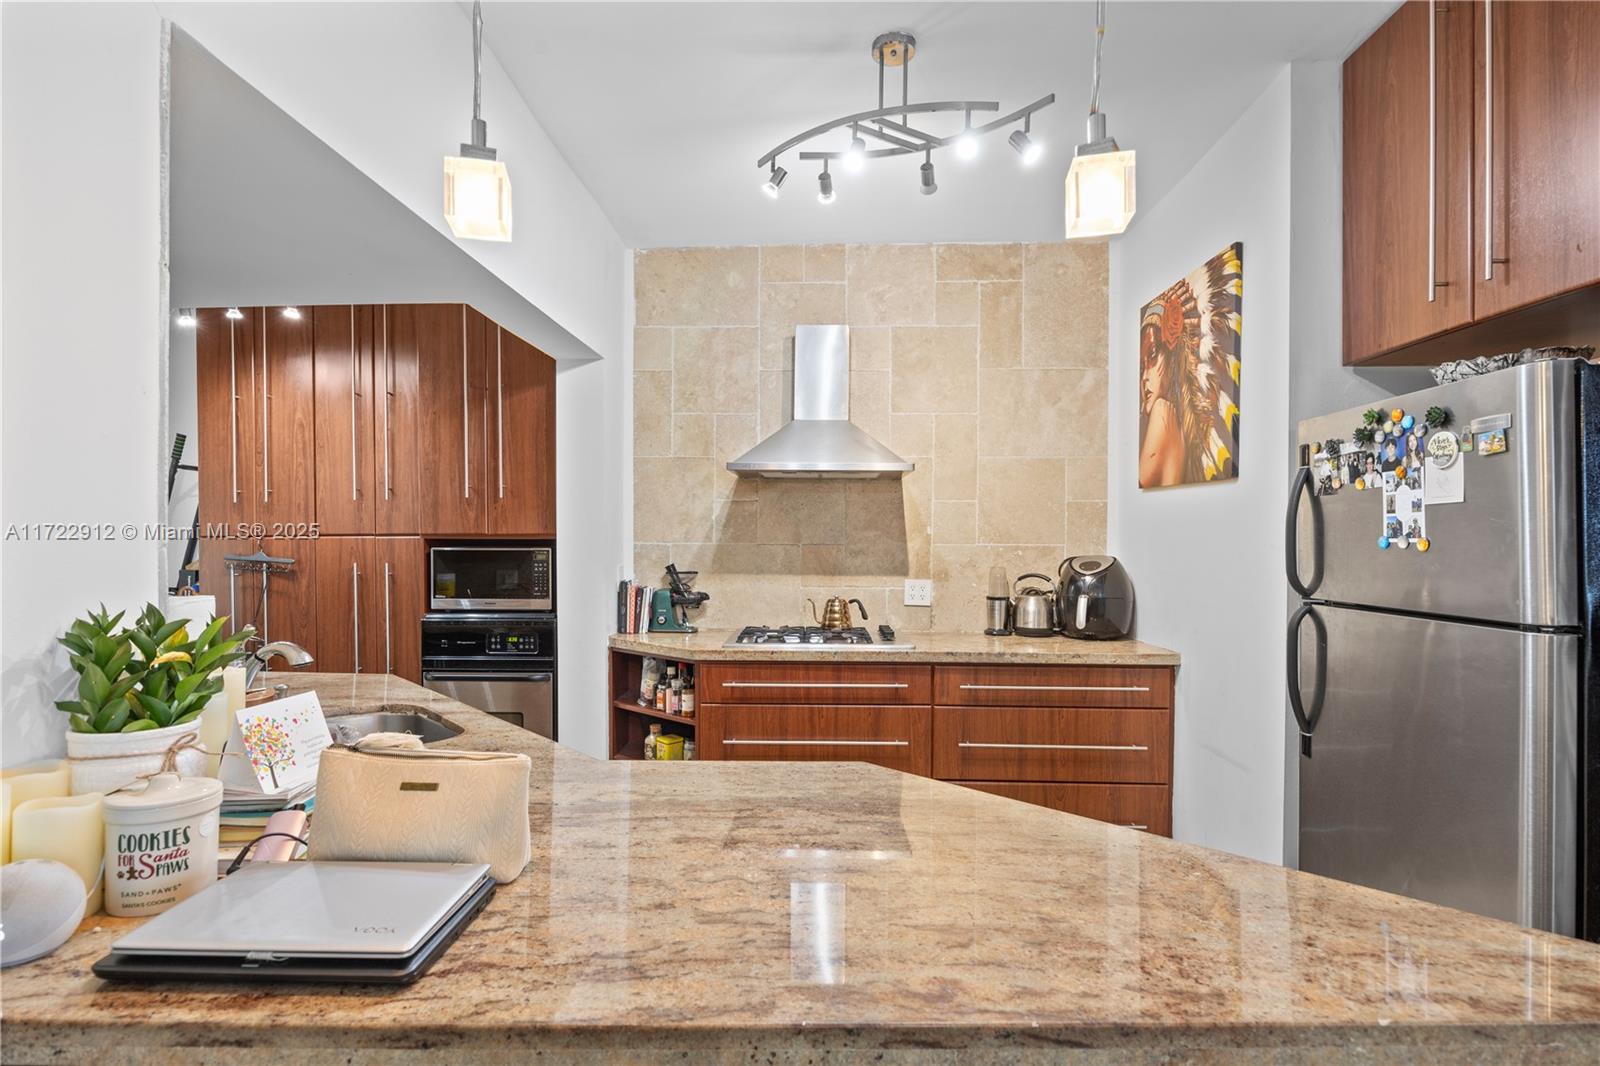
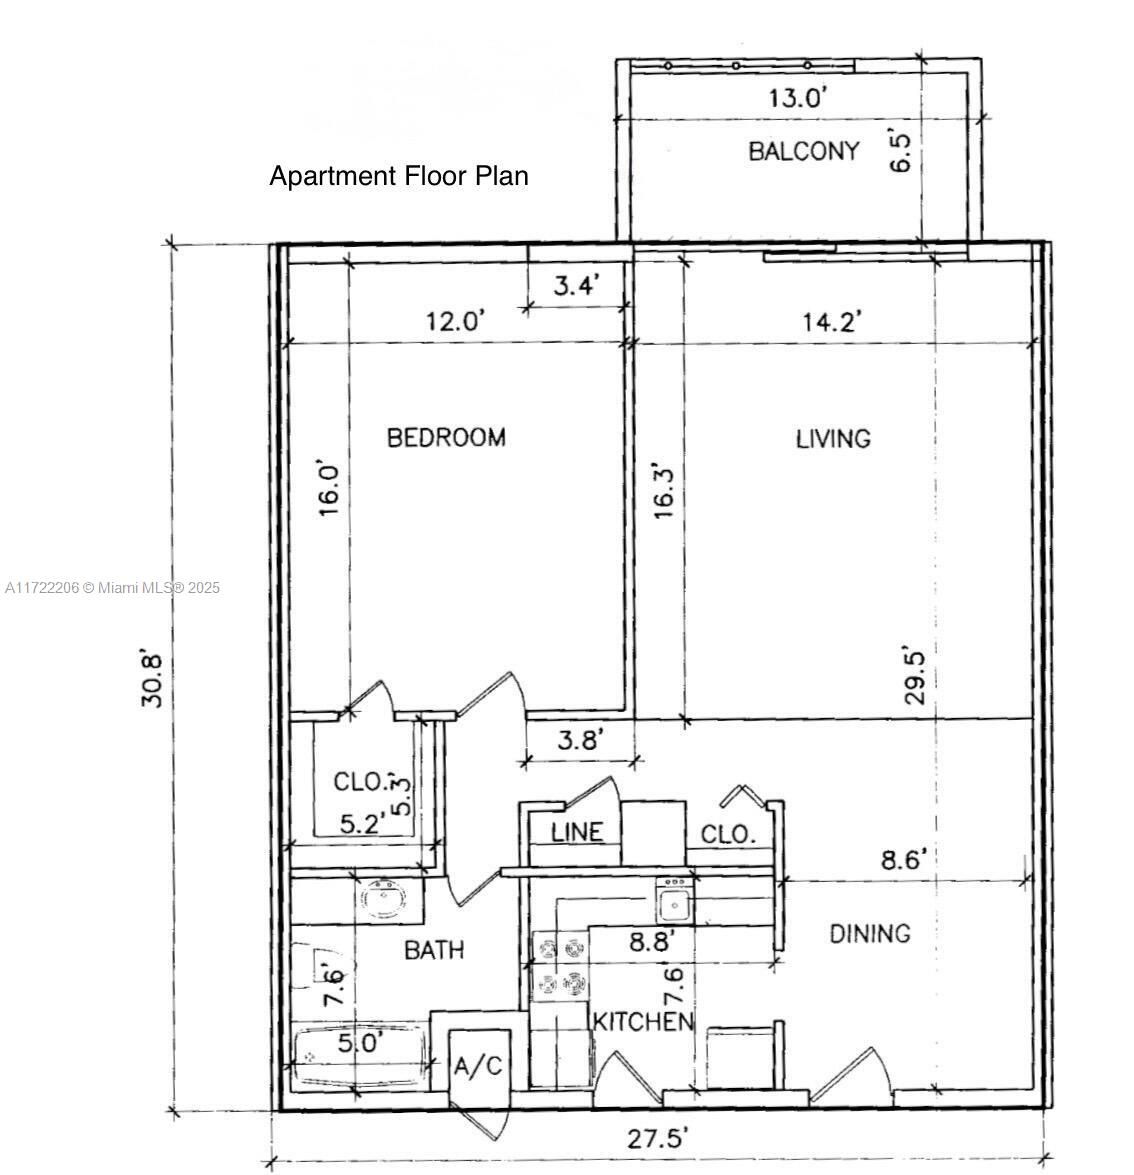
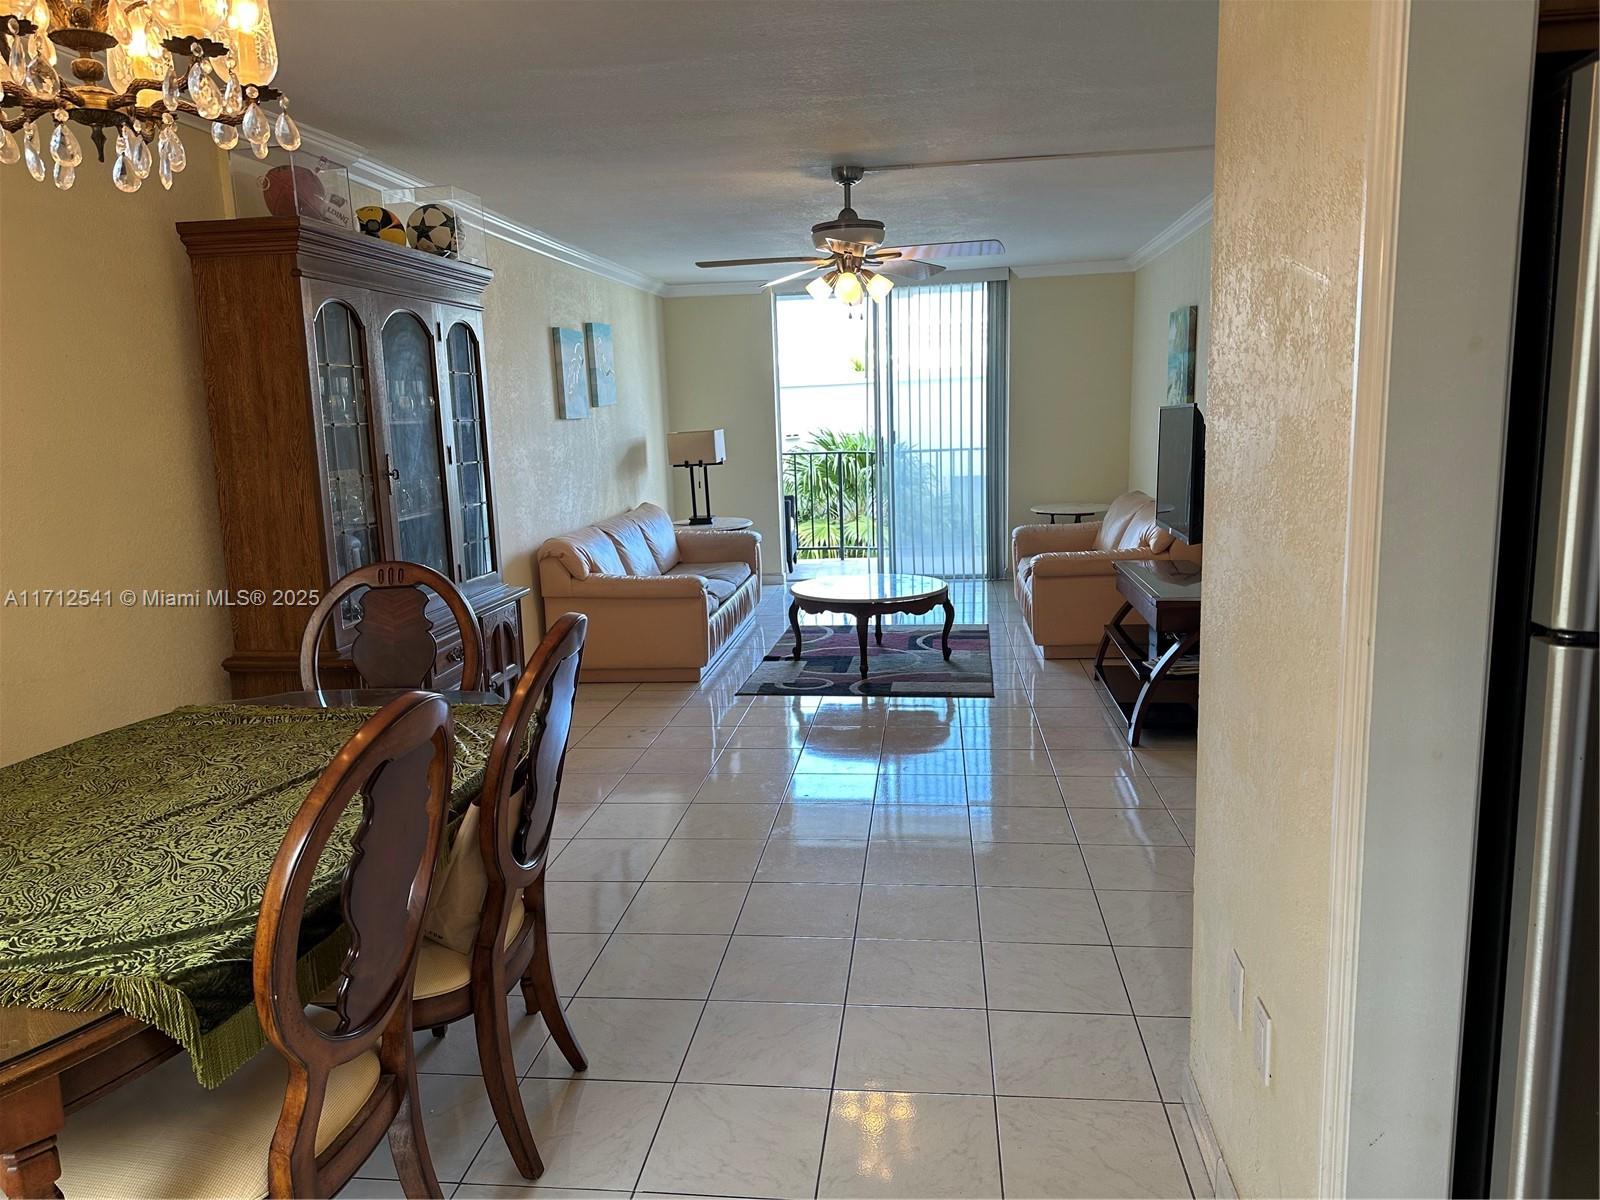
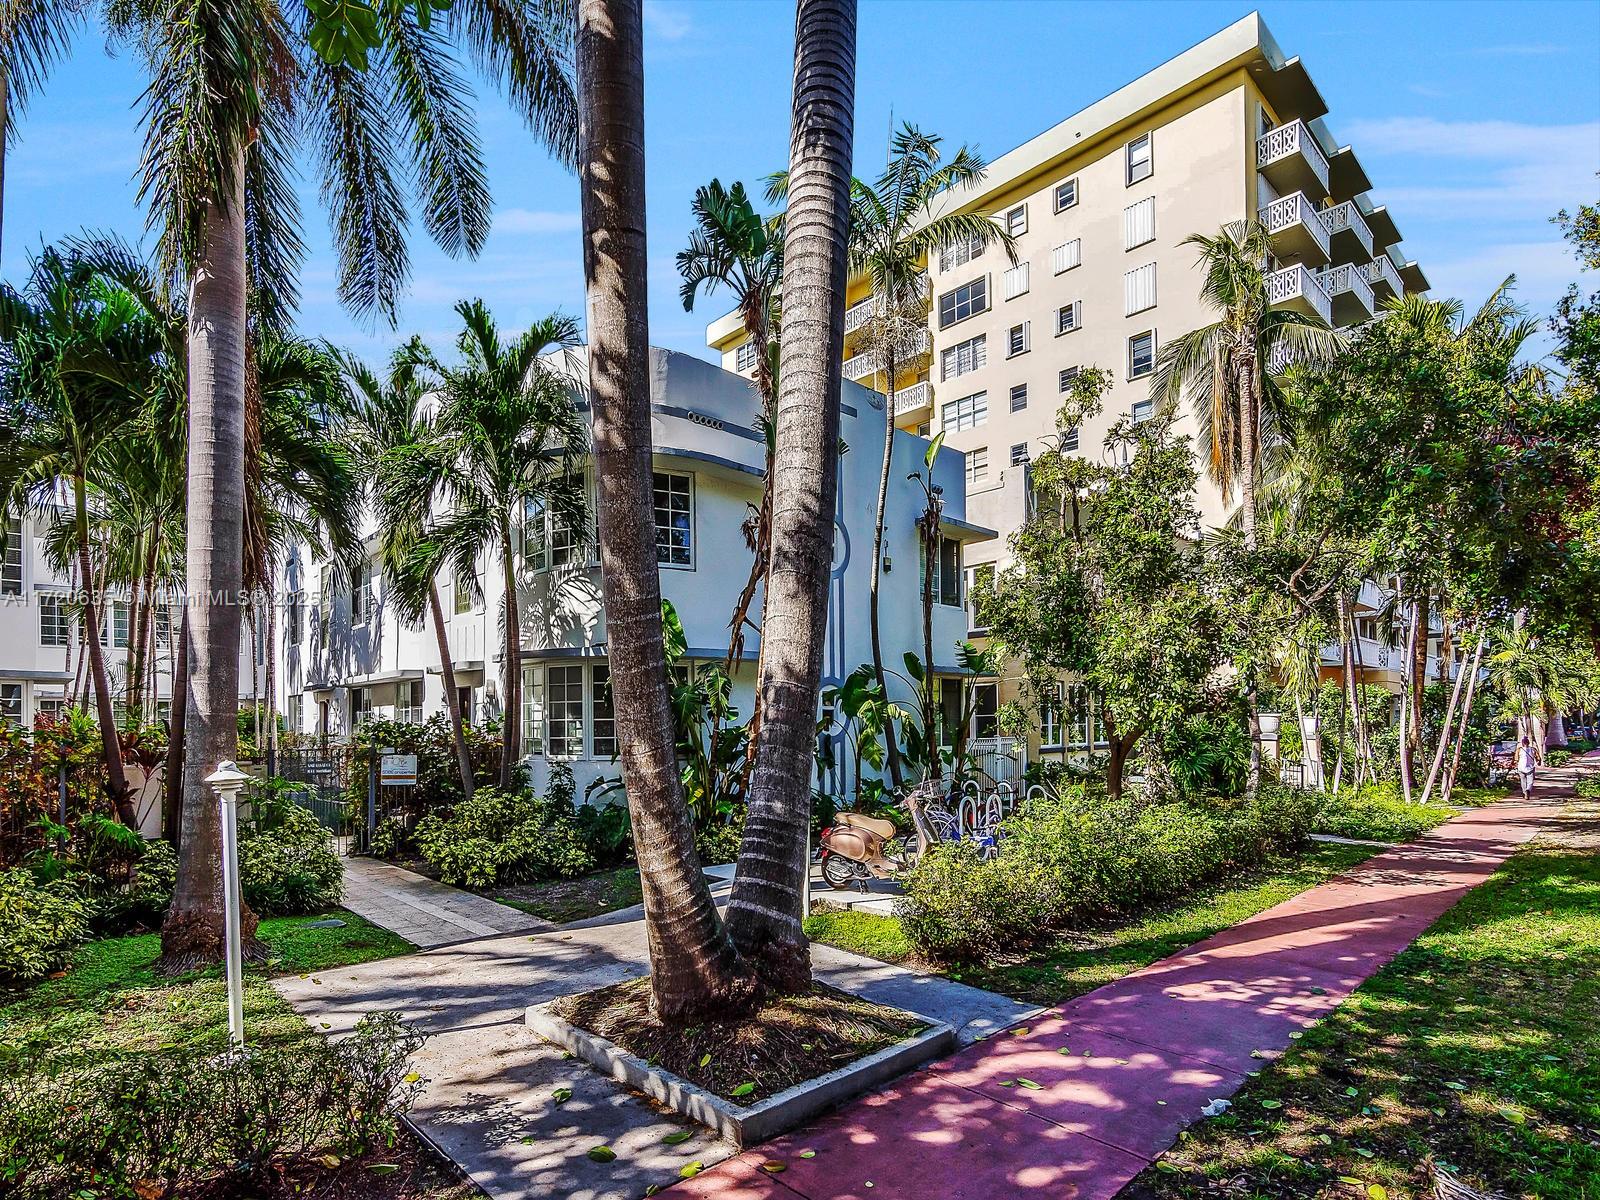
810 7th St, Miami Beach, FL 33139
$-590
Cash flow
-12.8%
Cash-on-Cash Return
3.3%
Cap rate
0.9%
Rent to Value Ratio

Active
$225,000
1
bds
|
1
ba
|
478
sqft
|
built
1938
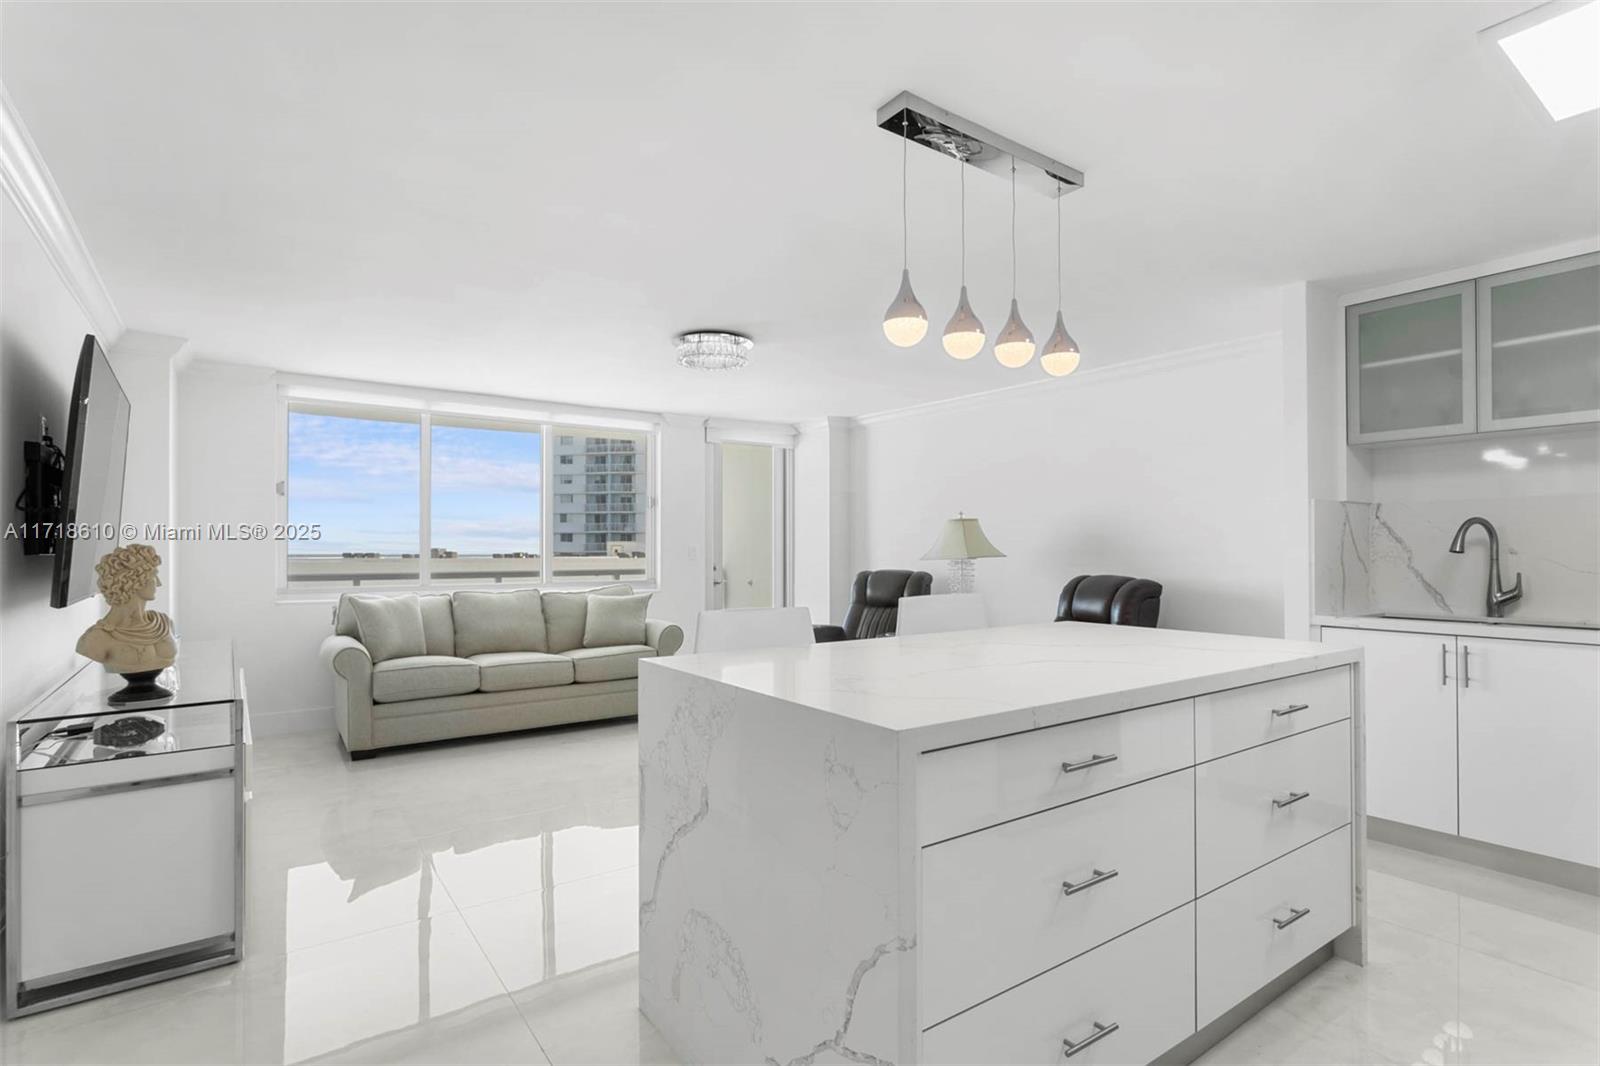
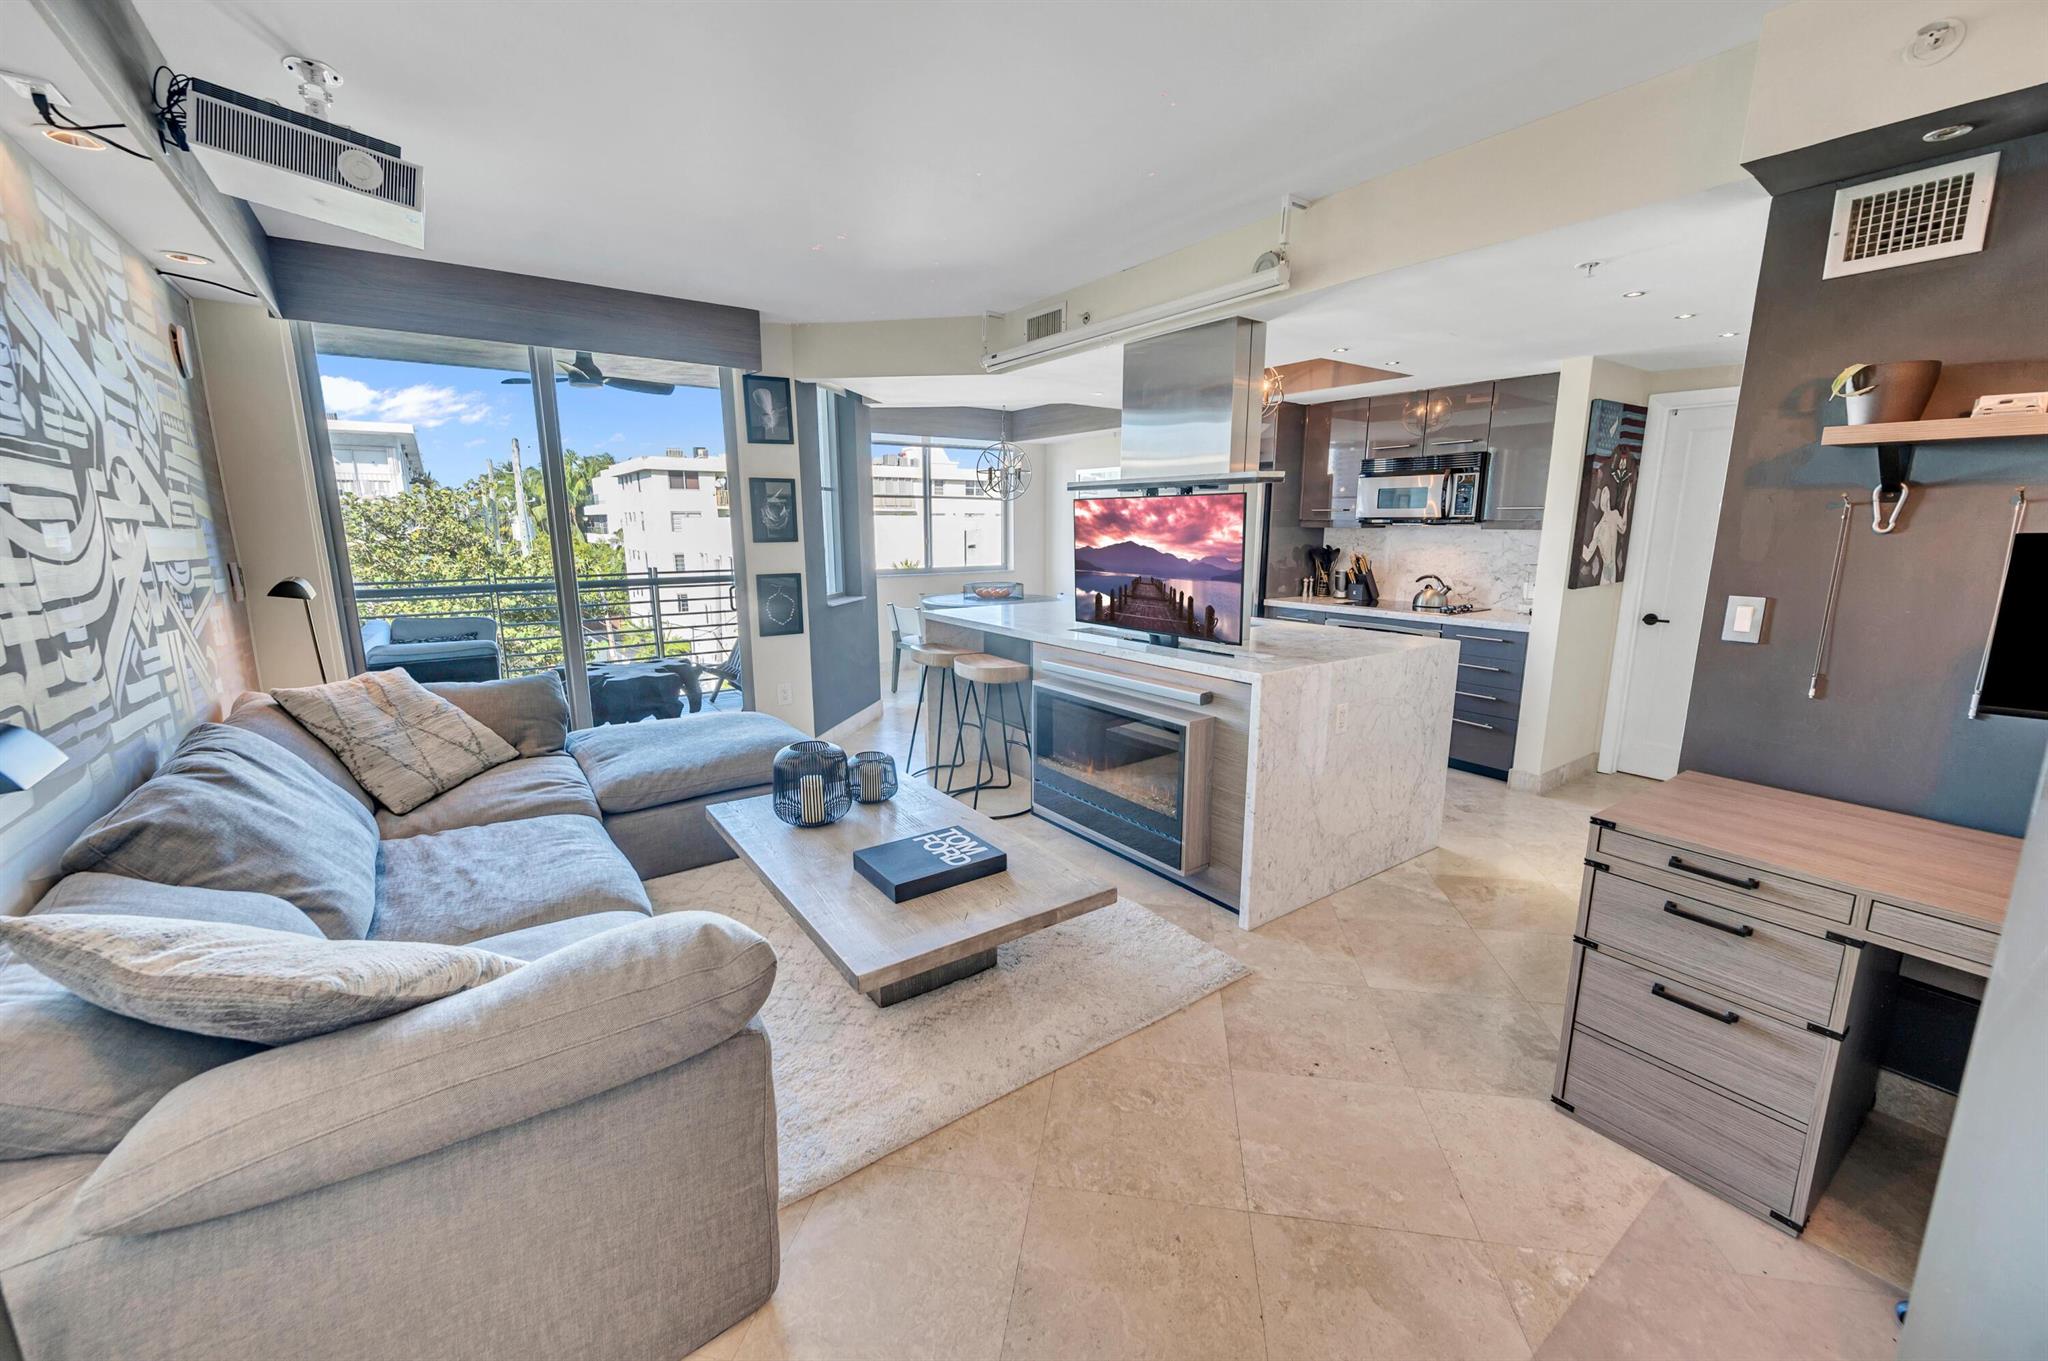
1611 Michigan Ave, Miami Beach, FL 33139
$-649
Cash flow
-15.0%
Cash-on-Cash Return
2.8%
Cap rate
0.8%
Rent to Value Ratio
1,950 out of 2,150 properties for sale in Miami Beach, FL
Limited Results Shown
Create a free account, or log in to reveal all property listings and enjoy the complete experience.

Active
$283,900
2
bds
|
2
ba
|
870
sqft
|
built
1979
1960 Marseille Dr, Miami Beach, FL 33141
$-704
Cash flow
-12.9%
Cash-on-Cash Return
3.3%
Cap rate
0.9%
Rent to Value Ratio

Active
$349,000
1
bds
|
1
ba
|
596
sqft
|
built
1936
435 21st St, Miami Beach, FL 33139
$-1,334
Cash flow
-19.9%
Cash-on-Cash Return
1.7%
Cap rate
0.8%
Rent to Value Ratio
Active
$450,000
1
bds
|
2
ba
|
876
sqft
|
built
1975
1800 Collins Ave, Miami Beach, FL 33139
$-818
Cash flow
-9.5%
Cash-on-Cash Return
4.1%
Cap rate
0.6%
Rent to Value Ratio
Active
$4,450,000
3
bds
|
4
ba
|
2,843
sqft
|
built
1946
200 E Rivo Alto Dr, Miami Beach, FL 33139
$-20,964
Cash flow
-24.6%
Cash-on-Cash Return
0.6%
Cap rate
0.2%
Rent to Value Ratio

Active
$373,000
1
bds
|
1
ba
|
942
sqft
|
built
1964
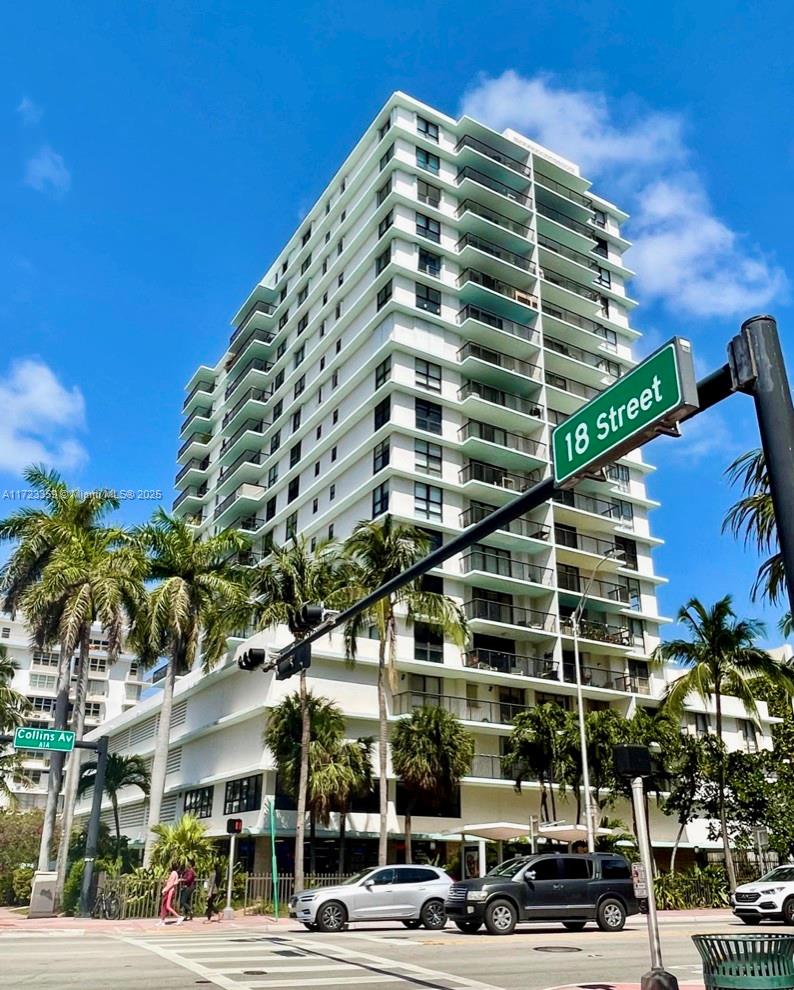
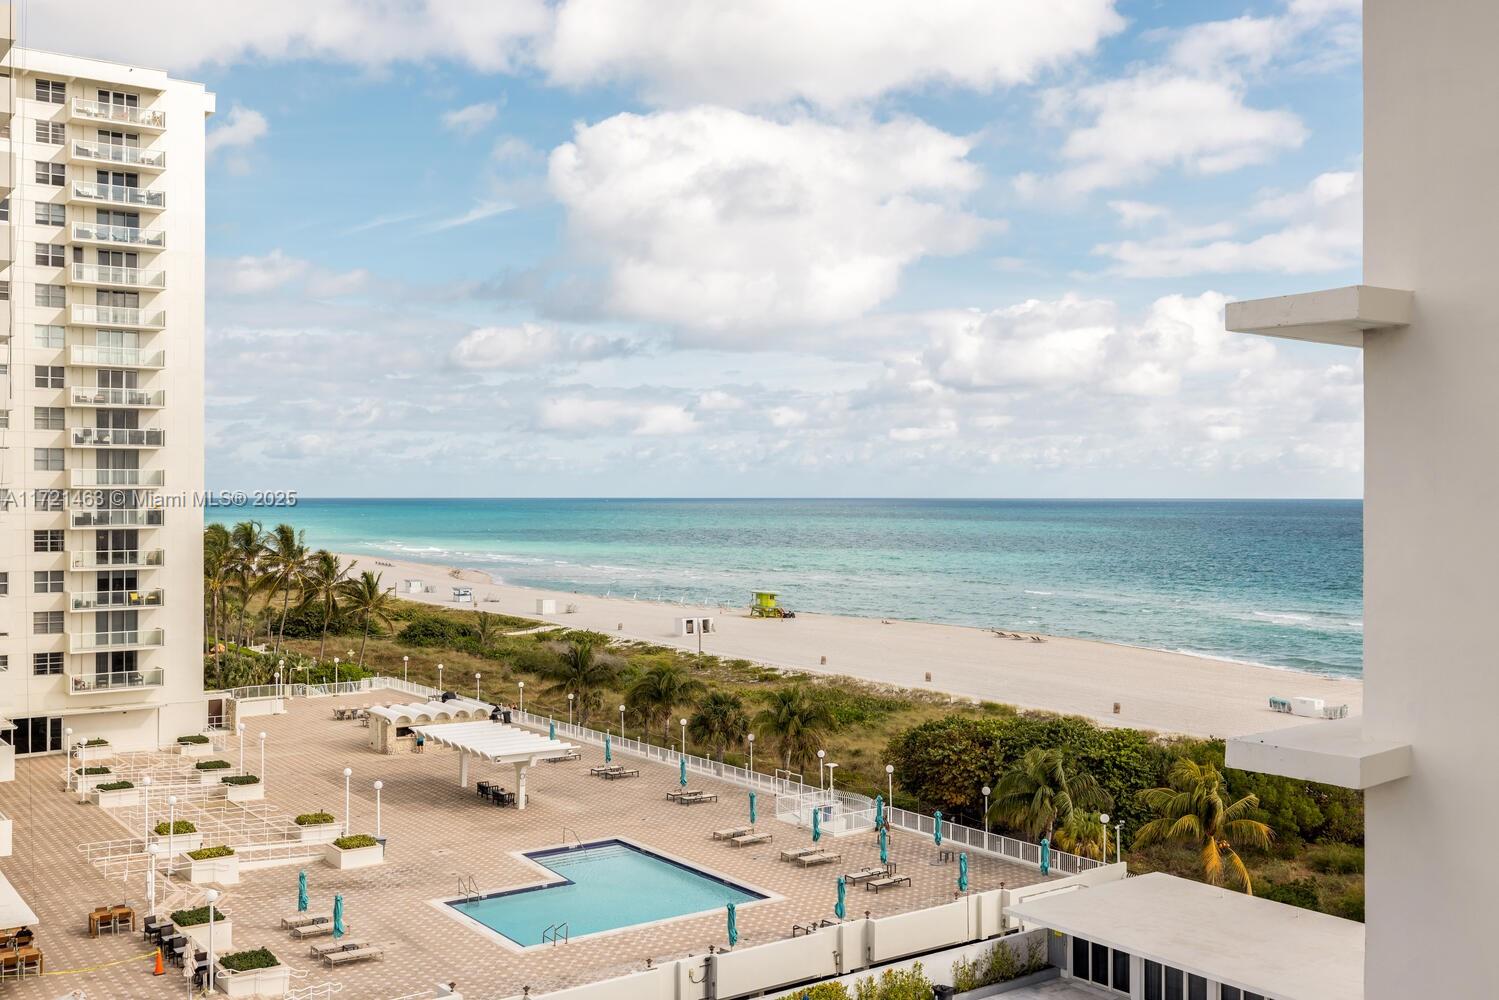
5005 Collins Ave, Miami Beach, FL 33140
$-2,239
Cash flow
-31.3%
Cash-on-Cash Return
-0.9%
Cap rate
0.7%
Rent to Value Ratio

Active
$999,999
1
bds
|
2
ba
|
833
sqft
|
built
2008
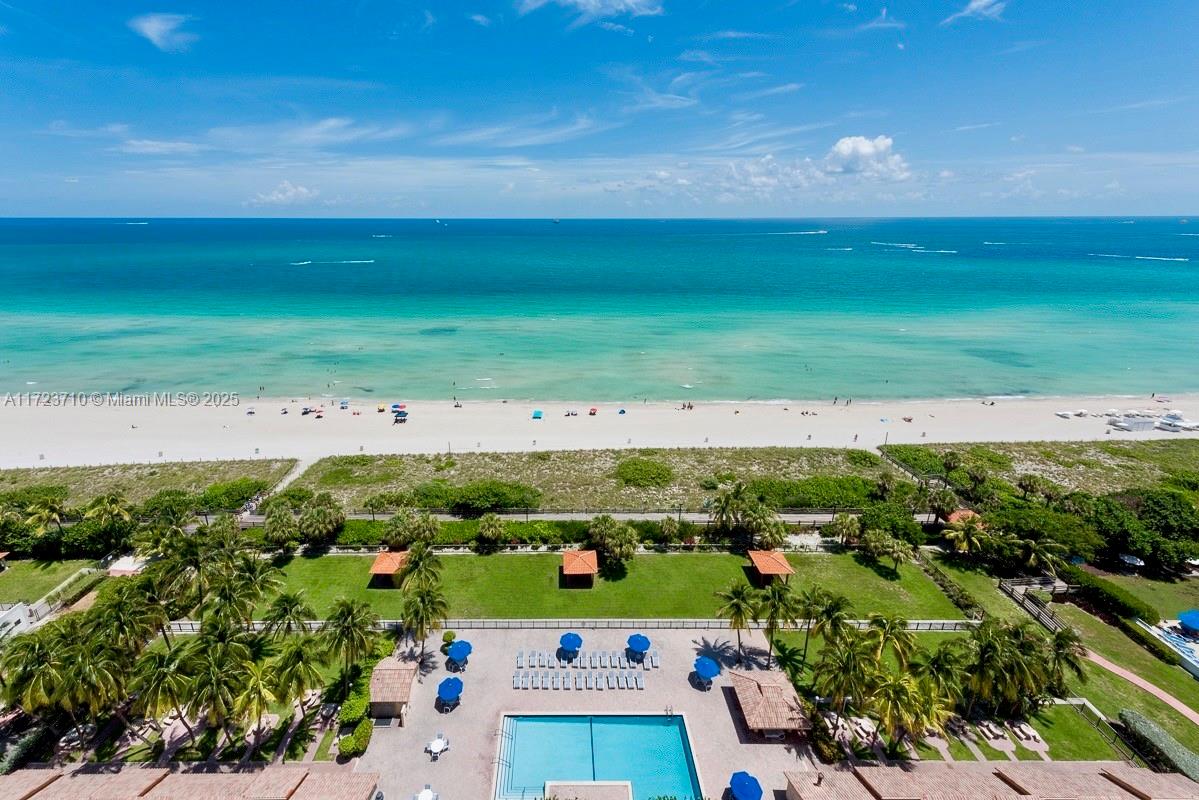
5875 Collins Ave, Miami Beach, FL 33140
$-4,816
Cash flow
-25.1%
Cash-on-Cash Return
0.5%
Cap rate
0.5%
Rent to Value Ratio
Active
$870,000
1
bds
|
2
ba
|
861
sqft
|
built
1982
2555 Collins Ave, Miami Beach, FL 33140
$-3,212
Cash flow
-19.3%
Cash-on-Cash Return
1.9%
Cap rate
0.5%
Rent to Value Ratio

Active
$389,900
1
bds
|
2
ba
|
917
sqft
|
built
1975
1800 Collins Ave, Miami Beach, FL 33139
$-1,113
Cash flow
-14.9%
Cash-on-Cash Return
2.9%
Cap rate
0.8%
Rent to Value Ratio

Active
$299,000
bds
|
1
ba
|
543
sqft
|
built
1968
1000 West Ave, Miami Beach, FL 33139
$-1,079
Cash flow
-18.8%
Cash-on-Cash Return
2.0%
Cap rate
0.8%
Rent to Value Ratio
Active
$275,000
1
bds
|
1
ba
|
454
sqft
|
built
1952
1840 James Ave, Miami Beach, FL 33139
$-717
Cash flow
-13.6%
Cash-on-Cash Return
3.2%
Cap rate
0.8%
Rent to Value Ratio
Active
$494,000
1
bds
|
2
ba
|
912
sqft
|
built
1970
7135 Collins Ave, Miami Beach, FL 33141
$-1,258
Cash flow
-13.3%
Cash-on-Cash Return
3.2%
Cap rate
0.8%
Rent to Value Ratio
Active
$2,950,000
2
bds
|
4
ba
|
1,919
sqft
|
built
2008
1445 16th St, Miami Beach, FL 33139
$-12,459
Cash flow
-22.0%
Cash-on-Cash Return
1.2%
Cap rate
0.4%
Rent to Value Ratio
Active
$319,900
1
bds
|
1
ba
|
837
sqft
|
built
1965
1200 West Ave, Miami Beach, FL 33139
$-1,294
Cash flow
-21.1%
Cash-on-Cash Return
1.4%
Cap rate
0.9%
Rent to Value Ratio

Active
$3,349,000
2
bds
|
3
ba
|
1,245
sqft
|
built
2021
5775 Collins Ave, Miami Beach, FL 33140
$-18,827
Cash flow
-29.3%
Cash-on-Cash Return
-0.5%
Cap rate
0.3%
Rent to Value Ratio
Pending
$2,050,000
4
bds
|
3
ba
|
2,233
sqft
|
built
1951
6140 Pine Tree Dr, Miami Beach, FL 33140
$-8,433
Cash flow
-21.5%
Cash-on-Cash Return
1.3%
Cap rate
0.4%
Rent to Value Ratio
Active
$240,000
1
bds
|
1
ba
|
450
sqft
|
built
1940
810 7th St, Miami Beach, FL 33139
$-590
Cash flow
-12.8%
Cash-on-Cash Return
3.3%
Cap rate
0.9%
Rent to Value Ratio

Active
$350,000
1
bds
|
1
ba
|
706
sqft
|
built
1945
1000 Meridian Ave, Miami Beach, FL 33139
$-1,090
Cash flow
-16.2%
Cash-on-Cash Return
2.5%
Cap rate
0.7%
Rent to Value Ratio
Active
$1,050,000
2
bds
|
2
ba
|
966
sqft
|
built
2005
2001 Meridian Ave, Miami Beach, FL 33139
$-3,741
Cash flow
-18.6%
Cash-on-Cash Return
2.0%
Cap rate
0.5%
Rent to Value Ratio
Active
$569,000
2
bds
|
2
ba
|
1,035
sqft
|
built
1950
827 Jefferson Ave, Miami Beach, FL 33139
$-678
Cash flow
-6.2%
Cash-on-Cash Return
4.9%
Cap rate
0.6%
Rent to Value Ratio
Active
$300,000
1
bds
|
1
ba
|
580
sqft
|
built
1926
1502 Jefferson Ave, Miami Beach, FL 33139
$-937
Cash flow
-16.3%
Cash-on-Cash Return
2.5%
Cap rate
0.7%
Rent to Value Ratio
Active
$1,899,000
3
bds
|
3
ba
|
1,860
sqft
|
built
1995
5025 Collins Ave, Miami Beach, FL 33140
$-6,772
Cash flow
-18.6%
Cash-on-Cash Return
2.0%
Cap rate
0.5%
Rent to Value Ratio
Active
$1,300,000
3
bds
|
4
ba
|
1,840
sqft
|
built
1981
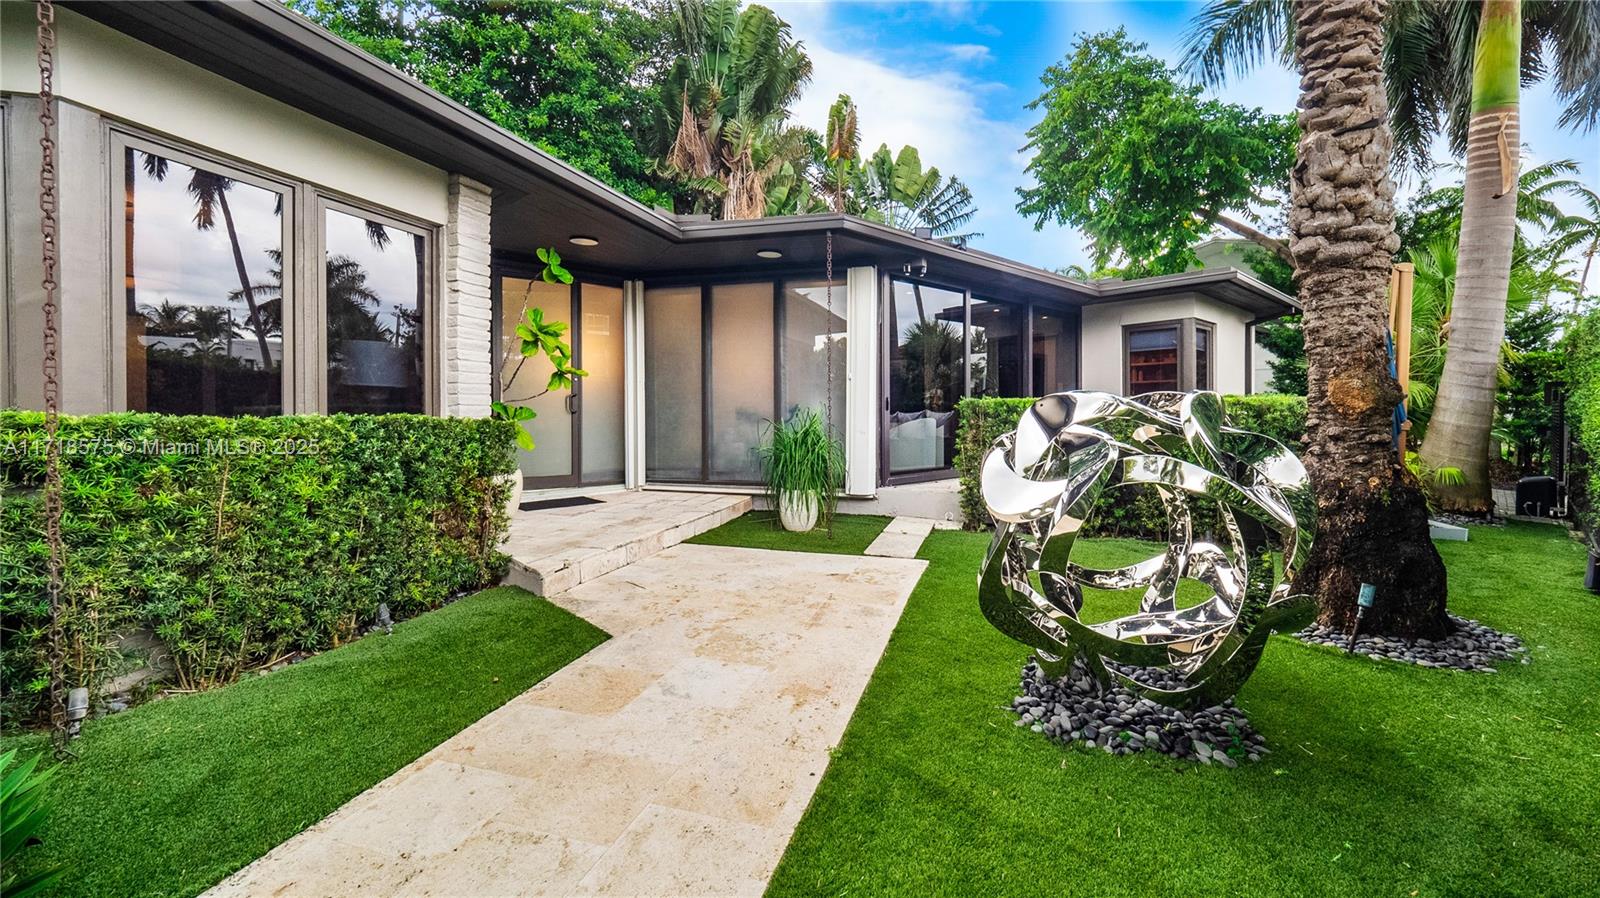
801 N Venetian Dr, Miami Beach, FL 33139
$-2,866
Cash flow
-11.5%
Cash-on-Cash Return
3.6%
Cap rate
0.5%
Rent to Value Ratio
Active
$750,000
2
bds
|
2
ba
|
1,088
sqft
|
built
1980
1621 Collins Ave, Miami Beach, FL 33139
$-2,891
Cash flow
-20.1%
Cash-on-Cash Return
1.7%
Cap rate
0.7%
Rent to Value Ratio
Active
$265,900
1
bds
|
1
ba
|
665
sqft
|
built
1966
932 Euclid Ave, Miami Beach, FL 33139
$-737
Cash flow
-14.5%
Cash-on-Cash Return
3.0%
Cap rate
0.9%
Rent to Value Ratio
Active
$332,000
1
bds
|
1
ba
|
720
sqft
|
built
1972
720 Collins Ave, Miami Beach, FL 33139
$-820
Cash flow
-12.9%
Cash-on-Cash Return
3.3%
Cap rate
0.8%
Rent to Value Ratio
Active
$815,000
1
bds
|
2
ba
|
826
sqft
|
built
2004
110 Washington Ave, Miami Beach, FL 33139
$-2,722
Cash flow
-17.4%
Cash-on-Cash Return
2.3%
Cap rate
0.6%
Rent to Value Ratio
Active
$990,000
2
bds
|
2
ba
|
1,460
sqft
|
built
1968
5601 Collins Ave, Miami Beach, FL 33140
$-4,443
Cash flow
-23.4%
Cash-on-Cash Return
0.9%
Cap rate
0.5%
Rent to Value Ratio

Active
$750,000
1
bds
|
2
ba
|
830
sqft
|
built
1966
5445 Collins Ave, Miami Beach, FL 33140
$-4,217
Cash flow
-29.3%
Cash-on-Cash Return
-0.5%
Cap rate
0.5%
Rent to Value Ratio
Active
$395,000
2
bds
|
2
ba
|
1,150
sqft
|
built
1947
1145 Meridian Ave, Miami Beach, FL 33139
$-1,575
Cash flow
-20.8%
Cash-on-Cash Return
1.5%
Cap rate
0.9%
Rent to Value Ratio
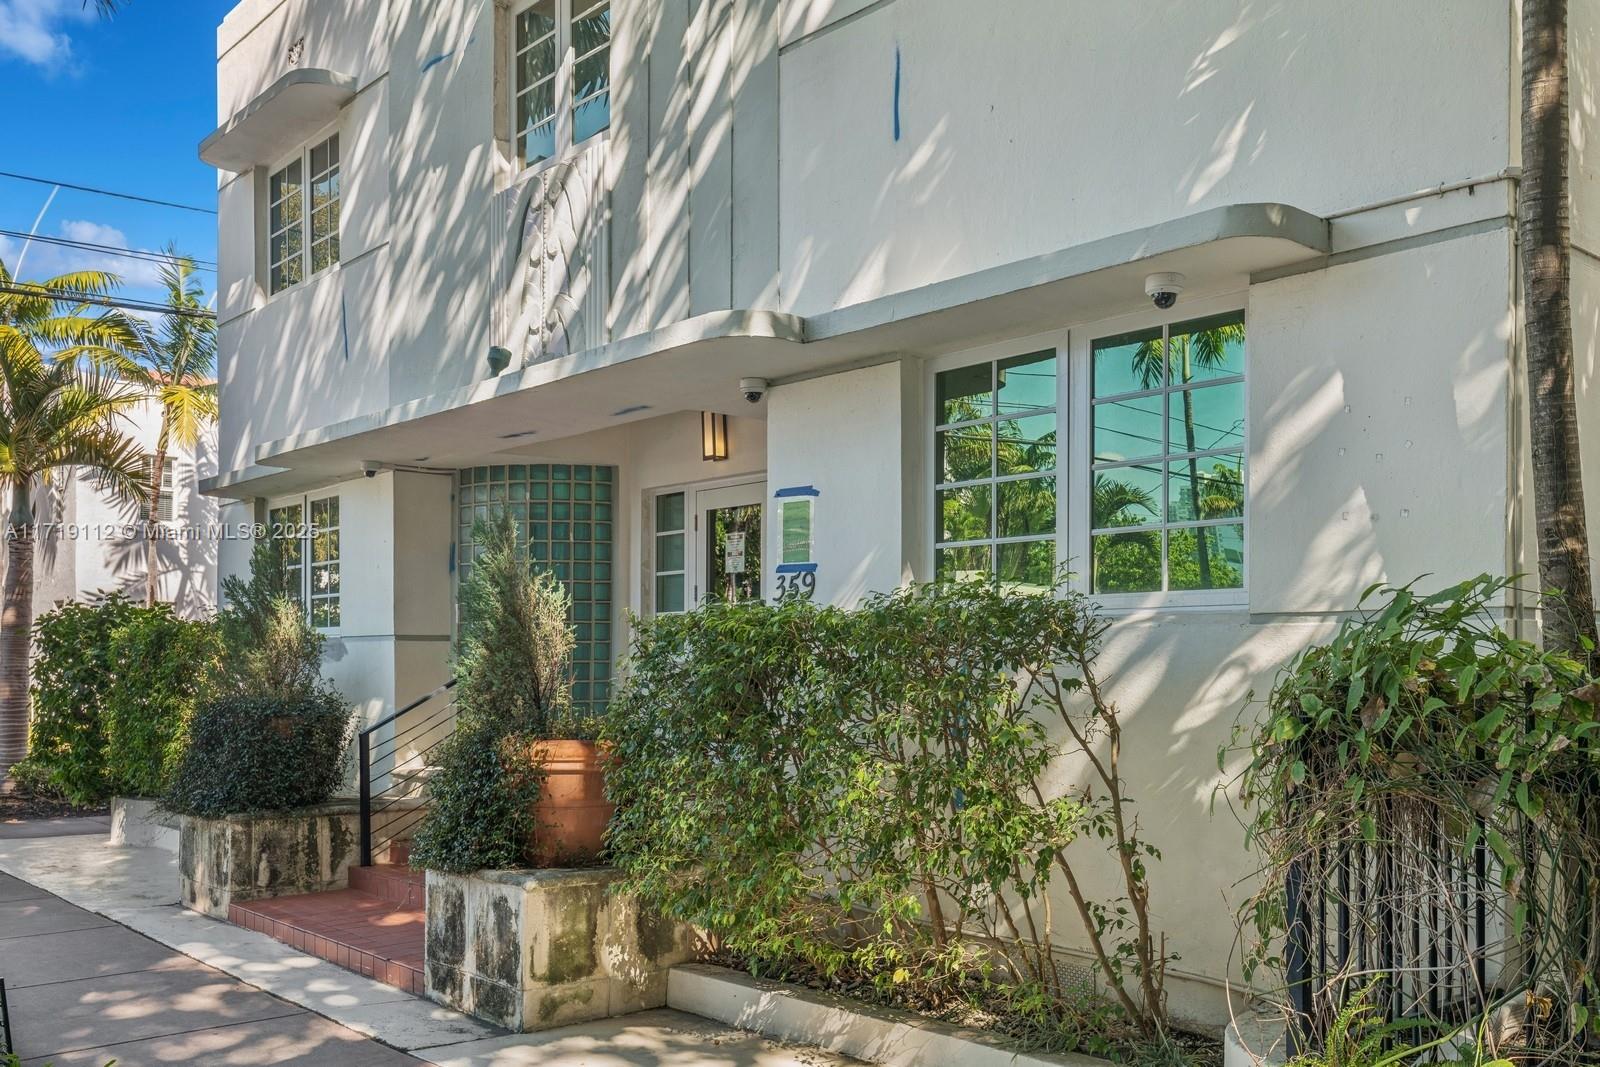
Active
$285,000
bds
|
1
ba
|
450
sqft
|
built
1937
359 Meridian Ave, Miami Beach, FL 33139
$-1,013
Cash flow
-18.5%
Cash-on-Cash Return
2.0%
Cap rate
0.8%
Rent to Value Ratio
Active
$225,000
1
bds
|
1
ba
|
478
sqft
|
built
1938
1611 Michigan Ave, Miami Beach, FL 33139
$-649
Cash flow
-15.0%
Cash-on-Cash Return
2.8%
Cap rate
0.8%
Rent to Value Ratio
Active
$400,000
2
bds
|
2
ba
|
930
sqft
|
built
1925
1027 Pennsylvania Ave, Miami Beach, FL 33139
$-1,205
Cash flow
-15.7%
Cash-on-Cash Return
2.7%
Cap rate
0.8%
Rent to Value Ratio
Active
$3,995,000
5
bds
|
5
ba
|
2,924
sqft
|
built
1946
4340 Pine Tree Dr, Miami Beach, FL 33140
$-19,741
Cash flow
-25.8%
Cash-on-Cash Return
0.4%
Cap rate
0.2%
Rent to Value Ratio
Active
$1,890,000
2
bds
|
2
ba
|
1,490
sqft
|
built
2000
4779 Collins Ave, Miami Beach, FL 33140
$-7,606
Cash flow
-21.0%
Cash-on-Cash Return
1.5%
Cap rate
0.5%
Rent to Value Ratio

Active
$689,000
1
bds
|
2
ba
|
962
sqft
|
built
1968
1000 West Ave, Miami Beach, FL 33139
$-2,068
Cash flow
-15.7%
Cash-on-Cash Return
2.7%
Cap rate
0.6%
Rent to Value Ratio
Active
$320,000
1
bds
|
1
ba
|
737
sqft
|
built
1945
1000 Meridian Ave, Miami Beach, FL 33139
$-857
Cash flow
-14.0%
Cash-on-Cash Return
3.1%
Cap rate
0.8%
Rent to Value Ratio
Active
$975,000
3
bds
|
2
ba
|
1,190
sqft
|
built
1965
100 Lincoln Rd, Miami Beach, FL 33139
$-963
Cash flow
-5.2%
Cash-on-Cash Return
5.1%
Cap rate
0.7%
Rent to Value Ratio
Active
$229,000
1
bds
|
1
ba
|
401
sqft
|
built
1940
727 Jefferson Ave, Miami Beach, FL 33139
$-769
Cash flow
-17.5%
Cash-on-Cash Return
2.3%
Cap rate
0.8%
Rent to Value Ratio
Active
$1,750,000
2
bds
|
2
ba
|
1,147
sqft
|
built
1997
650 West Ave, Miami Beach, FL 33139
$-6,734
Cash flow
-20.1%
Cash-on-Cash Return
1.7%
Cap rate
0.4%
Rent to Value Ratio

Active
$839,000
1
bds
|
2
ba
|
894
sqft
|
built
1941
1250 Ocean Dr, Miami Beach, FL 33139
$-3,462
Cash flow
-21.5%
Cash-on-Cash Return
1.3%
Cap rate
0.6%
Rent to Value Ratio