Miami Beach, FL Investment Properties for Sale
Browse homes for sale and investment properties in Miami Beach, FL. Refine your search by price, property type, or more.
Best cash flowing properties in Miami Beach, FL
Active
$275,000
bds
|
1
ba
|
0
sqft
|
built
1936
721 14th Pl, Miami Beach, FL 33139
$-518
Cash flow
-9.8%
Cash-on-Cash Return
4.0%
Cap rate
0.7%
Rent to Value Ratio
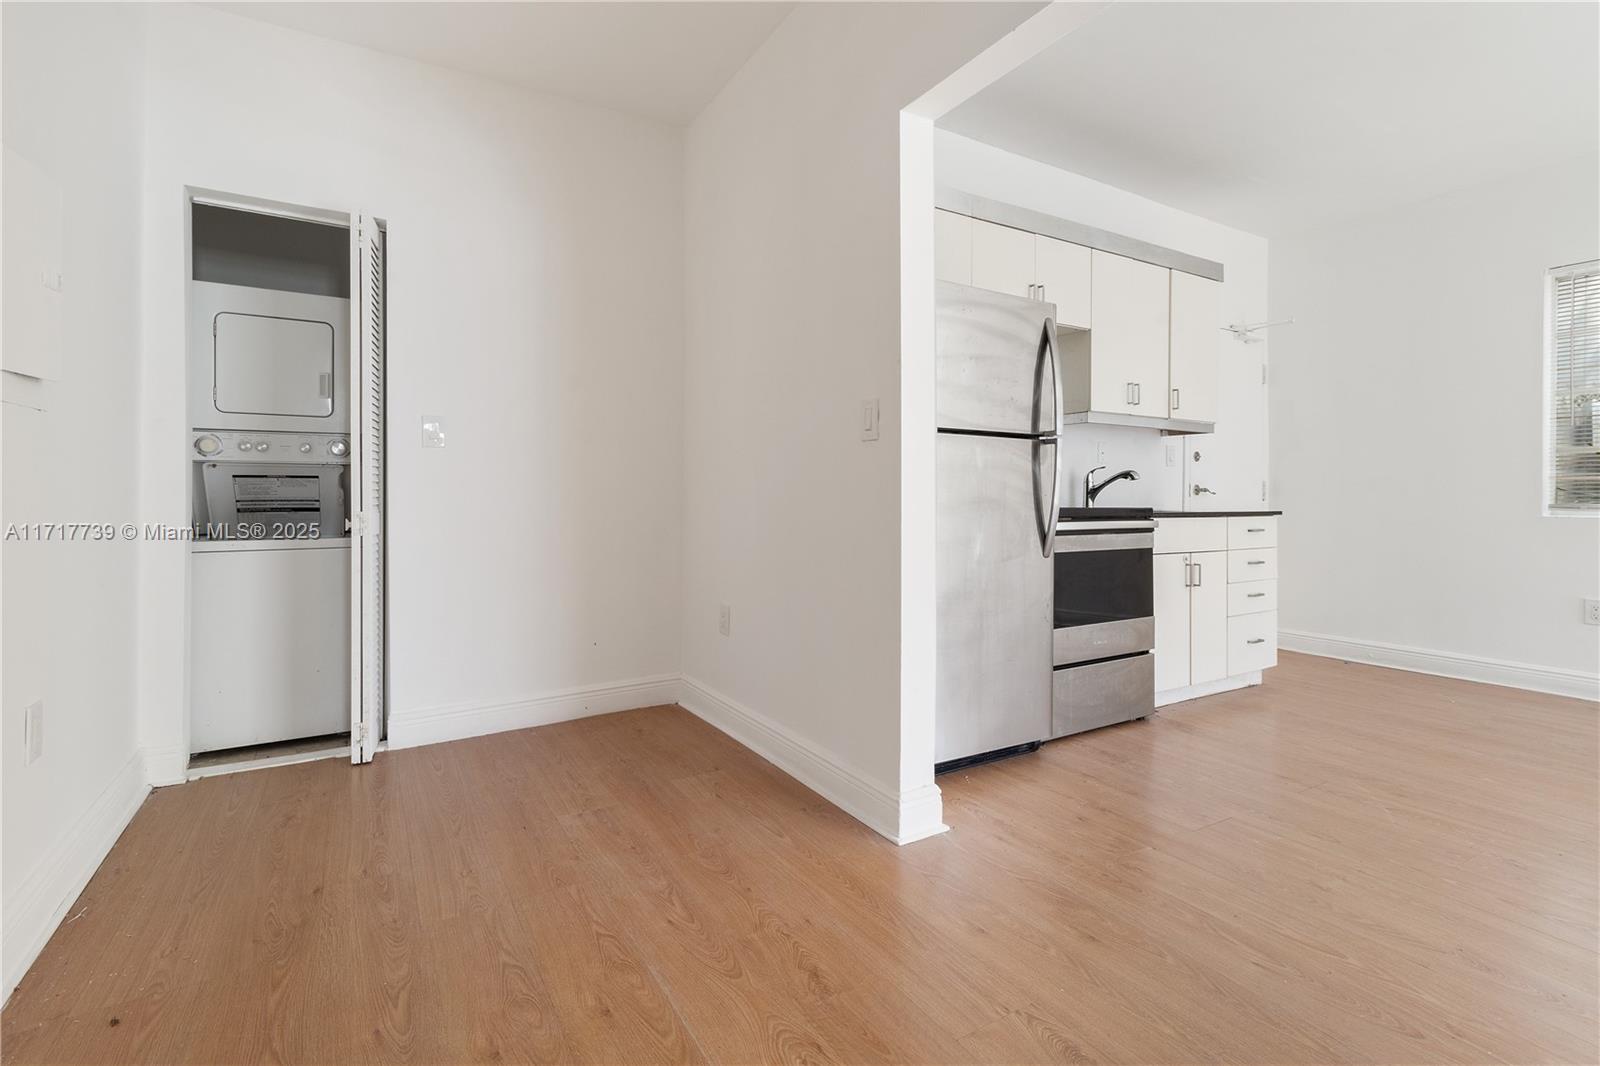
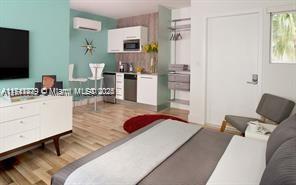
Active
$298,000
bds
|
1
ba
|
331
sqft
|
built
2019
6080 Collins Ave, Miami Beach, FL 33140
$-796
Cash flow
-13.9%
Cash-on-Cash Return
3.1%
Cap rate
0.9%
Rent to Value Ratio
1,961 out of 2,163 properties for sale in Miami Beach, FL
Limited Results Shown
Create a free account, or log in to reveal all property listings and enjoy the complete experience.
Active
$320,000
1
bds
|
1
ba
|
737
sqft
|
built
1945
1000 Meridian Ave, Miami Beach, FL 33139
$-857
Cash flow
-14.0%
Cash-on-Cash Return
3.1%
Cap rate
0.8%
Rent to Value Ratio
Active
$400,000
2
bds
|
2
ba
|
930
sqft
|
built
1925
1027 Pennsylvania Ave, Miami Beach, FL 33139
$-1,205
Cash flow
-15.7%
Cash-on-Cash Return
2.7%
Cap rate
0.8%
Rent to Value Ratio
Active
$3,995,000
5
bds
|
5
ba
|
2,924
sqft
|
built
1946
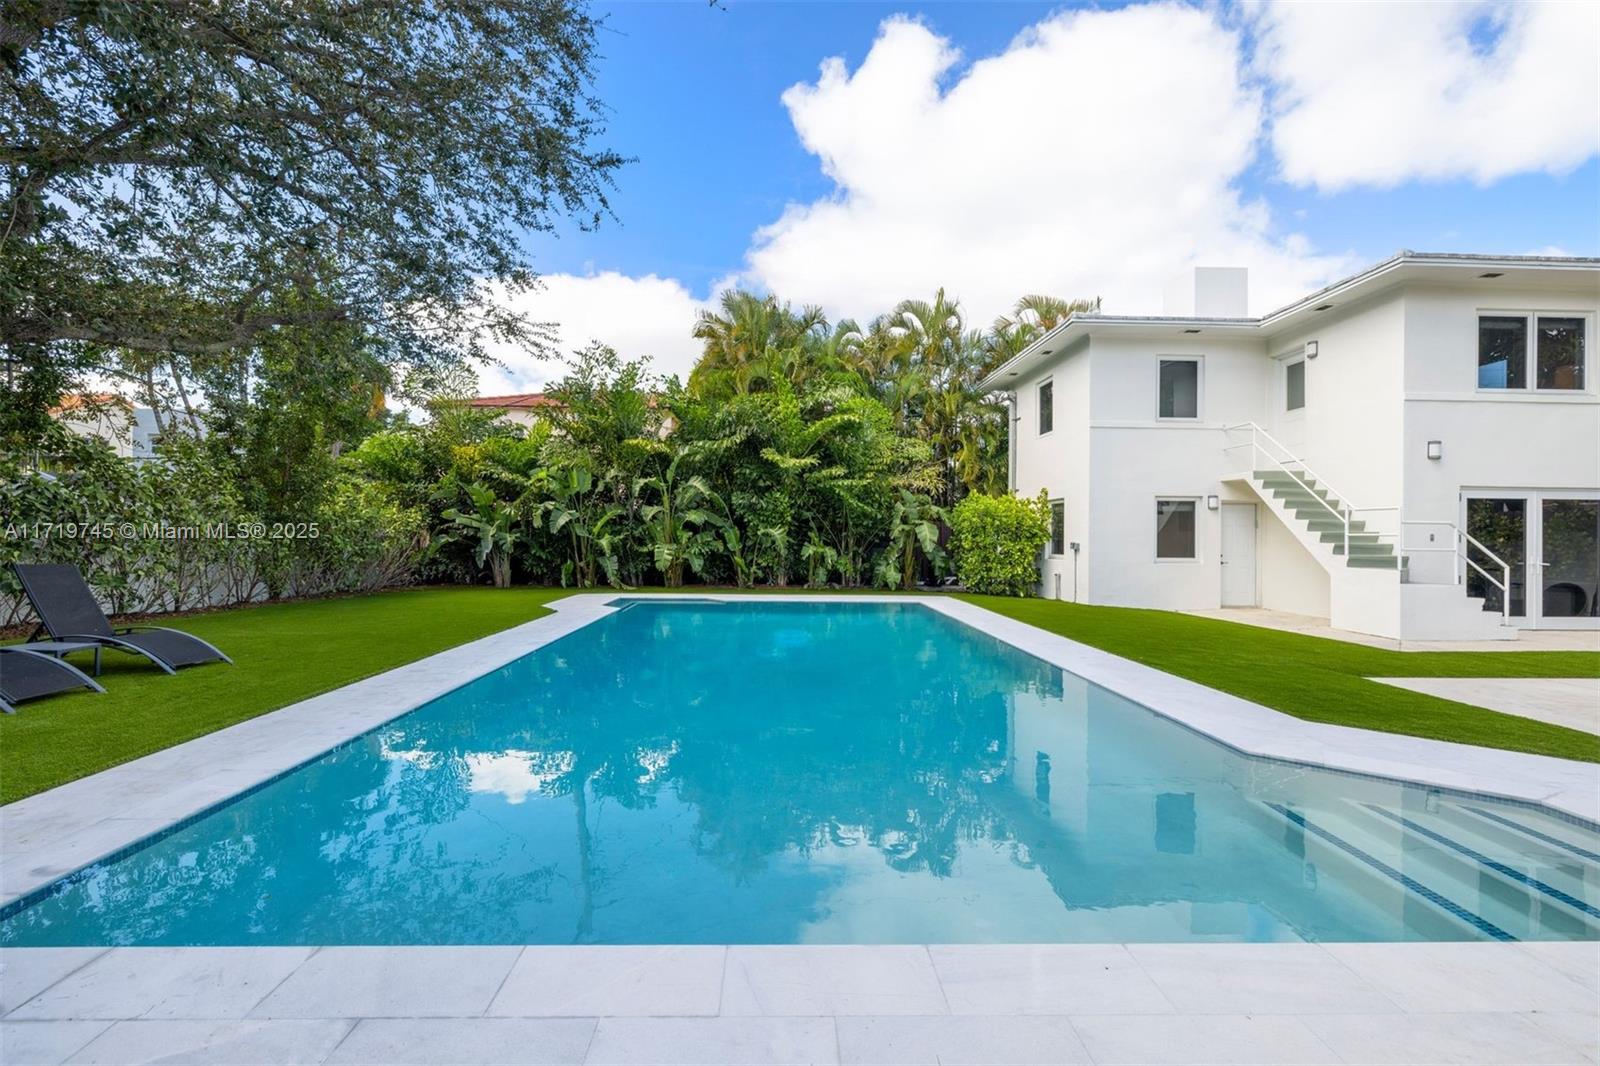
4340 Pine Tree Dr, Miami Beach, FL 33140
$-19,741
Cash flow
-25.8%
Cash-on-Cash Return
0.4%
Cap rate
0.2%
Rent to Value Ratio
Active
$1,890,000
2
bds
|
2
ba
|
1,490
sqft
|
built
2000
4779 Collins Ave, Miami Beach, FL 33140
$-7,606
Cash flow
-21.0%
Cash-on-Cash Return
1.5%
Cap rate
0.5%
Rent to Value Ratio

Active
$689,000
1
bds
|
2
ba
|
962
sqft
|
built
1968
1000 West Ave, Miami Beach, FL 33139
$-2,068
Cash flow
-15.7%
Cash-on-Cash Return
2.7%
Cap rate
0.6%
Rent to Value Ratio
Active
$235,000
1
bds
|
1
ba
|
401
sqft
|
built
1940
727 Jefferson Ave, Miami Beach, FL 33139
$-801
Cash flow
-17.8%
Cash-on-Cash Return
2.2%
Cap rate
0.8%
Rent to Value Ratio
Active
$1,750,000
2
bds
|
2
ba
|
1,147
sqft
|
built
1997
650 West Ave, Miami Beach, FL 33139
$-6,734
Cash flow
-20.1%
Cash-on-Cash Return
1.7%
Cap rate
0.4%
Rent to Value Ratio

Active
$839,000
1
bds
|
2
ba
|
894
sqft
|
built
1941
1250 Ocean Dr, Miami Beach, FL 33139
$-3,462
Cash flow
-21.5%
Cash-on-Cash Return
1.3%
Cap rate
0.6%
Rent to Value Ratio
Active
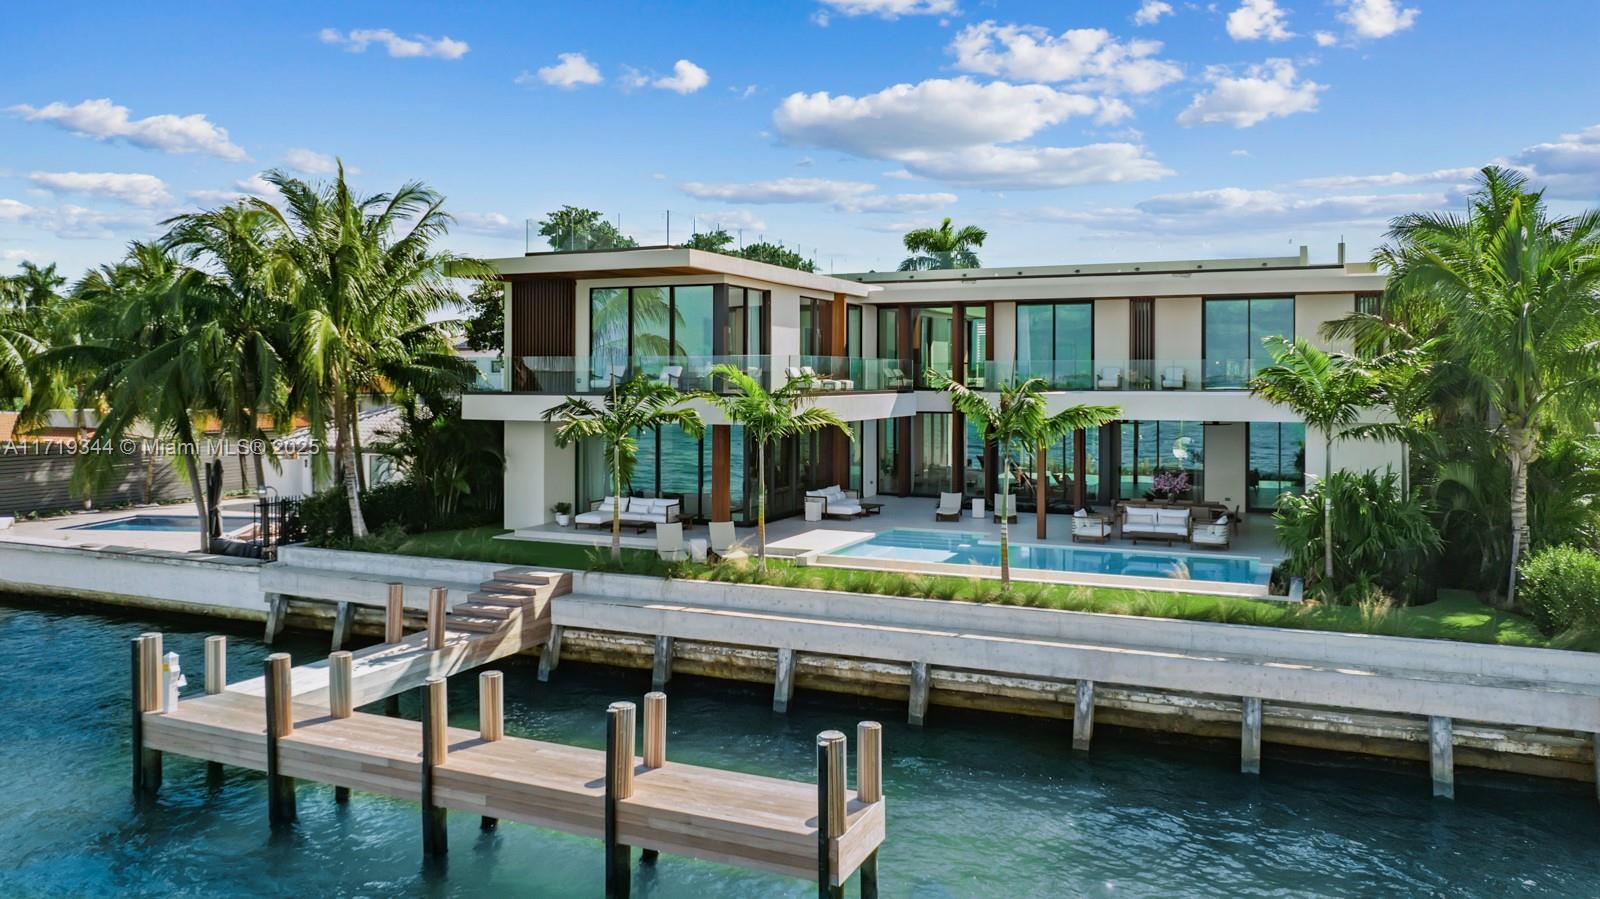
$38,000,000
7
bds
|
8
ba
|
6,701
sqft
|
built
2022
1061 N Venetian Dr, Miami Beach, FL 33139
$-207,618
Cash flow
-28.5%
Cash-on-Cash Return
-0.3%
Cap rate
0.0%
Rent to Value Ratio
Active
$1,500,000
3
bds
|
2
ba
|
1,372
sqft
|
built
1997
650 West Ave, Miami Beach, FL 33139
$-5,116
Cash flow
-17.8%
Cash-on-Cash Return
2.2%
Cap rate
0.6%
Rent to Value Ratio
Active
$275,000
bds
|
1
ba
|
0
sqft
|
built
1936
721 14th Pl, Miami Beach, FL 33139
$-518
Cash flow
-9.8%
Cash-on-Cash Return
4.0%
Cap rate
0.7%
Rent to Value Ratio
Active
$389,000
2
bds
|
2
ba
|
1,180
sqft
|
built
1945
1980 Bay Dr, Miami Beach, FL 33141
$-842
Cash flow
-11.3%
Cash-on-Cash Return
3.7%
Cap rate
0.9%
Rent to Value Ratio
Pending
$590,000
2
bds
|
2
ba
|
1,320
sqft
|
built
1969
5701 Collins Ave, Miami Beach, FL 33140
$-3,379
Cash flow
-29.9%
Cash-on-Cash Return
-0.6%
Cap rate
0.6%
Rent to Value Ratio
Active
$875,000
2
bds
|
2
ba
|
1,455
sqft
|
built
1970
7135 Collins Ave, Miami Beach, FL 33141
$-3,488
Cash flow
-20.8%
Cash-on-Cash Return
1.5%
Cap rate
0.5%
Rent to Value Ratio
Active
$665,000
2
bds
|
2
ba
|
1,320
sqft
|
built
1969
5701 Collins Ave, Miami Beach, FL 33140
$-3,205
Cash flow
-25.1%
Cash-on-Cash Return
0.5%
Cap rate
0.6%
Rent to Value Ratio
Active
$375,000
1
bds
|
1
ba
|
633
sqft
|
built
1971
6969 Collins Ave, Miami Beach, FL 33141
$-946
Cash flow
-13.2%
Cash-on-Cash Return
3.3%
Cap rate
0.7%
Rent to Value Ratio

Active
$349,500
1
bds
|
2
ba
|
1,003
sqft
|
built
1963
900 Bay Dr, Miami Beach, FL 33141
$-1,460
Cash flow
-21.8%
Cash-on-Cash Return
1.3%
Cap rate
0.8%
Rent to Value Ratio
Active
$775,000
2
bds
|
2
ba
|
1,296
sqft
|
built
1969
5701 Collins Ave, Miami Beach, FL 33140
$-3,306
Cash flow
-22.3%
Cash-on-Cash Return
1.2%
Cap rate
0.6%
Rent to Value Ratio

Active
$555,000
2
bds
|
2
ba
|
1,286
sqft
|
built
1966
2899 Collins Ave, Miami Beach, FL 33140
$-1,958
Cash flow
-18.4%
Cash-on-Cash Return
2.0%
Cap rate
0.7%
Rent to Value Ratio

Active
$499,000
2
bds
|
1
ba
|
851
sqft
|
built
1956
1816 Meridian Ave, Miami Beach, FL 33139
$-1,773
Cash flow
-18.5%
Cash-on-Cash Return
2.0%
Cap rate
0.7%
Rent to Value Ratio
Active
$375,000
2
bds
|
1
ba
|
720
sqft
|
built
1936
1219 Meridian Ave, Miami Beach, FL 33139
$-1,491
Cash flow
-20.7%
Cash-on-Cash Return
1.5%
Cap rate
0.7%
Rent to Value Ratio
Active
$599,000
2
bds
|
1
ba
|
812
sqft
|
built
1956
1816 Meridian Ave, Miami Beach, FL 33139
$-2,178
Cash flow
-19.0%
Cash-on-Cash Return
1.9%
Cap rate
0.6%
Rent to Value Ratio
Active
$430,000
2
bds
|
2
ba
|
940
sqft
|
built
1966
1881 Washington Ave, Miami Beach, FL 33139
$-1,472
Cash flow
-17.9%
Cash-on-Cash Return
2.2%
Cap rate
0.8%
Rent to Value Ratio

Active
$499,000
2
bds
|
1
ba
|
820
sqft
|
built
1956
1816 Meridian Ave, Miami Beach, FL 33139
$-1,732
Cash flow
-18.1%
Cash-on-Cash Return
2.1%
Cap rate
0.7%
Rent to Value Ratio
Active
$3,750,000
3
bds
|
4
ba
|
2,643
sqft
|
built
2003
400 Alton Rd, Miami Beach, FL 33139
$-18,753
Cash flow
-26.1%
Cash-on-Cash Return
0.3%
Cap rate
0.3%
Rent to Value Ratio
Active
$1,550,000
3
bds
|
2
ba
|
1,234
sqft
|
built
1997
650 West Ave, Miami Beach, FL 33139
$-5,928
Cash flow
-20.0%
Cash-on-Cash Return
1.7%
Cap rate
0.6%
Rent to Value Ratio
Active
$540,000
1
bds
|
1
ba
|
852
sqft
|
built
1968
1000 West Ave, Miami Beach, FL 33139
$-1,954
Cash flow
-18.9%
Cash-on-Cash Return
1.9%
Cap rate
0.6%
Rent to Value Ratio
Active
$745,000
2
bds
|
2
ba
|
914
sqft
|
built
1926
130 3rd St, Miami Beach, FL 33139
$-1,997
Cash flow
-14.0%
Cash-on-Cash Return
3.1%
Cap rate
0.6%
Rent to Value Ratio
Active
$1,250,000
2
bds
|
2
ba
|
1,200
sqft
|
built
2008
6801 Collins Ave, Miami Beach, FL 33141
$-4,808
Cash flow
-20.1%
Cash-on-Cash Return
1.7%
Cap rate
0.4%
Rent to Value Ratio
Active
$355,000
1
bds
|
1
ba
|
810
sqft
|
built
1969
1754 Meridian Ave, Miami Beach, FL 33139
$-1,087
Cash flow
-16.0%
Cash-on-Cash Return
2.6%
Cap rate
0.7%
Rent to Value Ratio
Active
$6,299,000
5
bds
|
6
ba
|
3,406
sqft
|
built
2014
412 E Rivo Alto Dr, Miami Beach, FL 33139
$-29,364
Cash flow
-24.3%
Cash-on-Cash Return
0.7%
Cap rate
0.2%
Rent to Value Ratio

Active
$399,000
1
bds
|
1
ba
|
437
sqft
|
built
2019
6080 Collins Ave, Miami Beach, FL 33140
$-1,394
Cash flow
-18.2%
Cash-on-Cash Return
2.1%
Cap rate
0.8%
Rent to Value Ratio
Active
$575,000
1
bds
|
2
ba
|
750
sqft
|
built
1995
1688 West Ave, Miami Beach, FL 33139
$-2,164
Cash flow
-19.6%
Cash-on-Cash Return
1.8%
Cap rate
0.5%
Rent to Value Ratio
Active
$1,495,000
2
bds
|
3
ba
|
1,733
sqft
|
built
1972
11 Island Ave, Miami Beach, FL 33139
$-5,186
Cash flow
-18.1%
Cash-on-Cash Return
2.1%
Cap rate
0.5%
Rent to Value Ratio
Active
$314,900
bds
|
1
ba
|
781
sqft
|
built
1968
1000 West Ave, Miami Beach, FL 33139
$-1,217
Cash flow
-20.2%
Cash-on-Cash Return
1.6%
Cap rate
0.8%
Rent to Value Ratio

Active
$899,000
1
bds
|
2
ba
|
778
sqft
|
built
2008
5875 Collins Ave, Miami Beach, FL 33140
$-3,655
Cash flow
-21.2%
Cash-on-Cash Return
1.4%
Cap rate
0.6%
Rent to Value Ratio
Active
$749,000
2
bds
|
2
ba
|
1,680
sqft
|
built
1967
5640 Collins Ave, Miami Beach, FL 33140
$-2,174
Cash flow
-15.1%
Cash-on-Cash Return
2.8%
Cap rate
0.8%
Rent to Value Ratio
Active
$360,000
2
bds
|
1
ba
|
816
sqft
|
built
1956
1816 Meridian Ave, Miami Beach, FL 33139
$-1,581
Cash flow
-22.9%
Cash-on-Cash Return
1.0%
Cap rate
0.8%
Rent to Value Ratio
Active
$298,000
bds
|
1
ba
|
331
sqft
|
built
2019
6080 Collins Ave, Miami Beach, FL 33140
$-796
Cash flow
-13.9%
Cash-on-Cash Return
3.1%
Cap rate
0.9%
Rent to Value Ratio

Active
$2,800,000
4
bds
|
5
ba
|
1,908
sqft
|
built
1940
3760 Royal Palm Ave, Miami Beach, FL 33140
$-11,901
Cash flow
-22.2%
Cash-on-Cash Return
1.2%
Cap rate
0.3%
Rent to Value Ratio