Miami Beach, FL Investment Properties for Sale
Browse homes for sale and investment properties in Miami Beach, FL. Refine your search by price, property type, or more.
Best cash flowing properties in Miami Beach, FL
Active
$230,000
bds
|
1
ba
|
0
sqft
|
built
1973
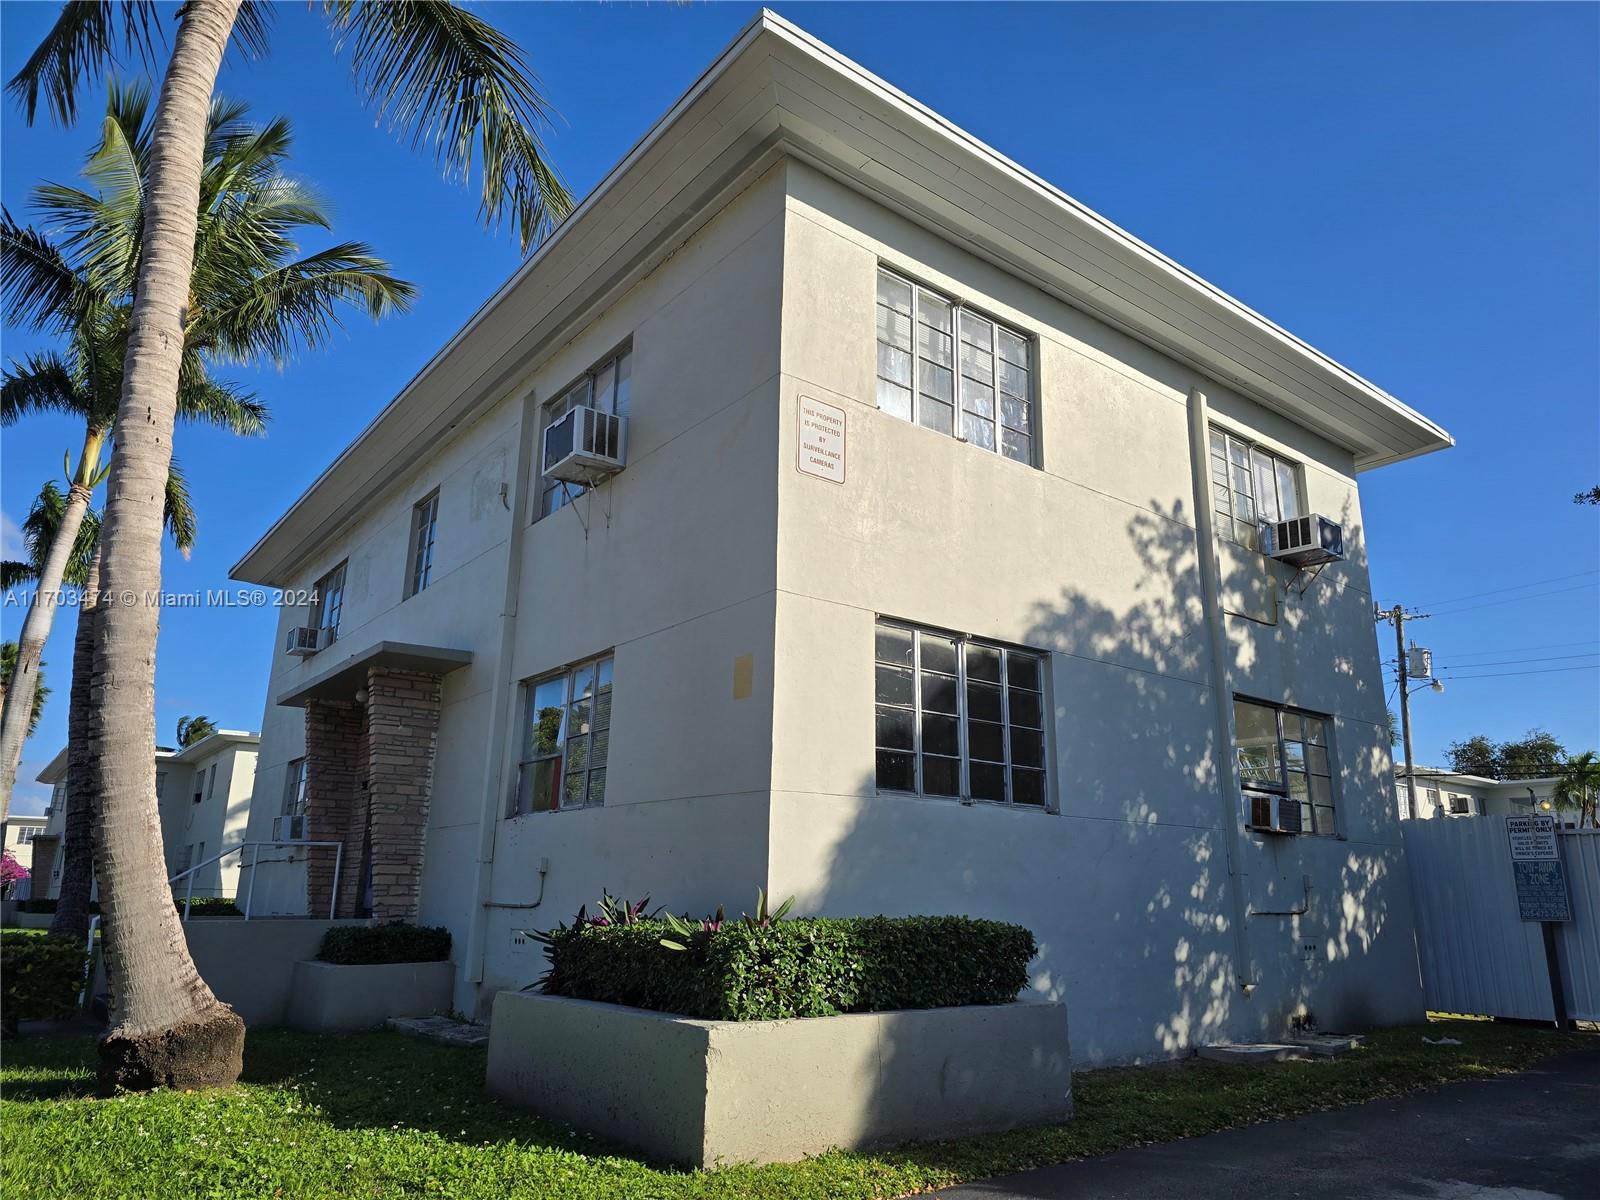
2000 Biarritz Dr, Miami Beach, FL 33141
$-609
Cash flow
-13.8%
Cash-on-Cash Return
3.1%
Cap rate
0.7%
Rent to Value Ratio
Active
$230,000
bds
|
1
ba
|
420
sqft
|
built
1956
911 Meridian Ave, Miami Beach, FL 33139
$-669
Cash flow
-15.2%
Cash-on-Cash Return
2.8%
Cap rate
0.7%
Rent to Value Ratio
1,965 out of 2,167 properties for sale in Miami Beach, FL
Limited Results Shown
Create a free account, or log in to reveal all property listings and enjoy the complete experience.

Active
$349,999
bds
|
1
ba
|
569
sqft
|
built
2006
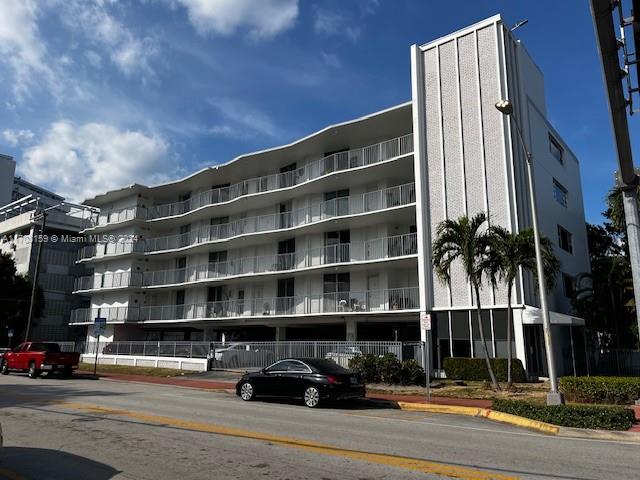
6580 Indian Creek Dr, Miami Beach, FL 33141
$-1,032
Cash flow
-15.4%
Cash-on-Cash Return
2.7%
Cap rate
0.7%
Rent to Value Ratio
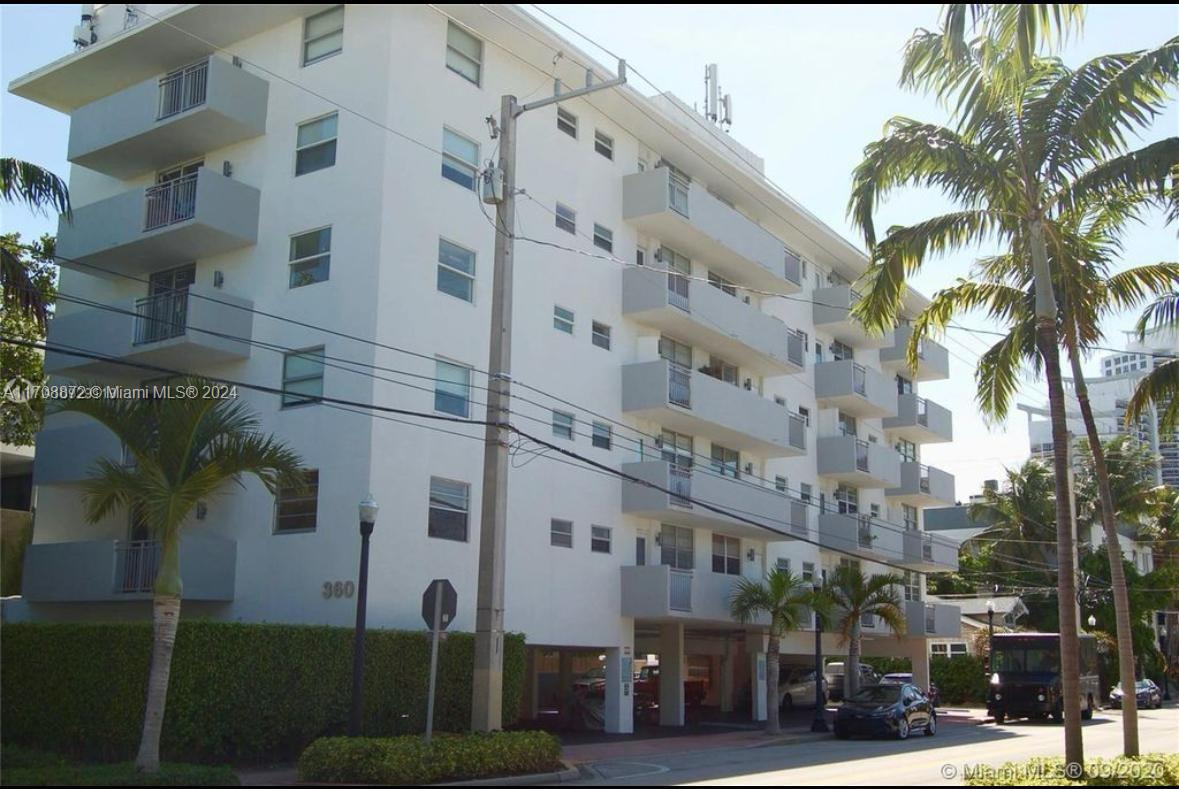
Active
$384,000
1
bds
|
1
ba
|
626
sqft
|
built
1969
360 Meridian Ave, Miami Beach, FL 33139
$-1,169
Cash flow
-15.9%
Cash-on-Cash Return
2.6%
Cap rate
0.7%
Rent to Value Ratio
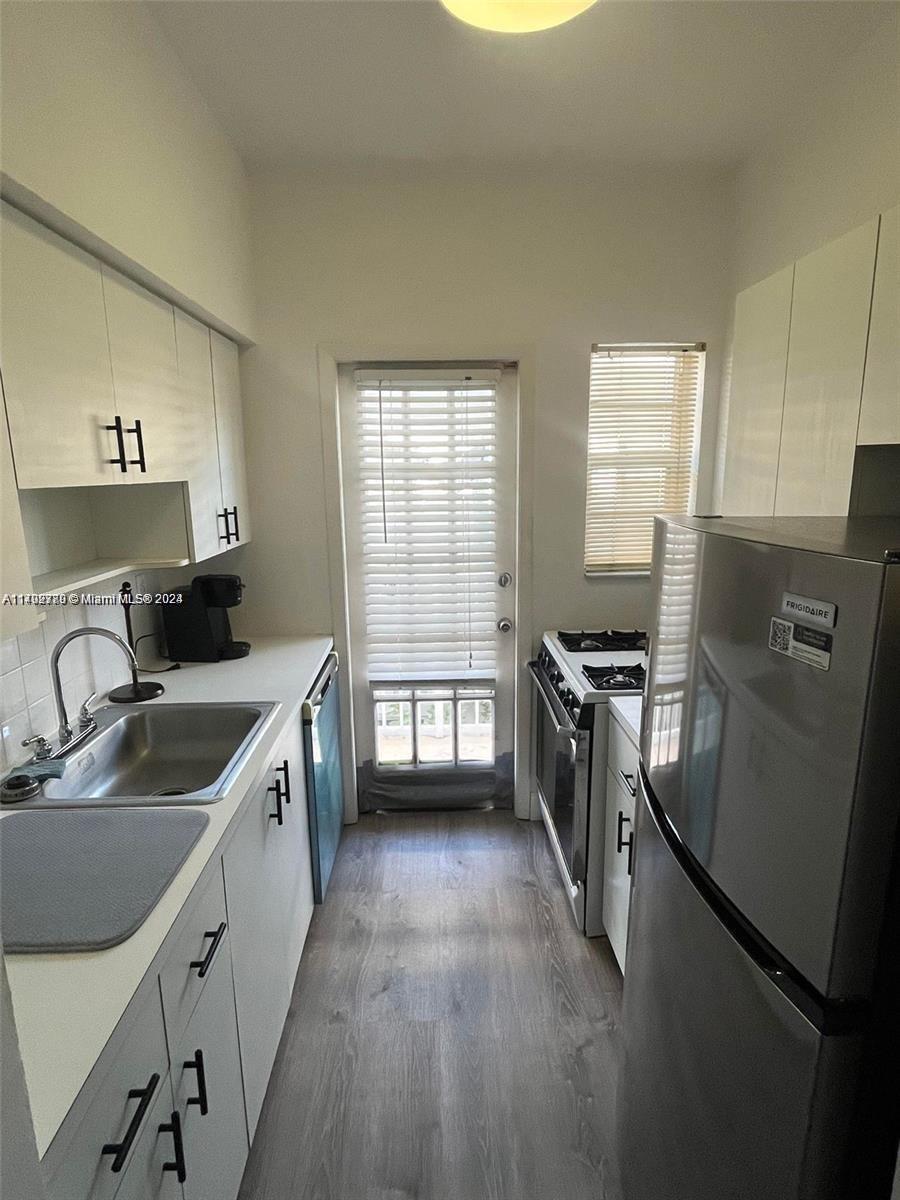
Active
$299,900
bds
|
1
ba
|
781
sqft
|
built
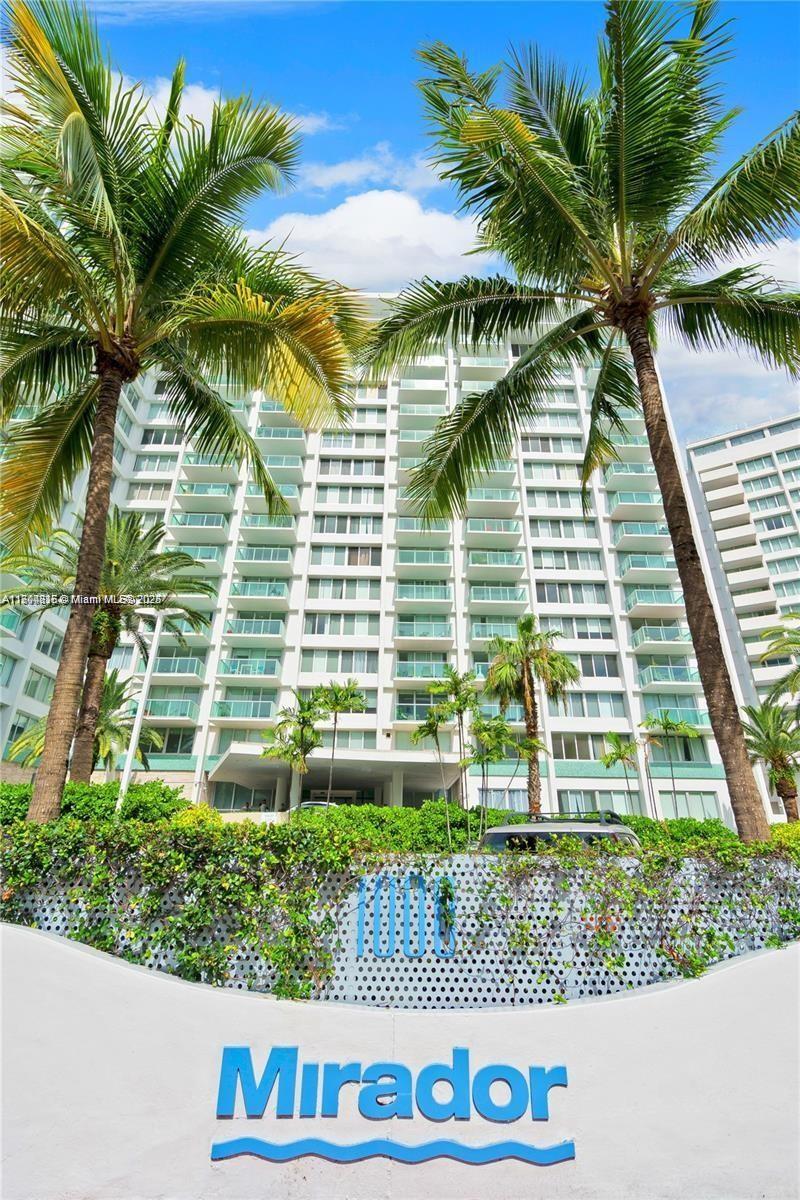
1968
1000 West Ave, Miami Beach, FL 33139
$-1,308
Cash flow
-22.8%
Cash-on-Cash Return
1.0%
Cap rate
0.7%
Rent to Value Ratio
Active
$295,000
2
bds
|
1
ba
|
814
sqft
|
built
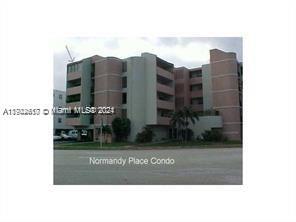
1989
1975 Normandy Dr, Miami Beach, FL 33141
$-997
Cash flow
-17.6%
Cash-on-Cash Return
2.2%
Cap rate
0.7%
Rent to Value Ratio

Active
$393,000
1
bds
|
1
ba
|
626
sqft
|
built
1969
360 Meridian Ave, Miami Beach, FL 33139
$-1,126
Cash flow
-14.9%
Cash-on-Cash Return
2.8%
Cap rate
0.7%
Rent to Value Ratio
Active
$1,450,000
1
bds
|
1
ba
|
880
sqft
|
built
1926
2301 Collins Ave, Miami Beach, FL 33139
$-5,913
Cash flow
-21.3%
Cash-on-Cash Return
1.4%
Cap rate
0.5%
Rent to Value Ratio
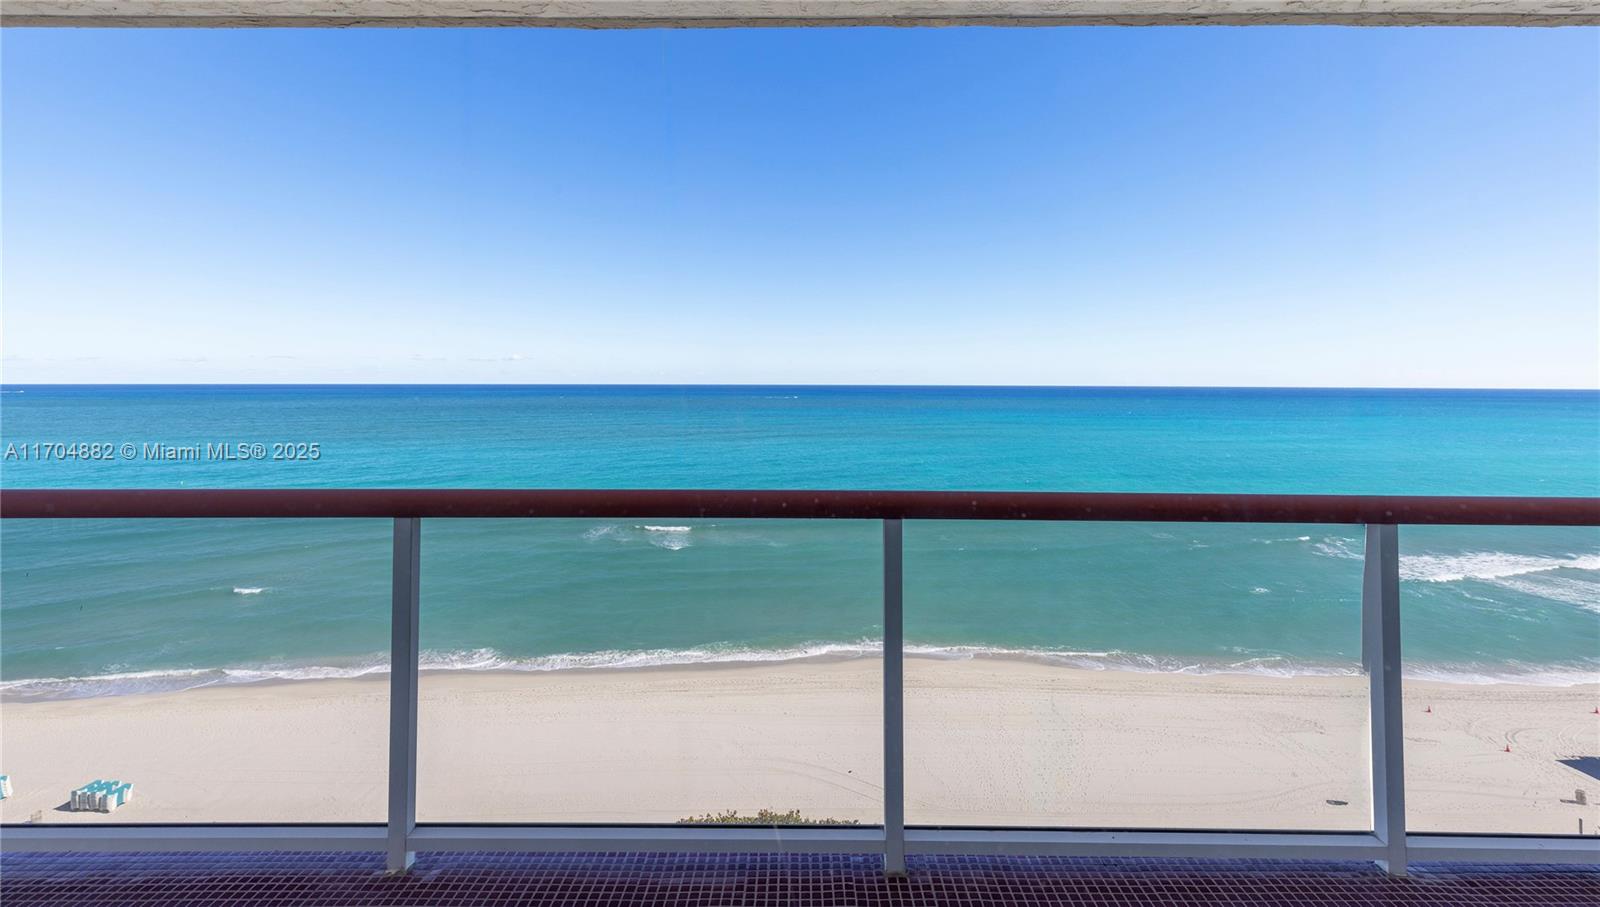
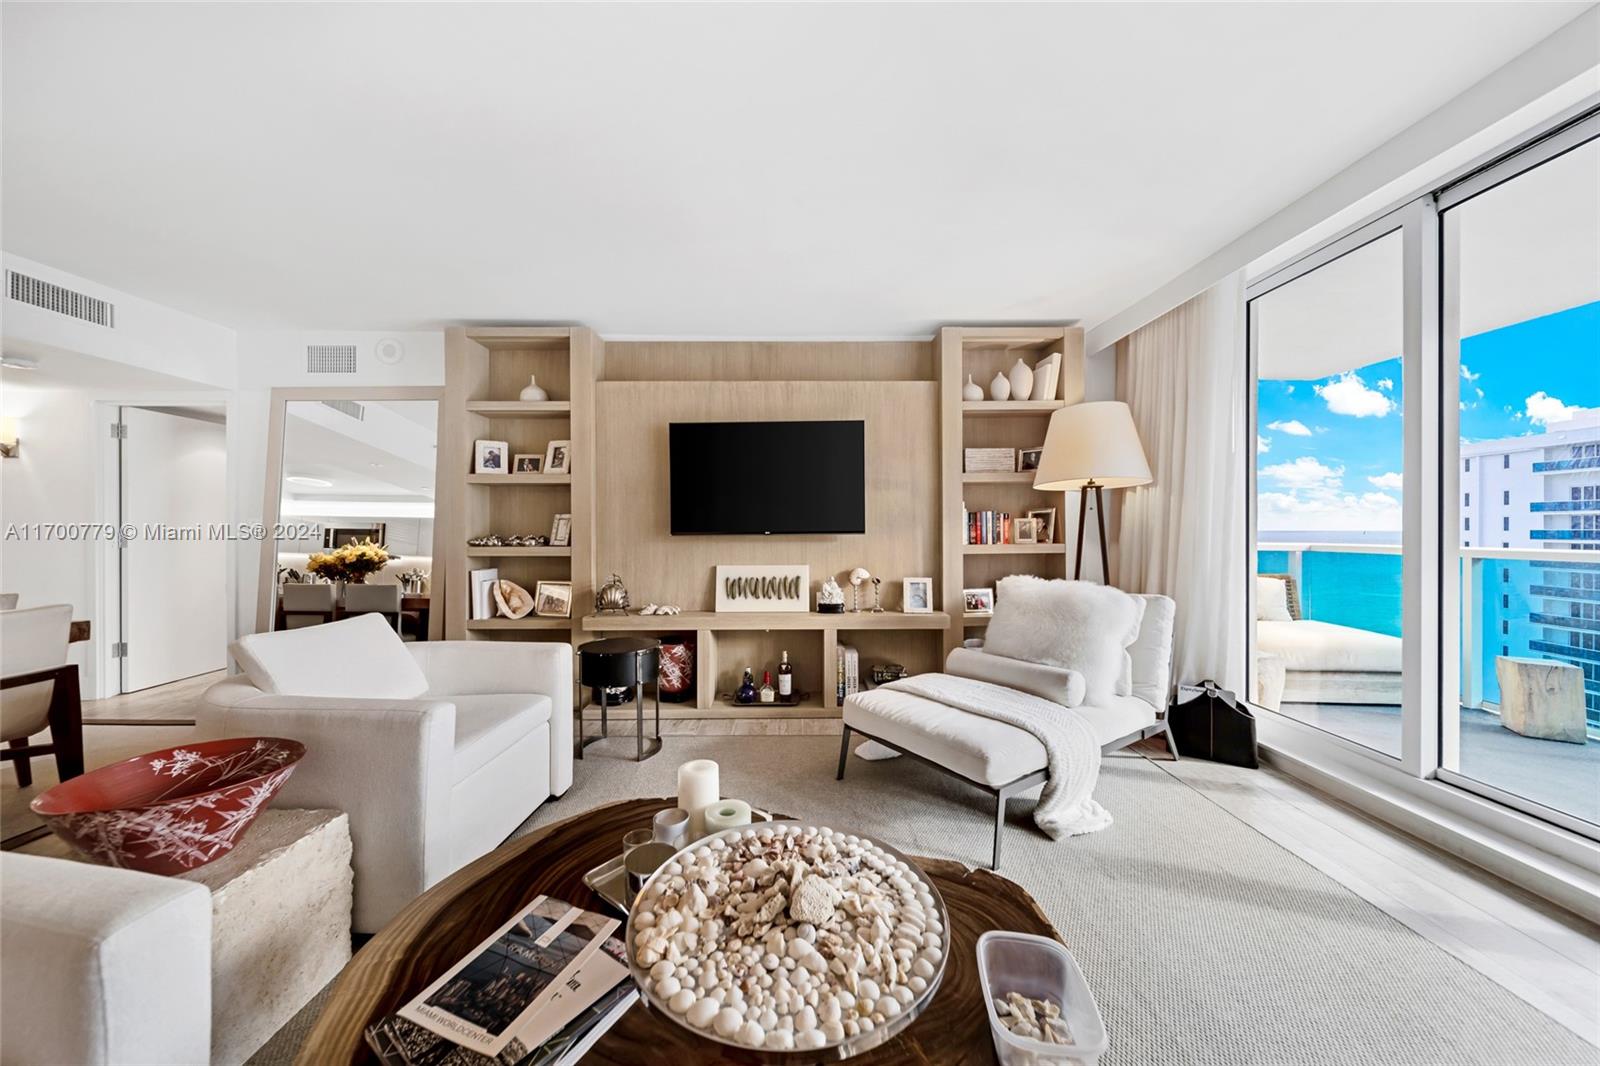
Active
$1,025,000
bds
|
1
ba
|
824
sqft
|
built
2008
4391 Collins Ave, Miami Beach, FL 33140
$-4,003
Cash flow
-20.4%
Cash-on-Cash Return
1.6%
Cap rate
0.5%
Rent to Value Ratio
Active
$350,000
2
bds
|
2
ba
|
799
sqft
|
built
2015
922 Jefferson Ave, Miami Beach, FL 33139
$-1,520
Cash flow
-22.7%
Cash-on-Cash Return
1.1%
Cap rate
0.7%
Rent to Value Ratio
Active
$999,000
2
bds
|
2
ba
|
1,180
sqft
|
built
1991
6767 Collins Ave, Miami Beach, FL 33141
$-2,772
Cash flow
-14.5%
Cash-on-Cash Return
3.0%
Cap rate
0.6%
Rent to Value Ratio
Active
$5,950,000
3
bds
|
3
ba
|
1,766
sqft
|
built
2015
102 24th St, Miami Beach, FL 33139
$-35,398
Cash flow
-31.0%
Cash-on-Cash Return
-0.9%
Cap rate
0.1%
Rent to Value Ratio
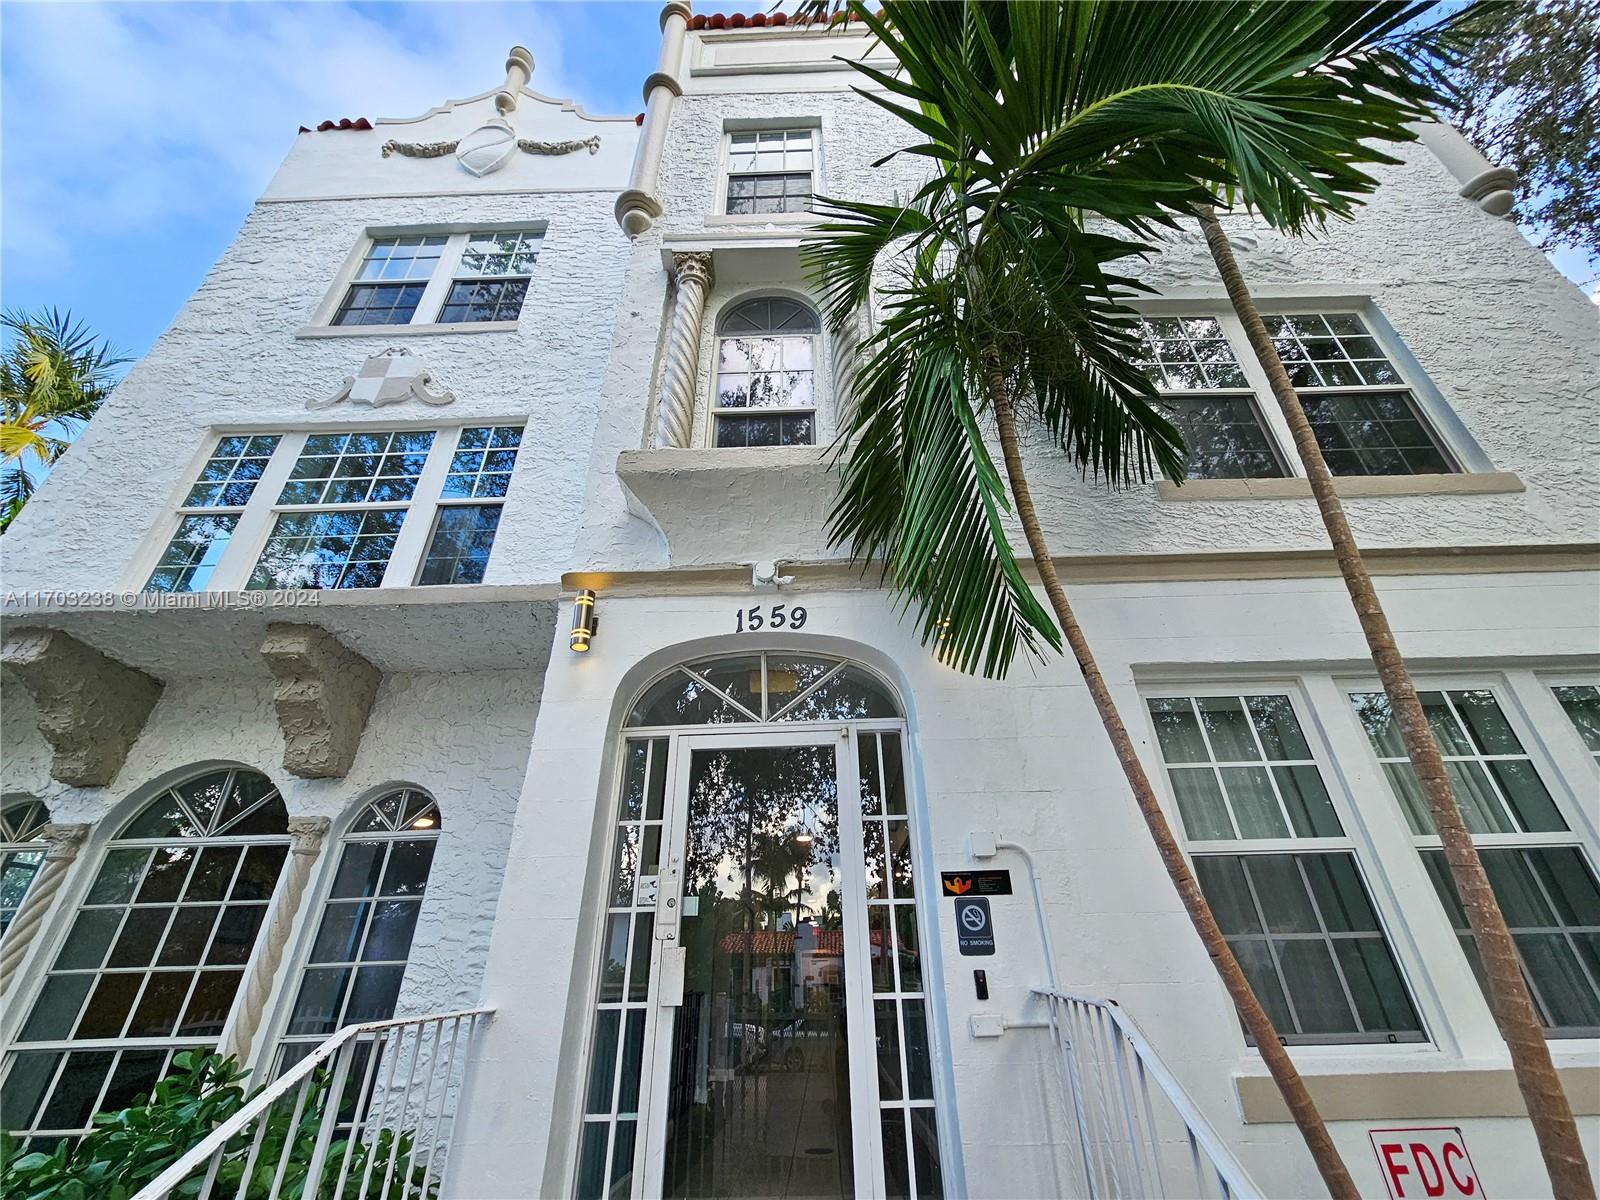
Active
$275,000
1
bds
|
1
ba
|
526
sqft
|
built
1925
1559 Michigan Ave, Miami Beach, FL 33139
$-903
Cash flow
-17.1%
Cash-on-Cash Return
2.3%
Cap rate
0.7%
Rent to Value Ratio

Active
$225,000
1
bds
|
1
ba
|
446
sqft
|
built
1938
1526 Pennsylvania Ave, Miami Beach, FL 33139
$-732
Cash flow
-17.0%
Cash-on-Cash Return
2.4%
Cap rate
0.8%
Rent to Value Ratio
Active
$357,000
1
bds
|
1
ba
|
600
sqft
|
built
1953
4201 Indian Creek Dr, Miami Beach, FL 33140
$-1,005
Cash flow
-14.7%
Cash-on-Cash Return
2.9%
Cap rate
0.6%
Rent to Value Ratio

Active
$260,000
1
bds
|
1
ba
|
444
sqft
|
built
1940
600 15th St, Miami Beach, FL 33139
$-724
Cash flow
-14.5%
Cash-on-Cash Return
2.9%
Cap rate
0.8%
Rent to Value Ratio

Active
$260,000
1
bds
|
1
ba
|
410
sqft
|
built
2014
801 15th St, Miami Beach, FL 33139
$-915
Cash flow
-18.4%
Cash-on-Cash Return
2.1%
Cap rate
0.8%
Rent to Value Ratio
Active
$6,750,000
3
bds
|
4
ba
|
2,403
sqft
|
built
1981
2815 Regatta Ave, Miami Beach, FL 33140
$-36,196
Cash flow
-28.0%
Cash-on-Cash Return
-0.2%
Cap rate
0.1%
Rent to Value Ratio
Active
$254,000
1
bds
|
1
ba
|
635
sqft
|
built
1968
919 Michigan Ave, Miami Beach, FL 33139
$-1,026
Cash flow
-21.1%
Cash-on-Cash Return
1.4%
Cap rate
0.7%
Rent to Value Ratio
Active
$1,850,000
2
bds
|
4
ba
|
2,827
sqft
|
built
1974
5500 Collins Ave, Miami Beach, FL 33140
$-8,630
Cash flow
-24.3%
Cash-on-Cash Return
0.7%
Cap rate
0.5%
Rent to Value Ratio
Active
$789,000
2
bds
|
2
ba
|
1,071
sqft
|
built
1965
1200 West Ave, Miami Beach, FL 33139
$-1,948
Cash flow
-12.9%
Cash-on-Cash Return
3.3%
Cap rate
0.7%
Rent to Value Ratio
Active
$197,000
1
bds
|
1
ba
|
592
sqft
|
built
1949
660 84th St, Miami Beach, FL 33141
$-765
Cash flow
-20.3%
Cash-on-Cash Return
1.6%
Cap rate
0.9%
Rent to Value Ratio
Active
$610,000
2
bds
|
2
ba
|
920
sqft
|
built
1975
201 Jefferson Ave, Miami Beach, FL 33139
$-1,880
Cash flow
-16.1%
Cash-on-Cash Return
2.6%
Cap rate
0.7%
Rent to Value Ratio
Active
$2,000,000
2
bds
|
3
ba
|
1,094
sqft
|
built
2008
5875 Collins Ave, Miami Beach, FL 33140
$-8,136
Cash flow
-21.2%
Cash-on-Cash Return
1.4%
Cap rate
0.4%
Rent to Value Ratio
Active
$429,000
1
bds
|
2
ba
|
1,046
sqft
|
built
1964
5005 Collins Ave, Miami Beach, FL 33140
$-994
Cash flow
-12.1%
Cash-on-Cash Return
3.5%
Cap rate
0.6%
Rent to Value Ratio
Active
$280,000
1
bds
|
1
ba
|
680
sqft
|
built
1965
1100 Alton Rd, Miami Beach, FL 33139
$-847
Cash flow
-15.8%
Cash-on-Cash Return
2.7%
Cap rate
0.8%
Rent to Value Ratio

Active
$737,800
2
bds
|
2
ba
|
1,253
sqft
|
built
1964
5005 Collins Ave, Miami Beach, FL 33140
$-2,911
Cash flow
-20.6%
Cash-on-Cash Return
1.6%
Cap rate
0.7%
Rent to Value Ratio

Active
$1,300,000
3
bds
|
2
ba
|
1,171
sqft
|
built
1939
2130 Verdun Dr, Miami Beach, FL 33141
$-3,057
Cash flow
-12.3%
Cash-on-Cash Return
3.5%
Cap rate
0.5%
Rent to Value Ratio
Active
$3,450,000
3
bds
|
3
ba
|
1,974
sqft
|
built
2008
1470 16th St, Miami Beach, FL 33139
$-17,086
Cash flow
-25.8%
Cash-on-Cash Return
0.3%
Cap rate
0.3%
Rent to Value Ratio
Active
$280,000
1
bds
|
1
ba
|
680
sqft
|
built
1970
631 Jefferson Ave, Miami Beach, FL 33139
$-1,161
Cash flow
-21.6%
Cash-on-Cash Return
1.3%
Cap rate
0.8%
Rent to Value Ratio
Active
$998,500
2
bds
|
3
ba
|
1,940
sqft
|
built
1968
5700 Collins Ave, Miami Beach, FL 33140
$-4,917
Cash flow
-25.7%
Cash-on-Cash Return
0.4%
Cap rate
0.6%
Rent to Value Ratio
Active
$2,849,000
5
bds
|
6
ba
|
3,741
sqft
|
built
2005
230 Water Way, Miami Beach, FL 33141
$-13,823
Cash flow
-25.3%
Cash-on-Cash Return
0.5%
Cap rate
0.3%
Rent to Value Ratio
Active
$230,000
bds
|
1
ba
|
0
sqft
|
built
1973
2000 Biarritz Dr, Miami Beach, FL 33141
$-609
Cash flow
-13.8%
Cash-on-Cash Return
3.1%
Cap rate
0.7%
Rent to Value Ratio

Active
$740,000
1
bds
|
2
ba
|
1,224
sqft
|
built
2016
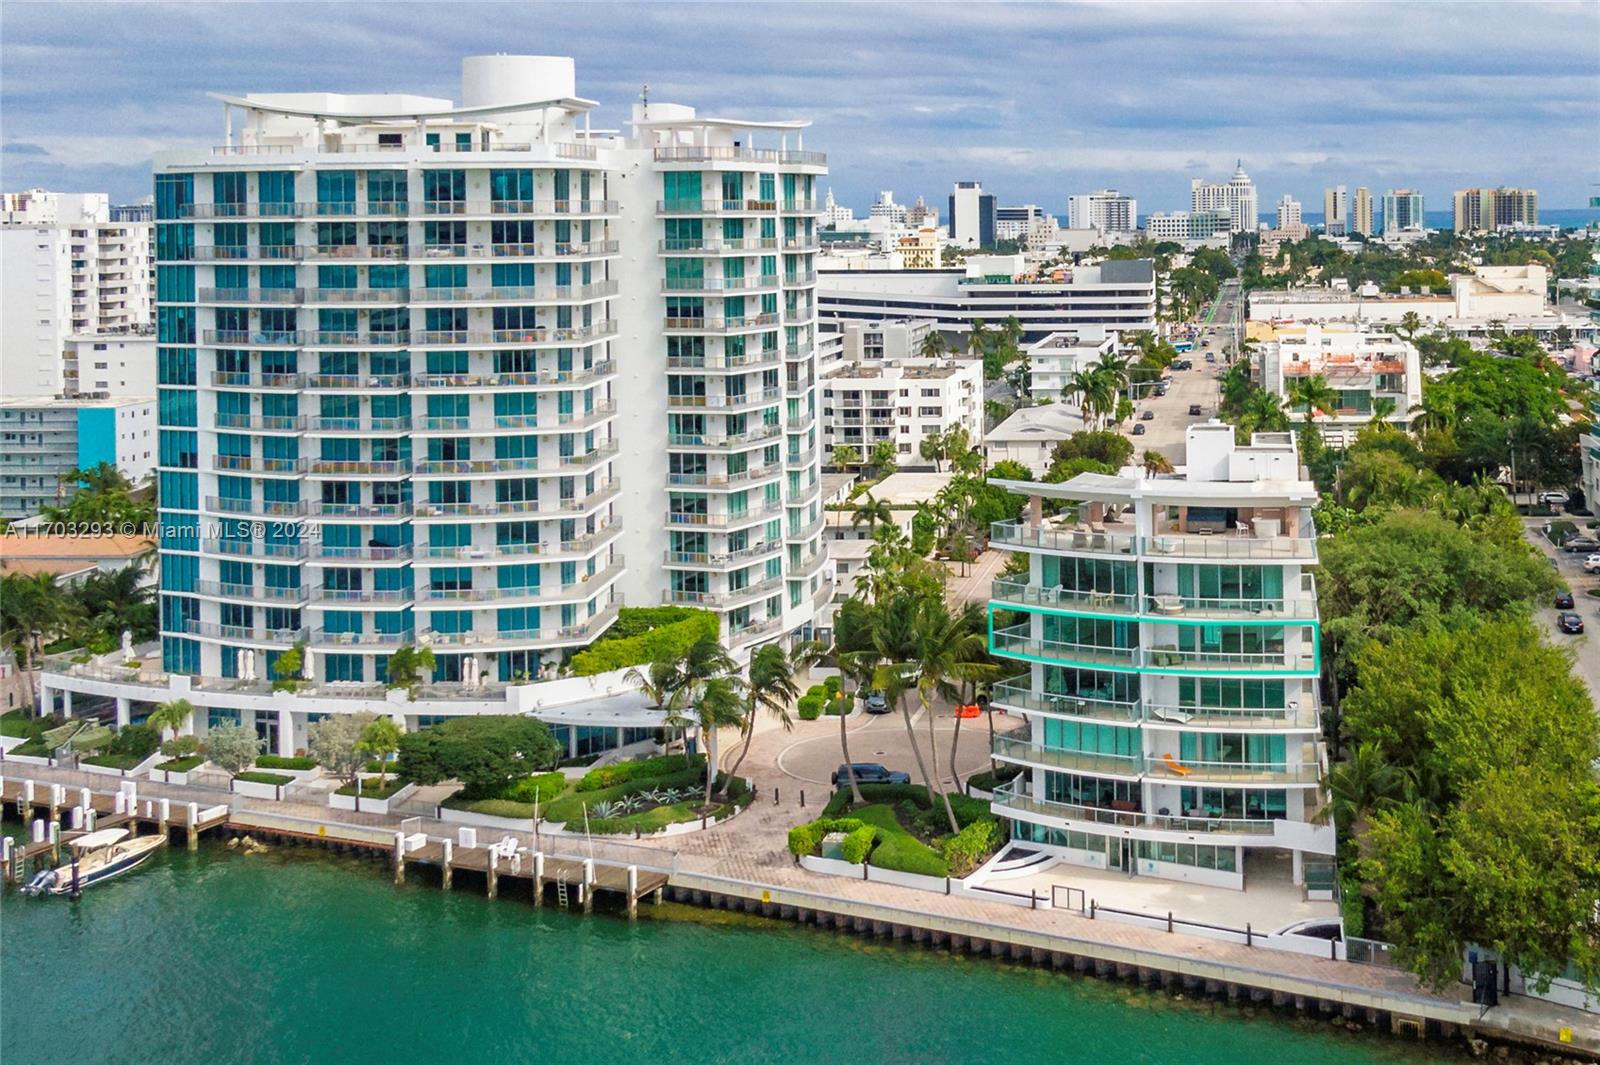
6620 Indian Creek Dr, Miami Beach, FL 33141
$-3,021
Cash flow
-21.3%
Cash-on-Cash Return
1.4%
Cap rate
0.7%
Rent to Value Ratio
Active
$38,500,000
8
bds
|
10
ba
|
11,307
sqft
|
built
1926
49 Palm Ave, Miami Beach, FL 33139
$-211,796
Cash flow
-28.7%
Cash-on-Cash Return
-0.3%
Cap rate
0.0%
Rent to Value Ratio
Active
$230,000
bds
|
1
ba
|
420
sqft
|
built
1956
911 Meridian Ave, Miami Beach, FL 33139
$-669
Cash flow
-15.2%
Cash-on-Cash Return
2.8%
Cap rate
0.7%
Rent to Value Ratio
Active
$5,990,000
2
bds
|
3
ba
|
1,754
sqft
|
built
2015
102 24th St, Miami Beach, FL 33139
$-37,811
Cash flow
-32.9%
Cash-on-Cash Return
-1.3%
Cap rate
0.1%
Rent to Value Ratio

Active
$950,000
2
bds
|
2
ba
|
1,305
sqft
|
built
1967
5 Island Ave, Miami Beach, FL 33139
$-3,691
Cash flow
-20.3%
Cash-on-Cash Return
1.6%
Cap rate
0.7%
Rent to Value Ratio
Active
$3,200,000
3
bds
|
3
ba
|
1,842
sqft
|
built
2008
1445 16th St, Miami Beach, FL 33139
$-13,890
Cash flow
-22.6%
Cash-on-Cash Return
1.1%
Cap rate
0.4%
Rent to Value Ratio

Active
$645,000
1
bds
|
1
ba
|
1,011
sqft
|
built
2010
6000 Collins Ave, Miami Beach, FL 33140
$-2,397
Cash flow
-19.4%
Cash-on-Cash Return
1.8%
Cap rate
0.5%
Rent to Value Ratio
Active
$730,000
2
bds
|
2
ba
|
1,061
sqft
|
built
1960
1500 Bay Rd, Miami Beach, FL 33139
$-3,282
Cash flow
-23.5%
Cash-on-Cash Return
0.9%
Cap rate
0.6%
Rent to Value Ratio
Active
$4,400,000
2
bds
|
3
ba
|
1,687
sqft
|
built
2015
102 24th St, Miami Beach, FL 33139
$-25,288
Cash flow
-30.0%
Cash-on-Cash Return
-0.6%
Cap rate
0.2%
Rent to Value Ratio