Miami Beach, FL Investment Properties for Sale
Browse homes for sale and investment properties in Miami Beach, FL. Refine your search by price, property type, or more.
Best cash flowing properties in Miami Beach, FL

Active
$335,000
bds
|
1
ba
|
530
sqft
|
built
2008
1100 West Ave, Miami Beach, FL 33139
$-78
Cash flow
-1.2%
Cash-on-Cash Return
6.0%
Cap rate
0.9%
Rent to Value Ratio
Active
$269,000
1
bds
|
1
ba
|
418
sqft
|
built
1967
524 Washington Ave, Miami Beach, FL 33139
$-172
Cash flow
-3.3%
Cash-on-Cash Return
5.5%
Cap rate
0.9%
Rent to Value Ratio
1,968 out of 2,170 properties for sale in Miami Beach, FL
Limited Results Shown
Create a free account, or log in to reveal all property listings and enjoy the complete experience.
Active
$759,000
2
bds
|
2
ba
|
1,324
sqft
|
built
1972
11 Island Ave, Miami Beach, FL 33139
$-2,607
Cash flow
-17.9%
Cash-on-Cash Return
2.2%
Cap rate
0.8%
Rent to Value Ratio
Active
$245,000
1
bds
|
1
ba
|
540
sqft
|
built
1937
1051 Meridian Ave, Miami Beach, FL 33139
$-198
Cash flow
-4.2%
Cash-on-Cash Return
5.3%
Cap rate
0.8%
Rent to Value Ratio
Active
$439,000
1
bds
|
1
ba
|
850
sqft
|
built
1966
800 West Ave, Miami Beach, FL 33139
$-1,556
Cash flow
-18.5%
Cash-on-Cash Return
2.0%
Cap rate
0.7%
Rent to Value Ratio
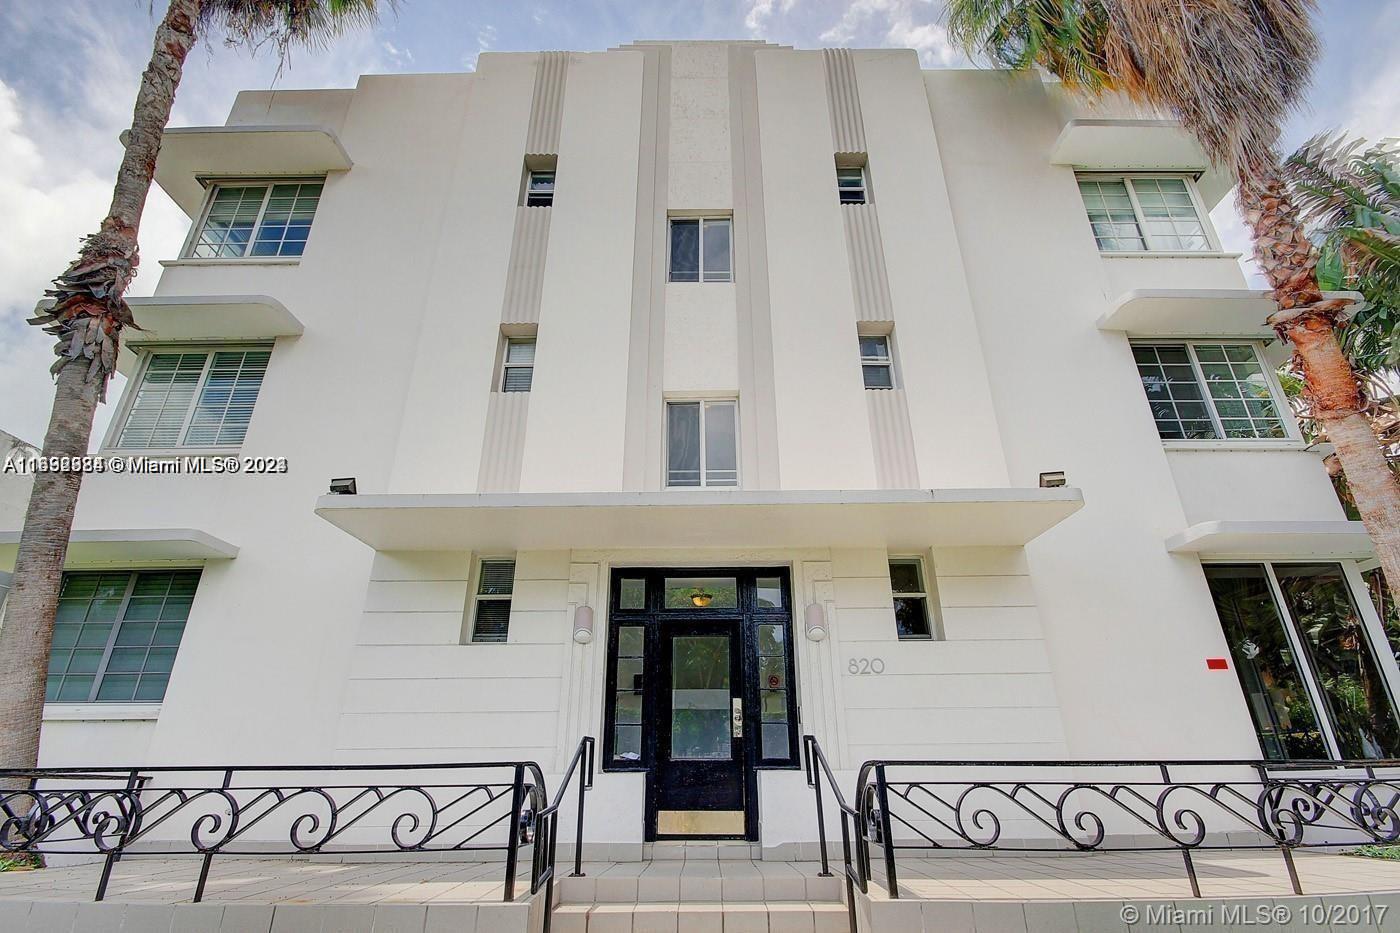
Active
$225,000
bds
|
1
ba
|
436
sqft
|
built
1939
820 Euclid Ave, Miami Beach, FL 33139
$-587
Cash flow
-13.6%
Cash-on-Cash Return
3.2%
Cap rate
0.8%
Rent to Value Ratio
Active
$500,000
1
bds
|
2
ba
|
676
sqft
|
built
2011
2155 Washington Ct, Miami Beach, FL 33139
$-1,697
Cash flow
-17.7%
Cash-on-Cash Return
2.2%
Cap rate
0.7%
Rent to Value Ratio

Active
$2,049,000
3
bds
|
3
ba
|
1,690
sqft
|
built
1996
6301 Collins Ave, Miami Beach, FL 33141
$-7,952
Cash flow
-20.2%
Cash-on-Cash Return
1.6%
Cap rate
0.5%
Rent to Value Ratio

Active
$495,000
1
bds
|
1
ba
|
852
sqft
|
built
1968
1000 West Ave, Miami Beach, FL 33139
$-1,916
Cash flow
-20.2%
Cash-on-Cash Return
1.6%
Cap rate
0.6%
Rent to Value Ratio
Active
$348,000
1
bds
|
1
ba
|
334
sqft
|
built
2019
6080 Collins Ave, Miami Beach, FL 33140
$-861
Cash flow
-12.9%
Cash-on-Cash Return
3.3%
Cap rate
0.9%
Rent to Value Ratio

Active
$1,995,000
4
bds
|
6
ba
|
3,654
sqft
|
built
2011
2100 Park Ave, Miami Beach, FL 33139
$-7,916
Cash flow
-20.7%
Cash-on-Cash Return
1.5%
Cap rate
0.6%
Rent to Value Ratio
Active
$14,900,000
5
bds
|
5
ba
|
4,697
sqft
|
built
1924
6065 Pine Tree Dr, Miami Beach, FL 33140
$-74,075
Cash flow
-25.9%
Cash-on-Cash Return
0.3%
Cap rate
0.1%
Rent to Value Ratio
Active
$690,000
2
bds
|
2
ba
|
1,180
sqft
|
built
1991
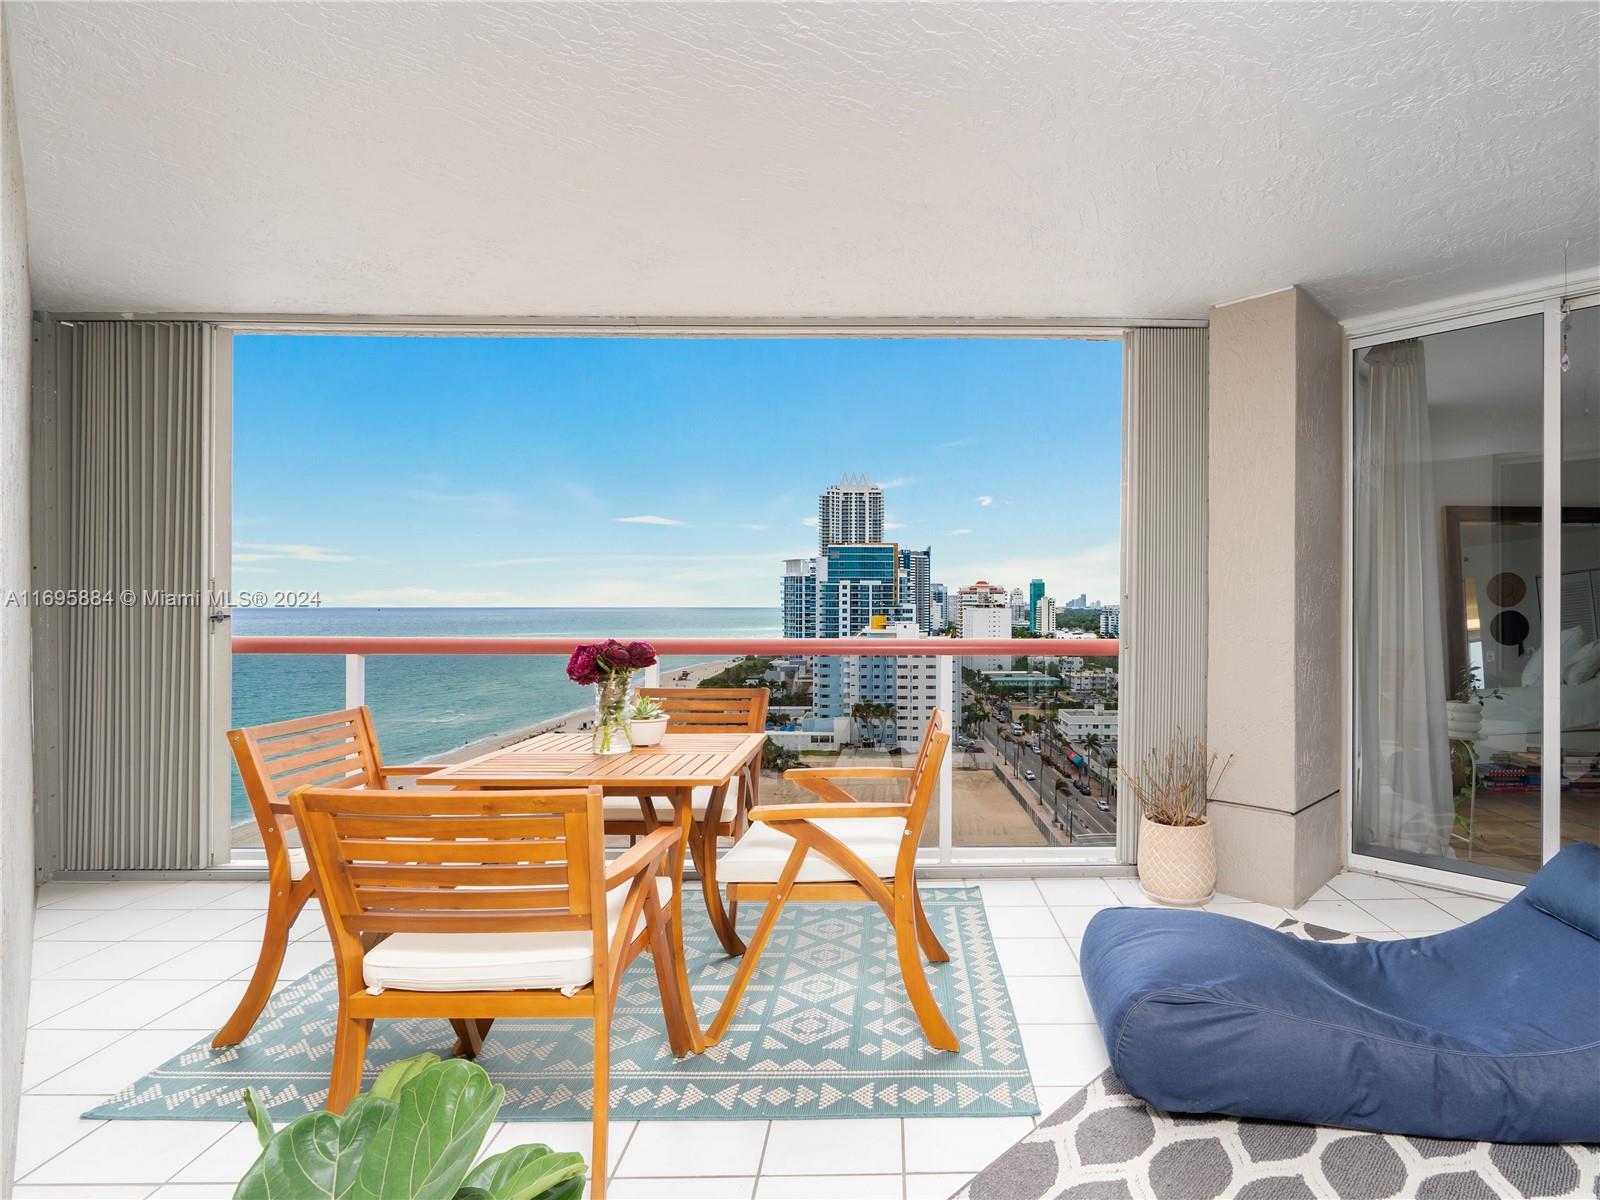
6767 Collins Ave, Miami Beach, FL 33141
$-3,331
Cash flow
-25.2%
Cash-on-Cash Return
0.5%
Cap rate
0.6%
Rent to Value Ratio

Active
$945,000
1
bds
|
1
ba
|
760
sqft
|
built
1926
2301 Collins Ave, Miami Beach, FL 33139
$-4,132
Cash flow
-22.8%
Cash-on-Cash Return
1.0%
Cap rate
0.4%
Rent to Value Ratio

Active
$325,000
1
bds
|
2
ba
|
1,063
sqft
|
built
1971
6039 Collins Ave, Miami Beach, FL 33140
$-1,201
Cash flow
-19.3%
Cash-on-Cash Return
1.8%
Cap rate
0.9%
Rent to Value Ratio
Active
$1,100,000
2
bds
|
2
ba
|
1,130
sqft
|
built
1965
100 Lincoln Rd, Miami Beach, FL 33139
$-4,728
Cash flow
-22.4%
Cash-on-Cash Return
1.1%
Cap rate
0.5%
Rent to Value Ratio
Active
$1,600,000
2
bds
|
2
ba
|
1,322
sqft
|
built
2004
6365 Collins Ave, Miami Beach, FL 33141
$-6,769
Cash flow
-22.1%
Cash-on-Cash Return
1.2%
Cap rate
0.4%
Rent to Value Ratio
Active
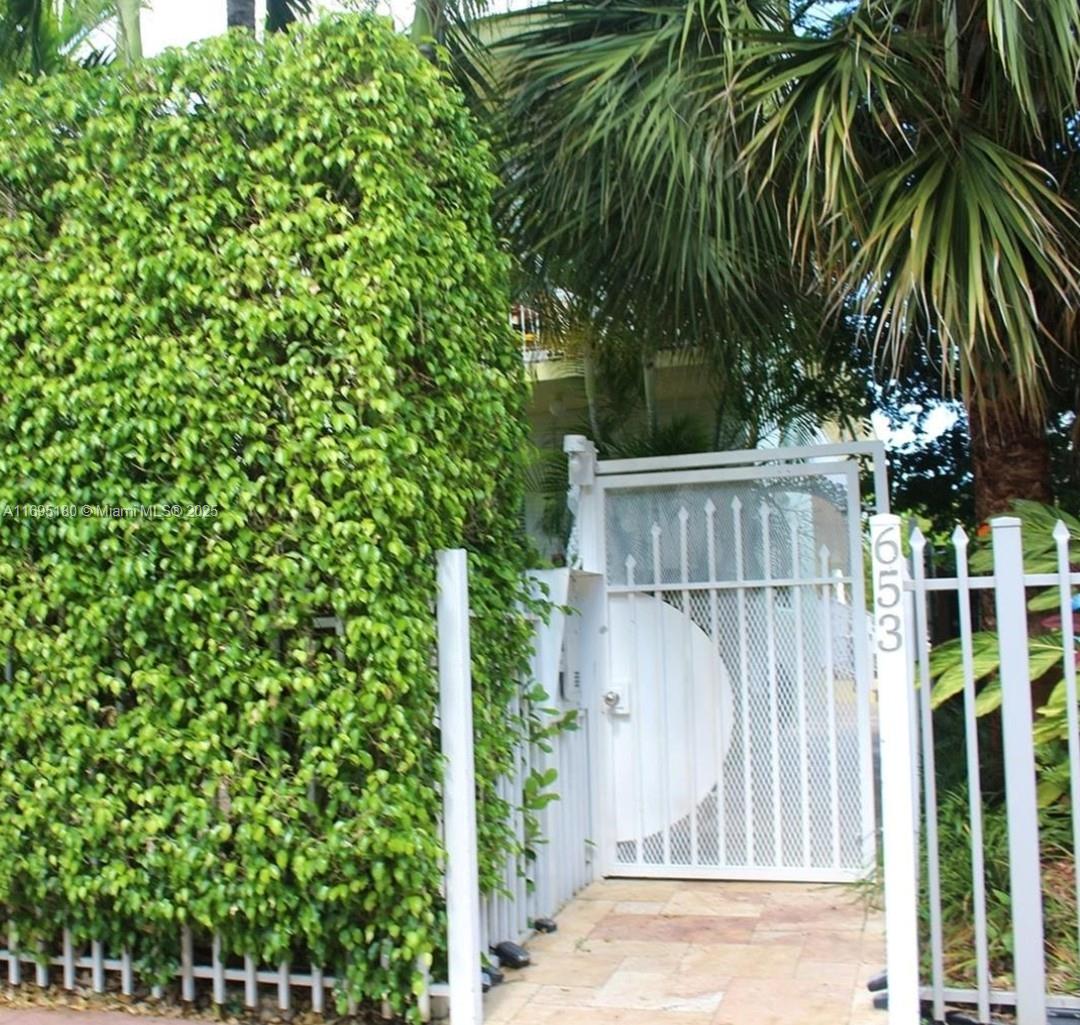
$201,000
bds
|
1
ba
|
450
sqft
|
built
1957
653 Michigan Ave, Miami Beach, FL 33139
$-418
Cash flow
-10.9%
Cash-on-Cash Return
3.8%
Cap rate
0.9%
Rent to Value Ratio
Active
$1,440,000
2
bds
|
2
ba
|
1,360
sqft
|
built
1966
5161 Collins Ave, Miami Beach, FL 33140
$-5,507
Cash flow
-20.0%
Cash-on-Cash Return
1.7%
Cap rate
0.5%
Rent to Value Ratio
Active
$1,275,000
3
bds
|
2
ba
|
1,390
sqft
|
built
1998
5900 Collins Ave, Miami Beach, FL 33140
$-6,282
Cash flow
-25.7%
Cash-on-Cash Return
0.4%
Cap rate
0.4%
Rent to Value Ratio
Active
$335,000
bds
|
1
ba
|
530
sqft
|
built
2008
1100 West Ave, Miami Beach, FL 33139
$-78
Cash flow
-1.2%
Cash-on-Cash Return
6.0%
Cap rate
0.9%
Rent to Value Ratio
Active
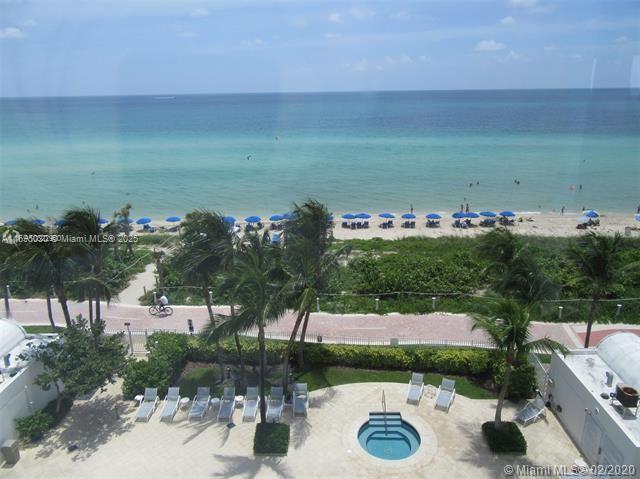
$295,000
1
bds
|
2
ba
|
910
sqft
|
built
1968
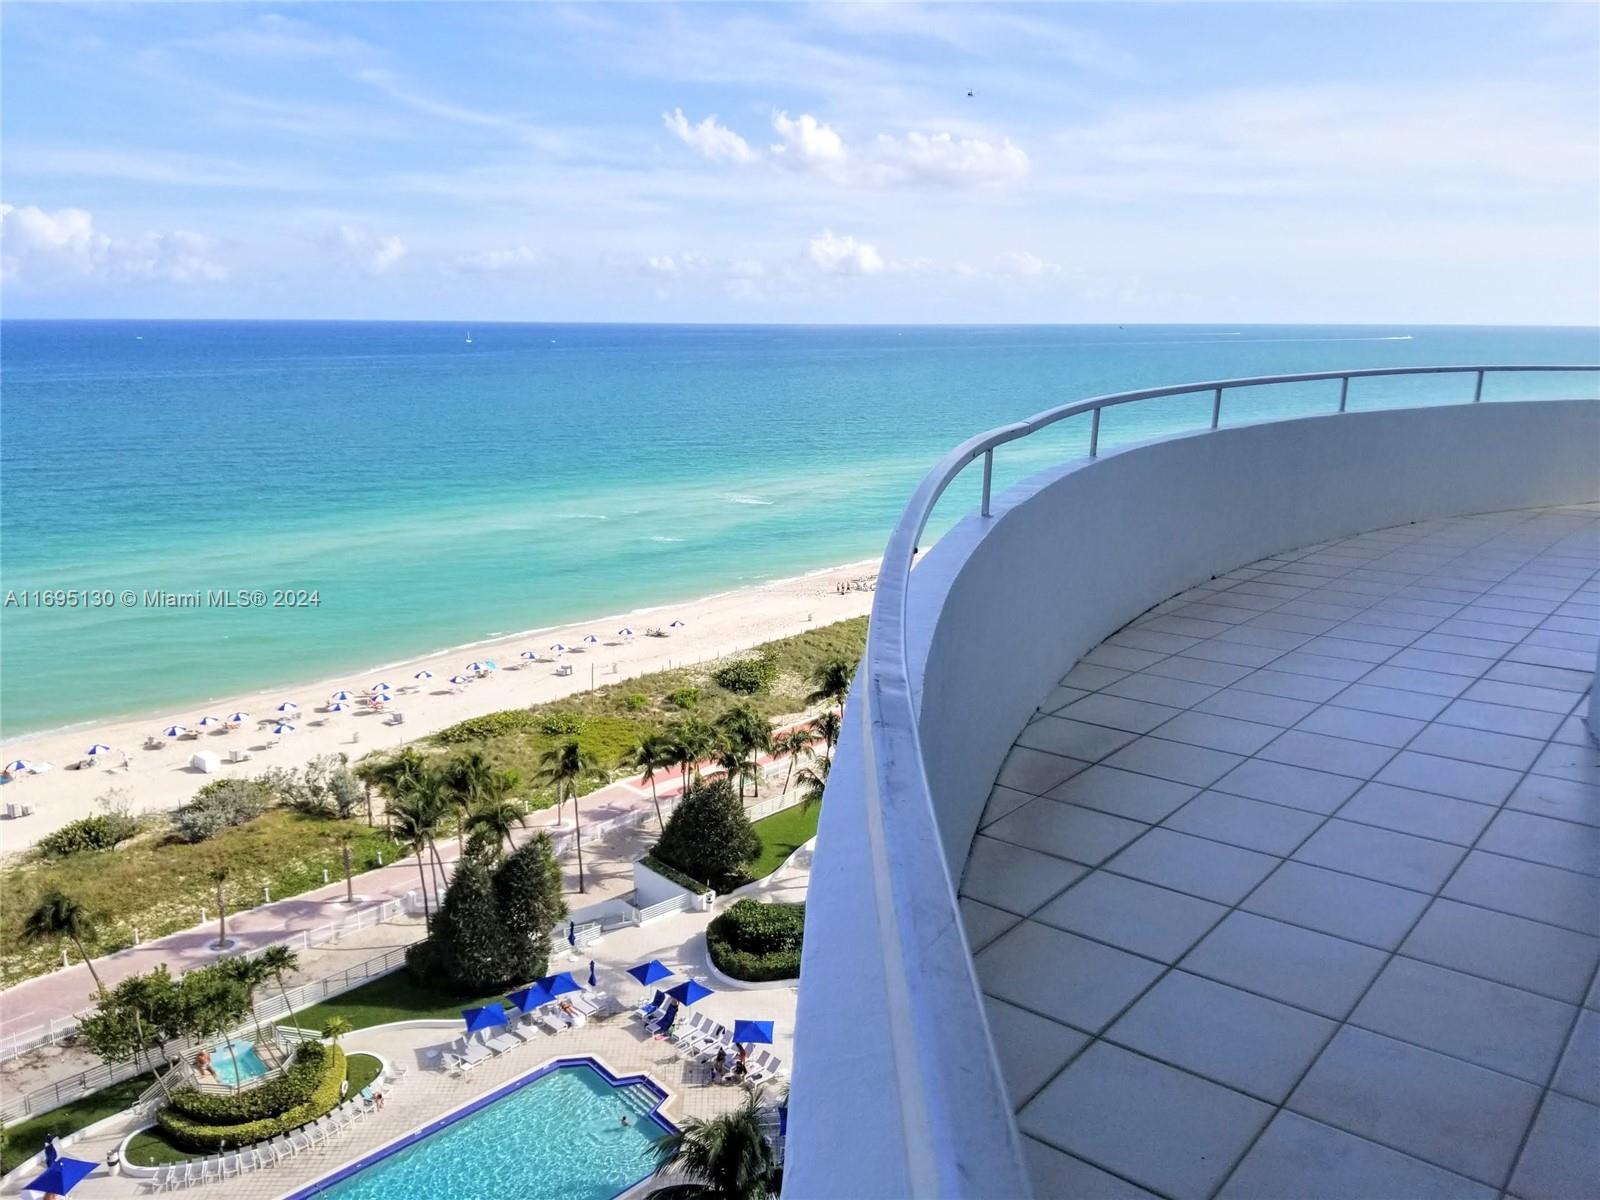
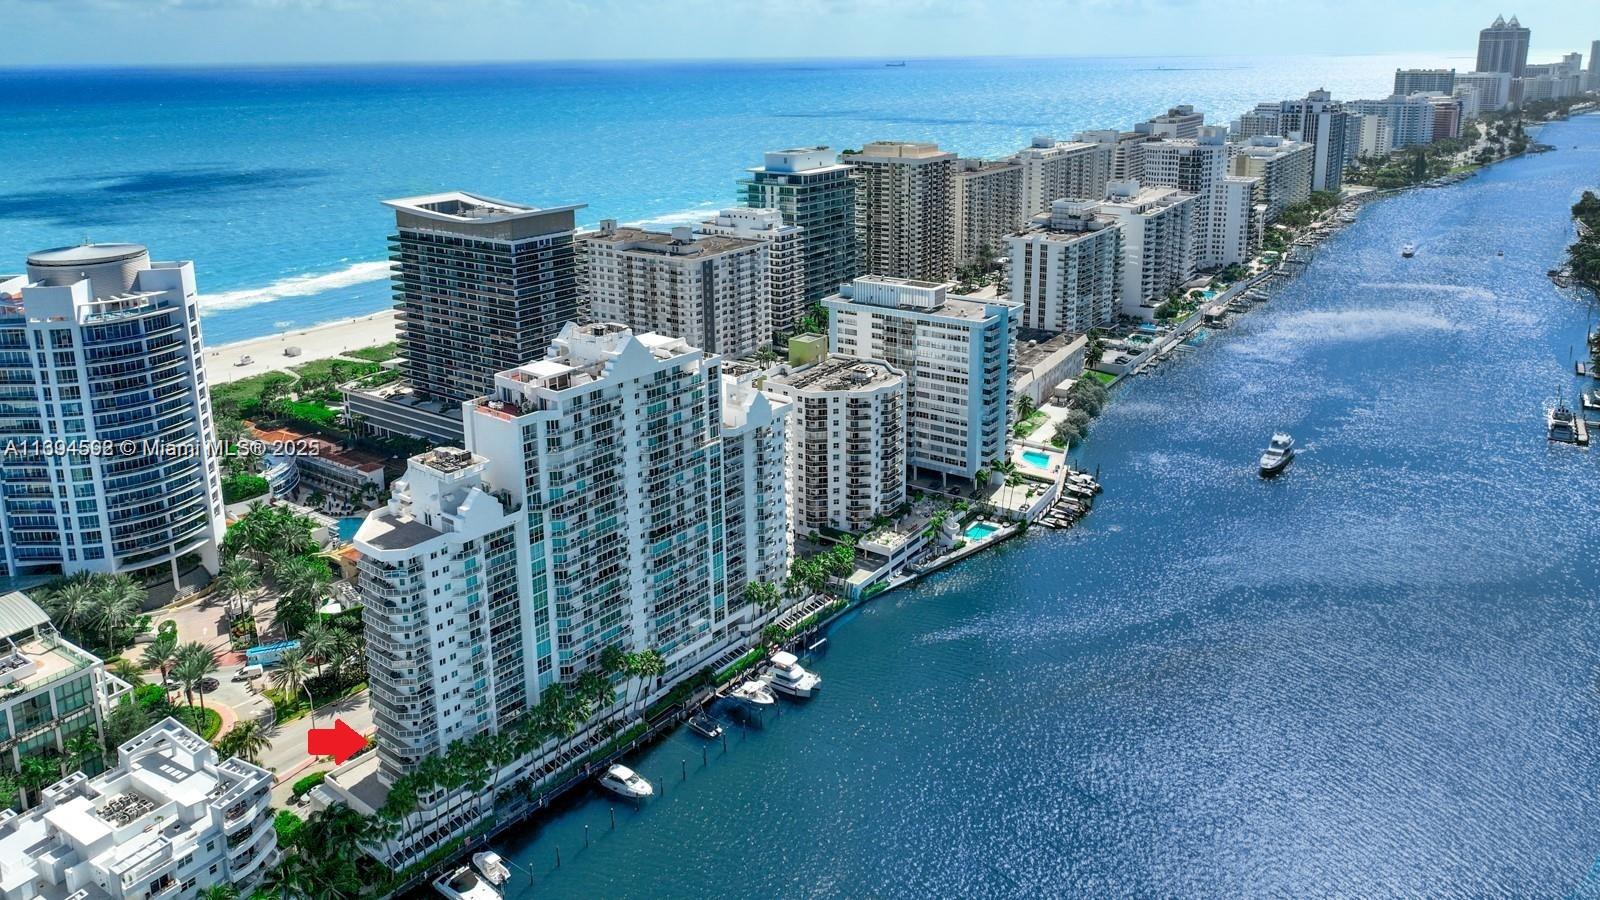
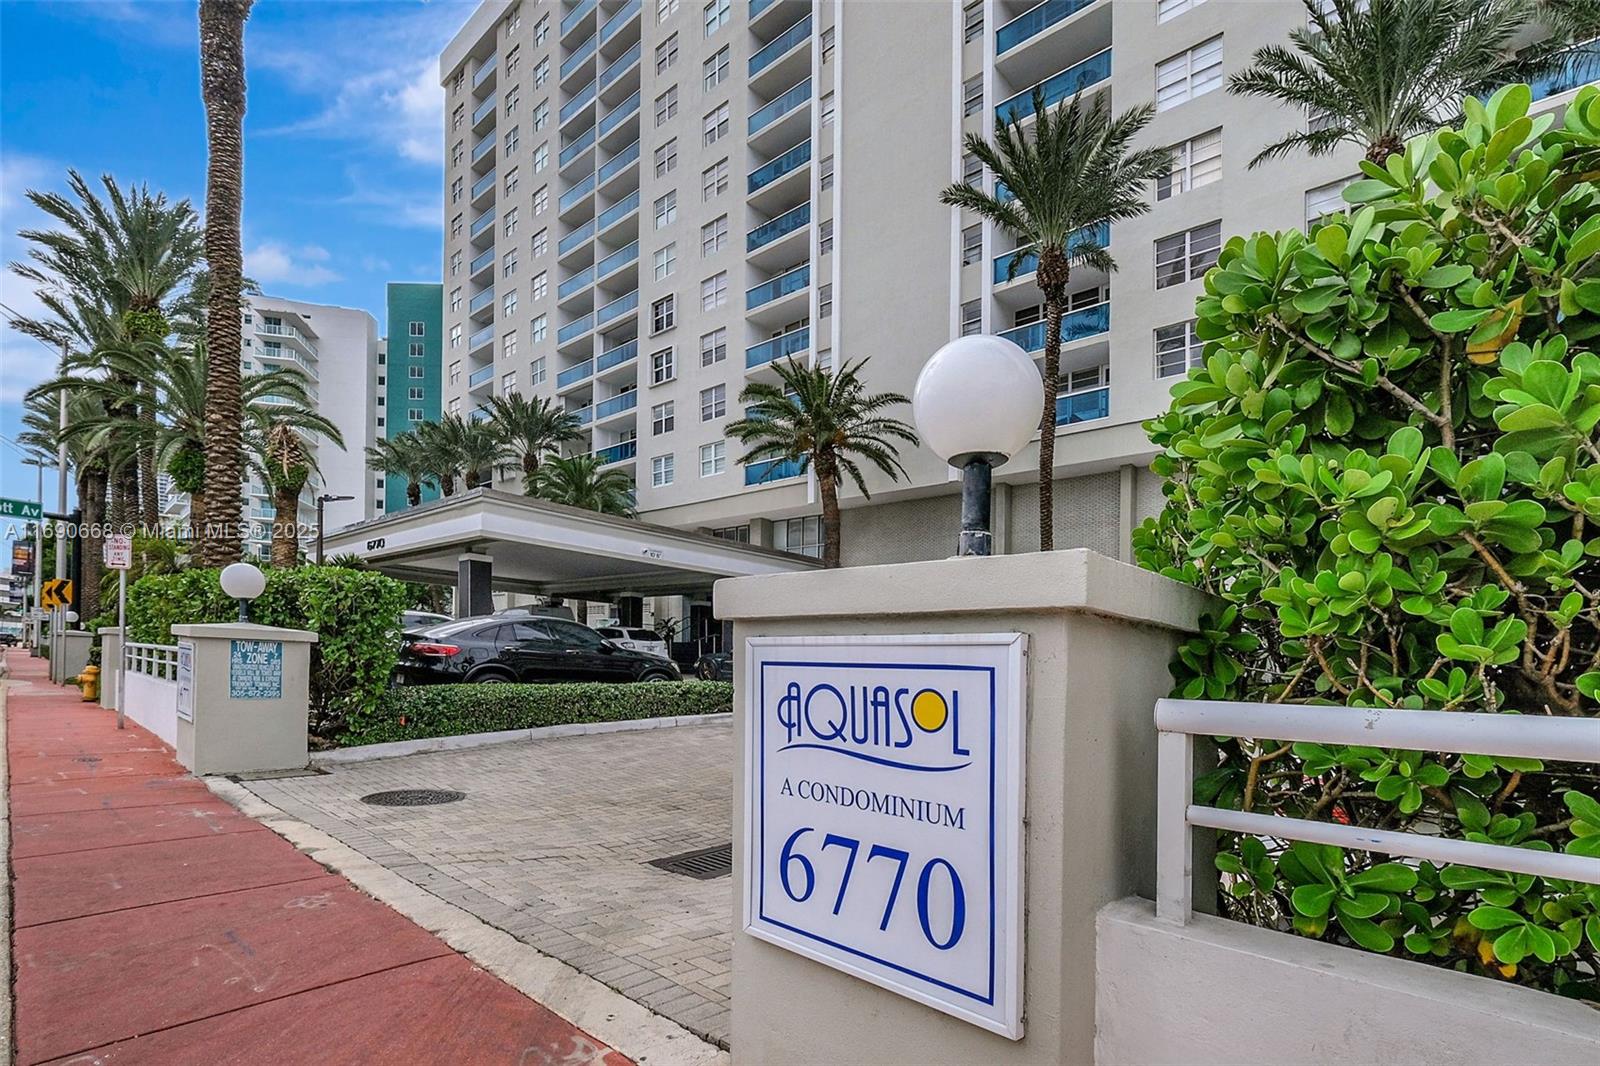
6770 Indian Creek Dr, Miami Beach, FL 33141
$-902
Cash flow
-16.0%
Cash-on-Cash Return
2.6%
Cap rate
0.9%
Rent to Value Ratio

Active
$1,250,000
1
bds
|
1
ba
|
831
sqft
|
built
2008
1491 Lincoln Ter, Miami Beach, FL 33139
$-3,465
Cash flow
-14.5%
Cash-on-Cash Return
3.0%
Cap rate
0.6%
Rent to Value Ratio

Active
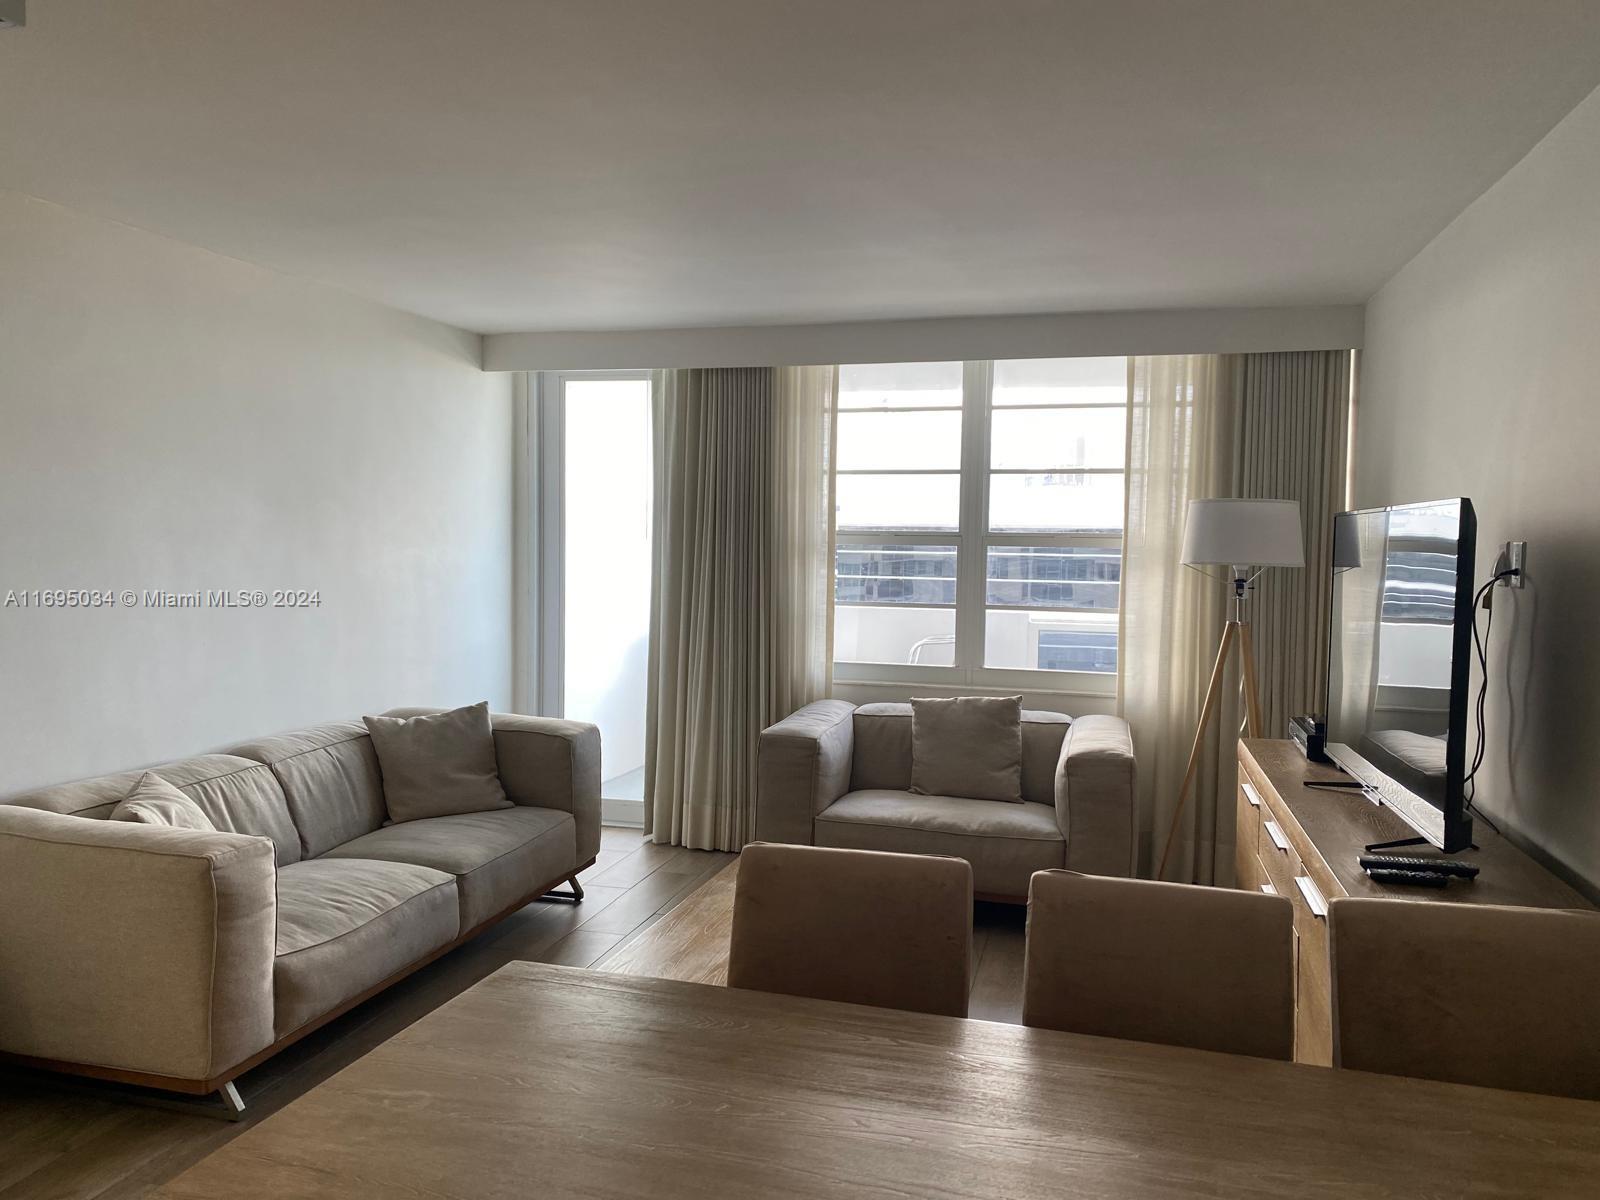
$559,000
2
bds
|
2
ba
|
1,097
sqft
|
built
1964
5005 Collins Ave, Miami Beach, FL 33140
$-2,294
Cash flow
-21.4%
Cash-on-Cash Return
1.4%
Cap rate
0.7%
Rent to Value Ratio
Active
$450,000
1
bds
|
1
ba
|
696
sqft
|
built
2008
1100 West Ave, Miami Beach, FL 33139
$-2,122
Cash flow
-24.6%
Cash-on-Cash Return
0.6%
Cap rate
1.0%
Rent to Value Ratio

Active
$399,000
1
bds
|
1
ba
|
537
sqft
|
built
1937
420 15th St, Miami Beach, FL 33139
$-1,232
Cash flow
-16.1%
Cash-on-Cash Return
2.6%
Cap rate
0.7%
Rent to Value Ratio
Active
$599,999
1
bds
|
1
ba
|
662
sqft
|
built
2008
6801 Collins Ave, Miami Beach, FL 33141
$-197
Cash flow
-1.7%
Cash-on-Cash Return
5.9%
Cap rate
0.8%
Rent to Value Ratio
Active
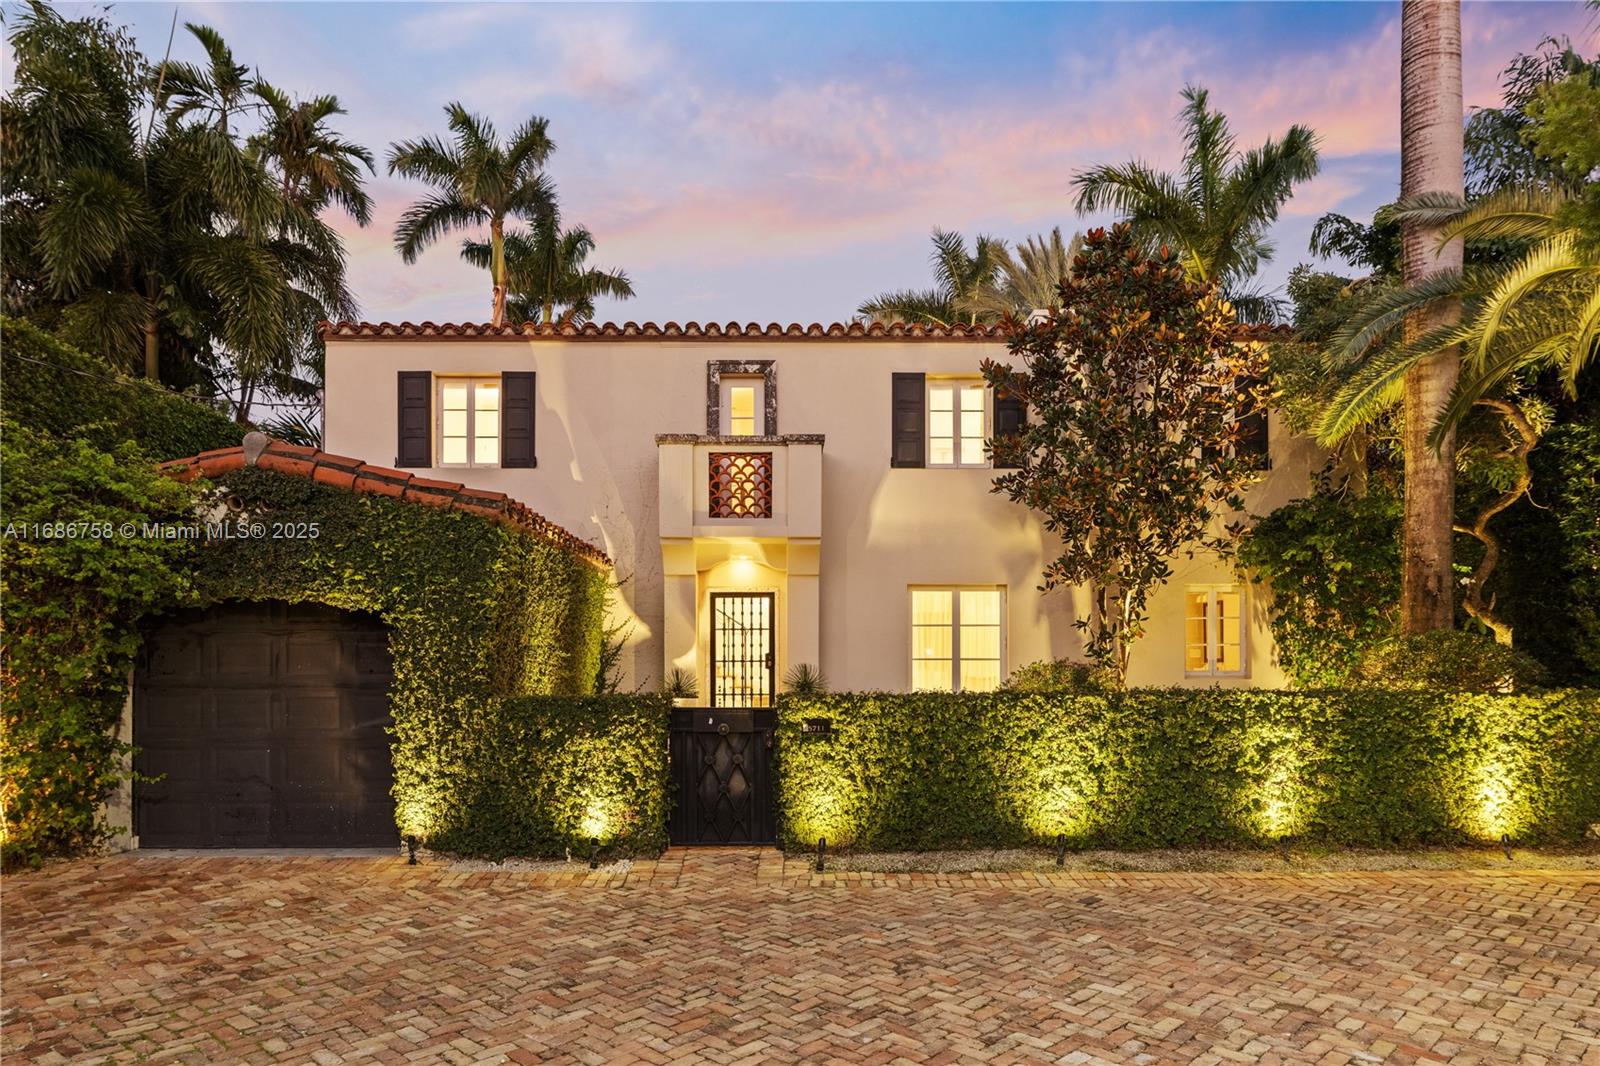
$5,700,000
4
bds
|
4
ba
|
3,100
sqft
|
built
2005
5711 N Bay Rd, Miami Beach, FL 33140
$-26,976
Cash flow
-24.7%
Cash-on-Cash Return
0.6%
Cap rate
0.2%
Rent to Value Ratio
Active
$420,000
2
bds
|
2
ba
|
720
sqft
|
built
1937
1460 Ocean Dr, Miami Beach, FL 33139
$-1,500
Cash flow
-18.6%
Cash-on-Cash Return
2.0%
Cap rate
0.8%
Rent to Value Ratio
Active
$262,500
1
bds
|
1
ba
|
560
sqft
|
built
1925
1614 Pennsylvania Ave, Miami Beach, FL 33139
$-504
Cash flow
-10.0%
Cash-on-Cash Return
4.0%
Cap rate
1.0%
Rent to Value Ratio
Active
$7,599,000
4
bds
|
4
ba
|
3,410
sqft
|
built
2016
3651 Collins Ave, Miami Beach, FL 33140
$-53,980
Cash flow
-37.1%
Cash-on-Cash Return
-2.2%
Cap rate
0.1%
Rent to Value Ratio
Active
$269,000
1
bds
|
1
ba
|
418
sqft
|
built
1967
524 Washington Ave, Miami Beach, FL 33139
$-172
Cash flow
-3.3%
Cash-on-Cash Return
5.5%
Cap rate
0.9%
Rent to Value Ratio
Active
$425,000
1
bds
|
2
ba
|
675
sqft
|
built
1965
1390 Ocean Dr, Miami Beach, FL 33139
$-1,588
Cash flow
-19.5%
Cash-on-Cash Return
1.8%
Cap rate
0.7%
Rent to Value Ratio
Active
$12,900,000
3
bds
|
5
ba
|
2,508
sqft
|
built
2002
100 S Pointe Dr, Miami Beach, FL 33139
$-73,620
Cash flow
-29.8%
Cash-on-Cash Return
-0.6%
Cap rate
0.1%
Rent to Value Ratio
Active
$395,000
2
bds
|
2
ba
|
1,100
sqft
|
built
1964
7441 Wayne Ave, Miami Beach, FL 33141
$-1,186
Cash flow
-15.7%
Cash-on-Cash Return
2.7%
Cap rate
0.8%
Rent to Value Ratio
Active
$1,749,500
2
bds
|
2
ba
|
1,437
sqft
|
built
2003
400 Alton Rd, Miami Beach, FL 33139
$-6,497
Cash flow
-19.4%
Cash-on-Cash Return
1.8%
Cap rate
0.5%
Rent to Value Ratio
Active
$230,000
bds
|
1
ba
|
590
sqft
|
built
1925
1200 Euclid Ave, Miami Beach, FL 33139
$-879
Cash flow
-19.9%
Cash-on-Cash Return
1.7%
Cap rate
0.7%
Rent to Value Ratio
Active
$1,999,999
3
bds
|
2
ba
|
1,795
sqft
|
built
1938
4455 Alton Rd, Miami Beach, FL 33140
$-5,935
Cash flow
-15.5%
Cash-on-Cash Return
2.7%
Cap rate
0.5%
Rent to Value Ratio
Active
$7,795,000
4
bds
|
6
ba
|
3,440
sqft
|
built
2016
1 Collins Ave, Miami Beach, FL 33139
$-49,074
Cash flow
-32.8%
Cash-on-Cash Return
-1.3%
Cap rate
0.1%
Rent to Value Ratio
Active
$874,000
bds
|
1
ba
|
521
sqft
|
built
2008
4391 Collins Ave, Miami Beach, FL 33140
$-3,303
Cash flow
-19.7%
Cash-on-Cash Return
1.7%
Cap rate
0.5%
Rent to Value Ratio
Active
$359,000
2
bds
|
2
ba
|
790
sqft
|
built
1994
610 8th St, Miami Beach, FL 33139
$-1,121
Cash flow
-16.3%
Cash-on-Cash Return
2.5%
Cap rate
0.8%
Rent to Value Ratio
Active
$1,350,000
1
bds
|
2
ba
|
1,066
sqft
|
built
2005
4401 Collins Ave, Miami Beach, FL 33140
$-5,785
Cash flow
-22.4%
Cash-on-Cash Return
1.1%
Cap rate
0.5%
Rent to Value Ratio