Miami Beach, FL Investment Properties for Sale
Browse homes for sale and investment properties in Miami Beach, FL. Refine your search by price, property type, or more.
Best cash flowing properties in Miami Beach, FL
Active
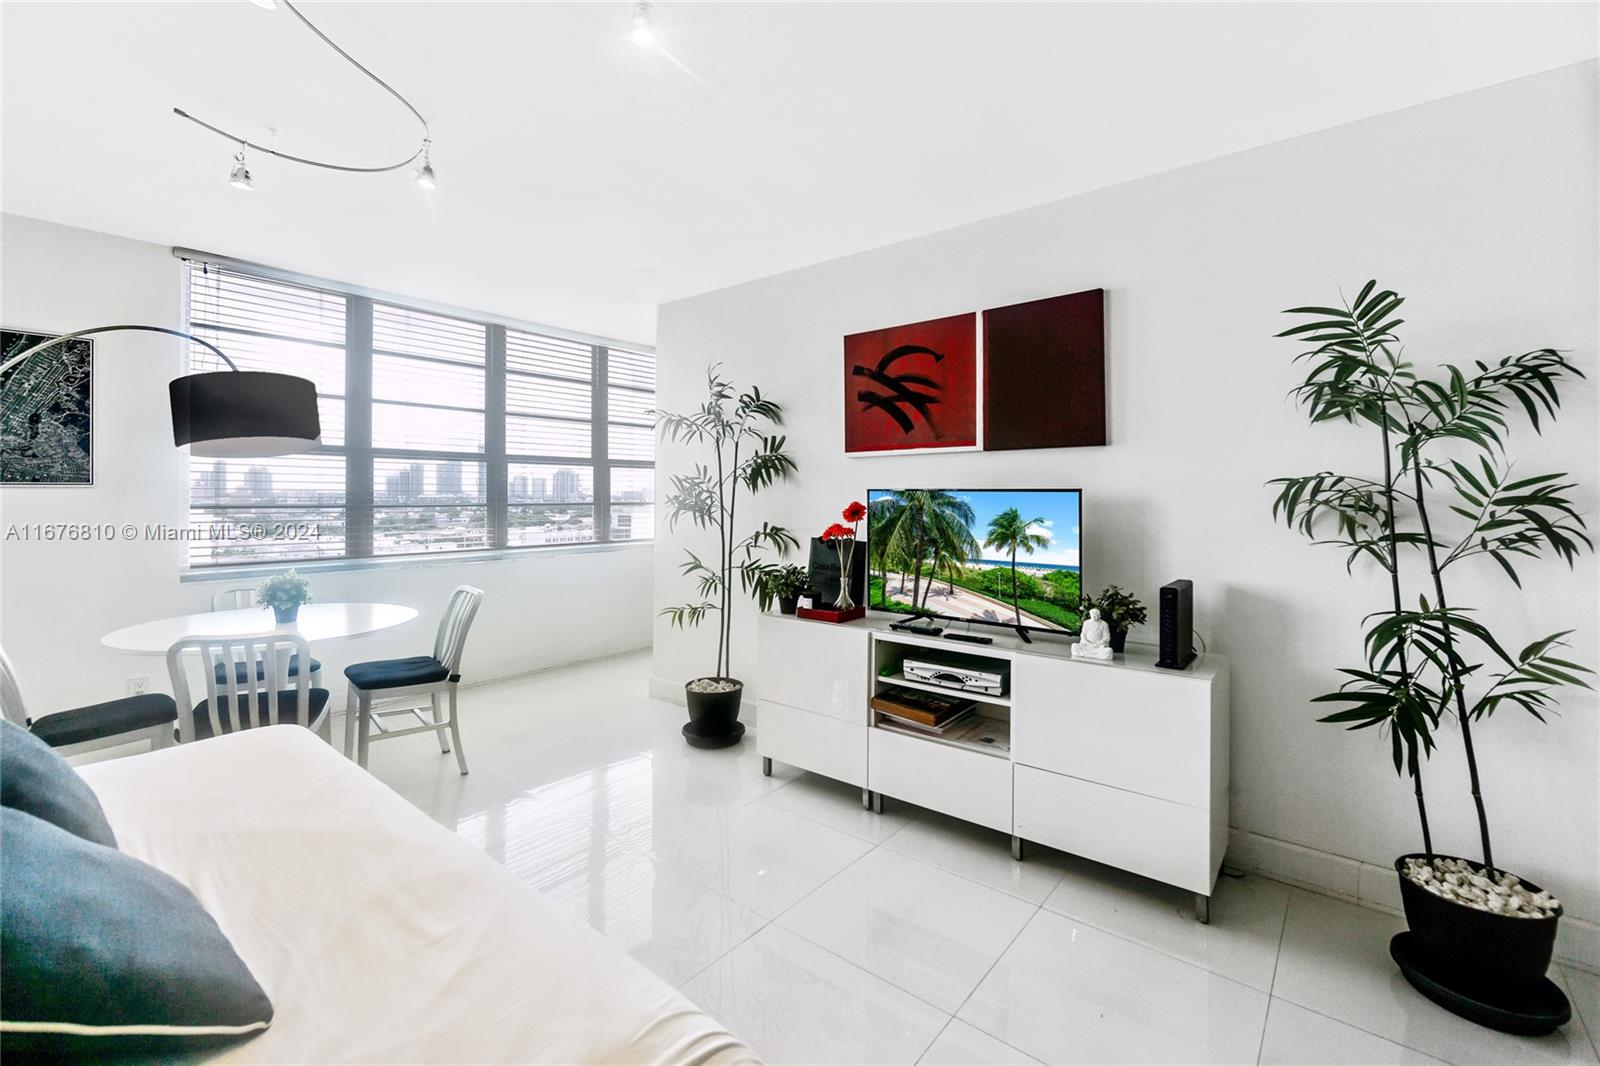
$369,000
1
bds
|
1
ba
|
550
sqft
|
built
1965
100 Lincoln Rd, Miami Beach, FL 33139
$-640
Cash flow
-9.0%
Cash-on-Cash Return
4.2%
Cap rate
1.0%
Rent to Value Ratio
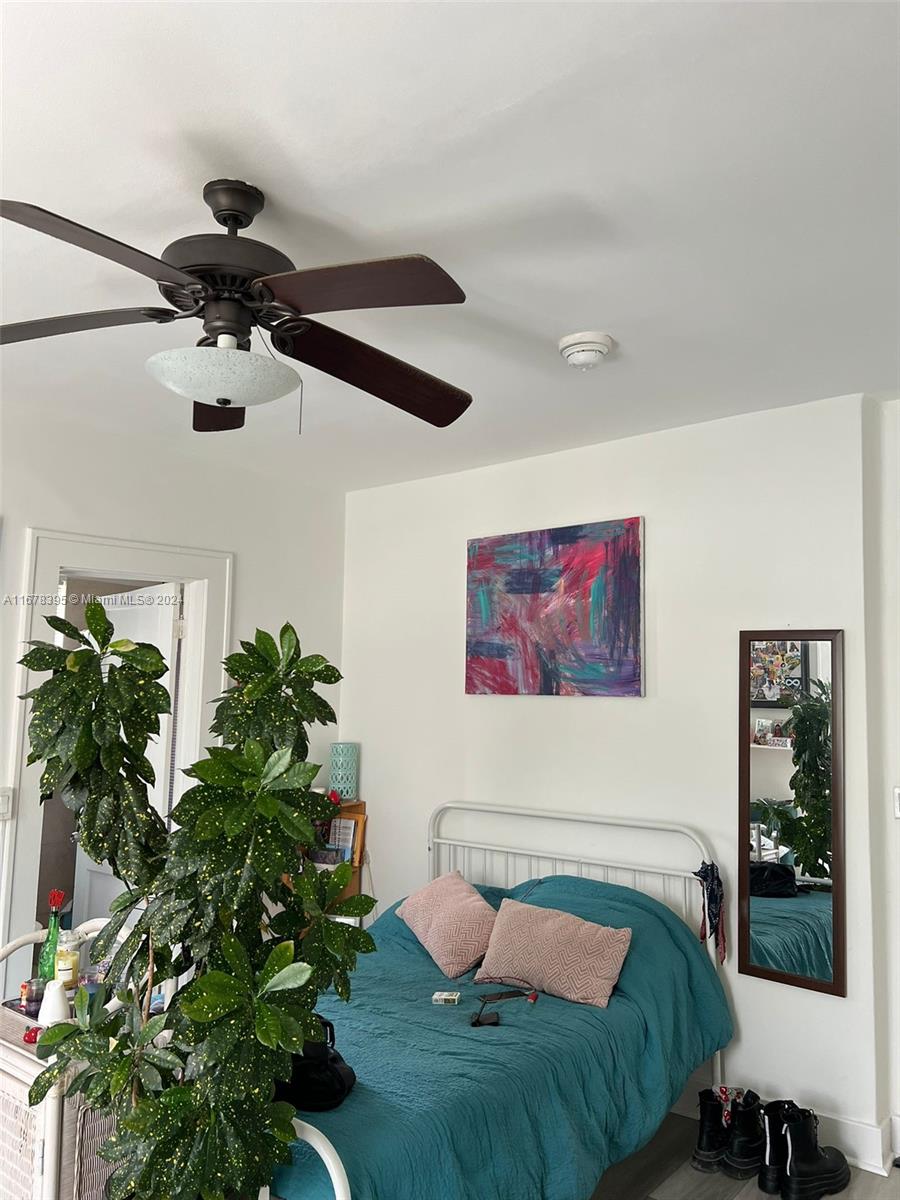
Active
$180,000
bds
|
1
ba
|
330
sqft
|
built
1925
642 Michigan Ave, Miami Beach, FL 33139
$-683
Cash flow
-19.8%
Cash-on-Cash Return
1.7%
Cap rate
0.9%
Rent to Value Ratio
1,968 out of 2,170 properties for sale in Miami Beach, FL
Limited Results Shown
Create a free account, or log in to reveal all property listings and enjoy the complete experience.
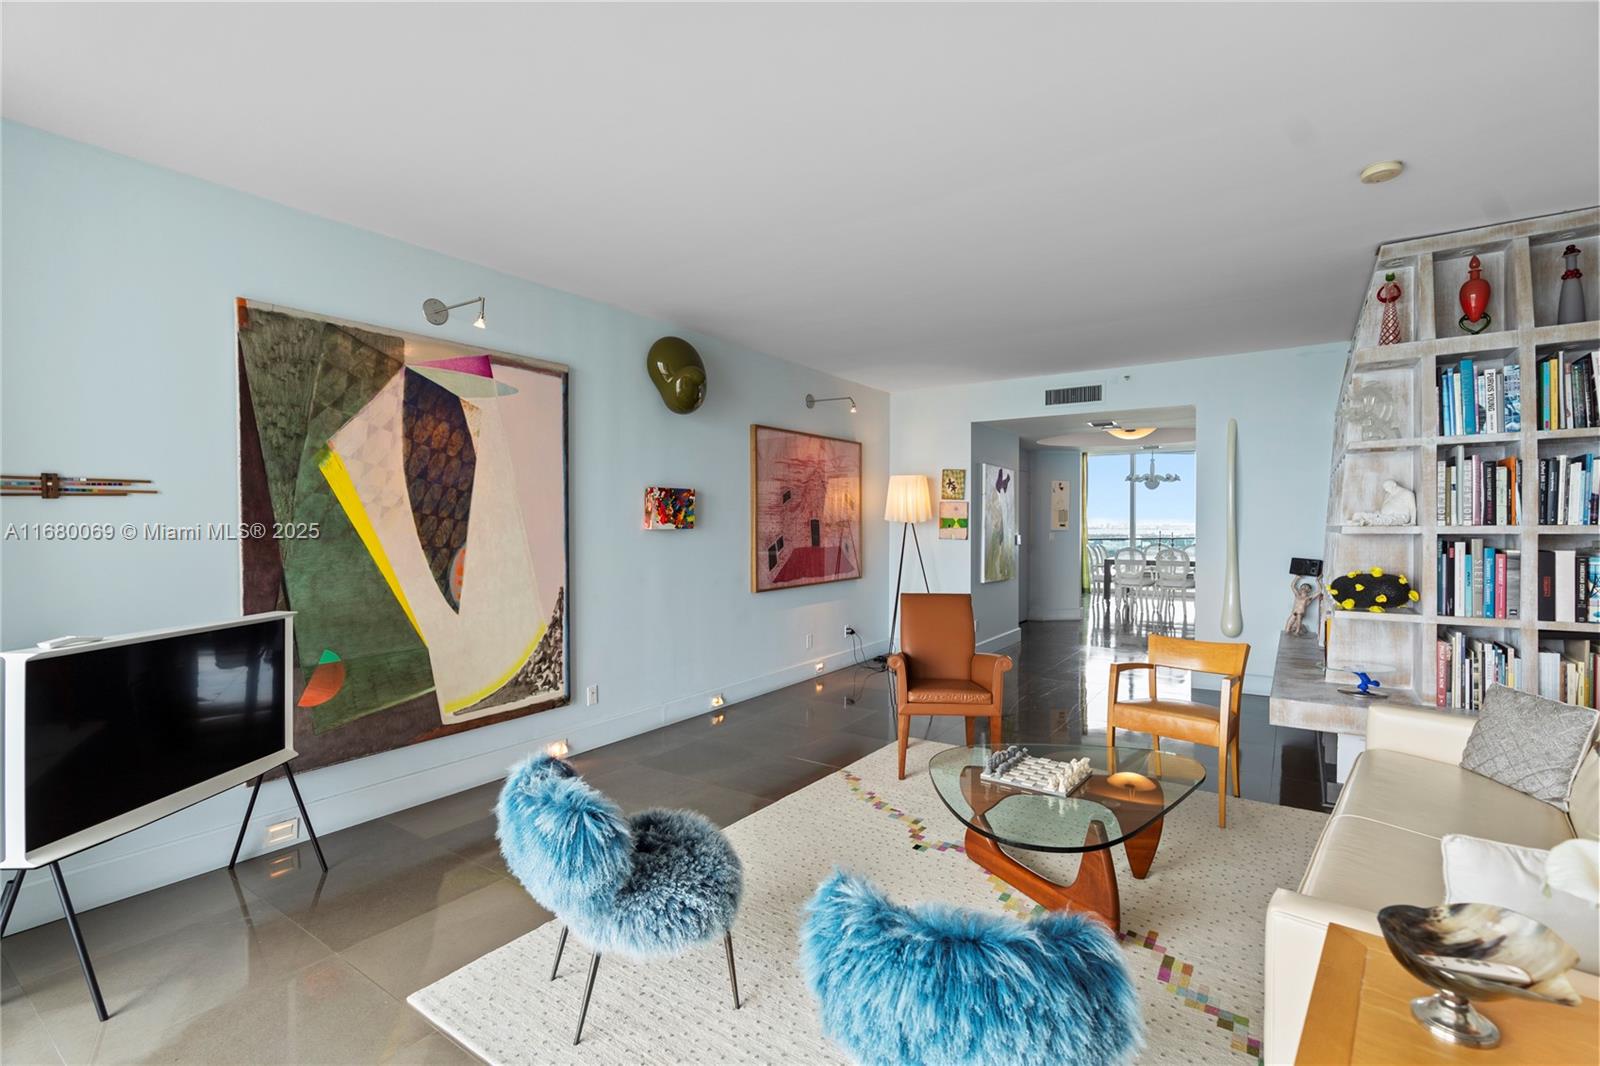
Active
$2,650,000
2
bds
|
3
ba
|
1,960
sqft
|
built
1996
300 S Pointe Dr, Miami Beach, FL 33139
$-13,604
Cash flow
-26.8%
Cash-on-Cash Return
0.1%
Cap rate
0.3%
Rent to Value Ratio
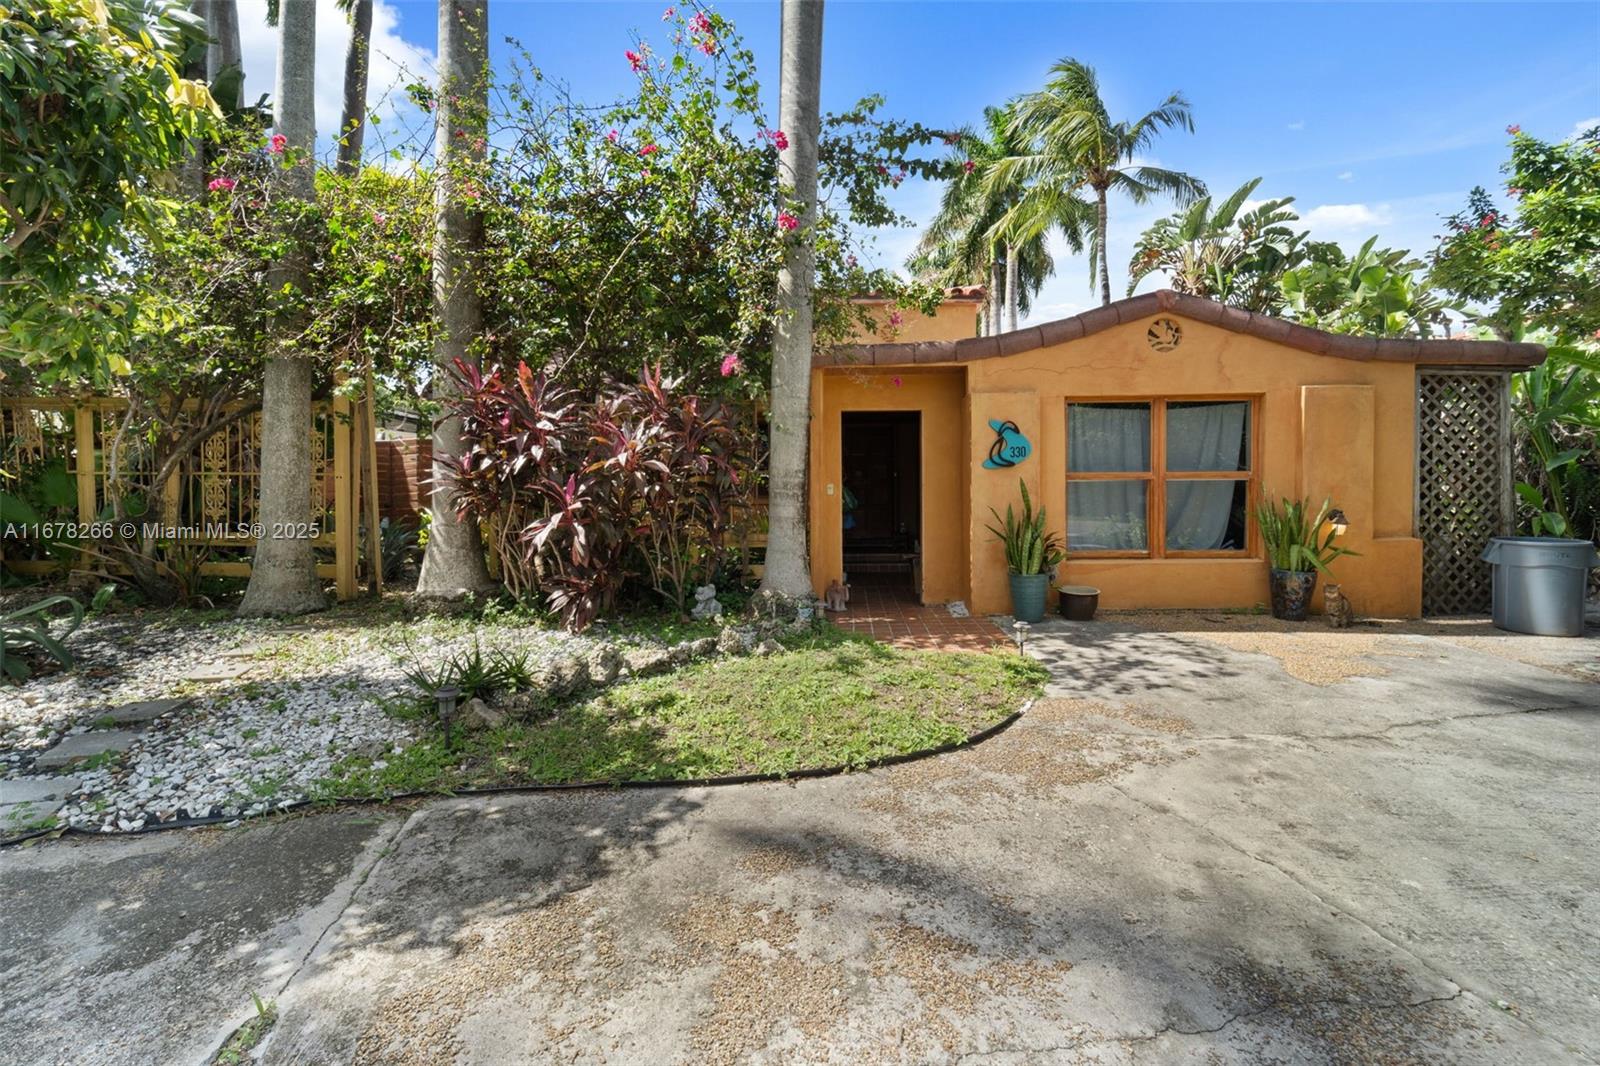
Active
$10,900,000
2
bds
|
3
ba
|
2,005
sqft
|
built
1947
330 W Rivo Alto Dr, Miami Beach, FL 33139
$-53,948
Cash flow
-25.8%
Cash-on-Cash Return
0.3%
Cap rate
0.1%
Rent to Value Ratio

Active
$699,750
2
bds
|
2
ba
|
1,187
sqft
|
built
1968
1000 West Ave, Miami Beach, FL 33139
$-1,925
Cash flow
-14.4%
Cash-on-Cash Return
3.0%
Cap rate
0.8%
Rent to Value Ratio

Active
$329,999
bds
|
1
ba
|
543
sqft
|
built
1968
1000 West Ave, Miami Beach, FL 33139
$-765
Cash flow
-12.1%
Cash-on-Cash Return
3.5%
Cap rate
0.8%
Rent to Value Ratio
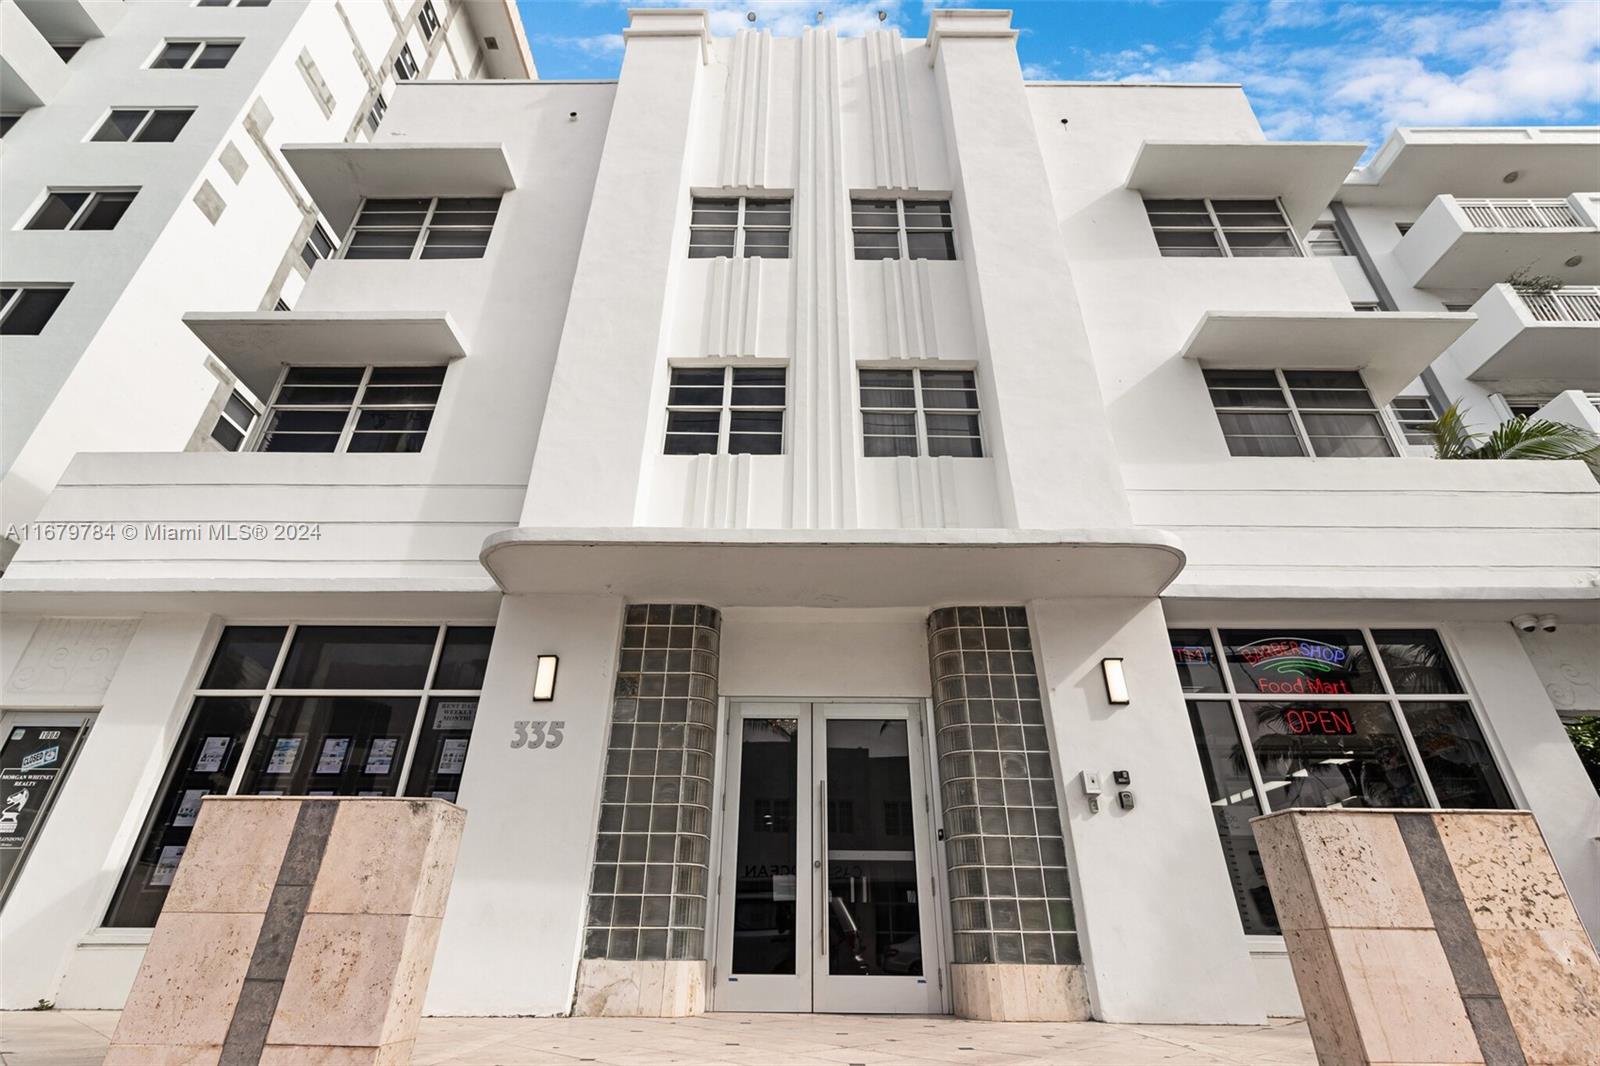
Active
$308,000
bds
|
1
ba
|
200
sqft
|
built
1939
335 Ocean Dr, Miami Beach, FL 33139
$-997
Cash flow
-16.9%
Cash-on-Cash Return
2.4%
Cap rate
0.6%
Rent to Value Ratio

Active
$358,000
bds
|
1
ba
|
466
sqft
|
built
2008
1100 West Ave, Miami Beach, FL 33139
$-1,480
Cash flow
-21.6%
Cash-on-Cash Return
1.3%
Cap rate
0.9%
Rent to Value Ratio
Active
$384,000
1
bds
|
1
ba
|
509
sqft
|
built
2006
1512 Washington Ave, Miami Beach, FL 33139
$-981
Cash flow
-13.3%
Cash-on-Cash Return
3.2%
Cap rate
0.7%
Rent to Value Ratio
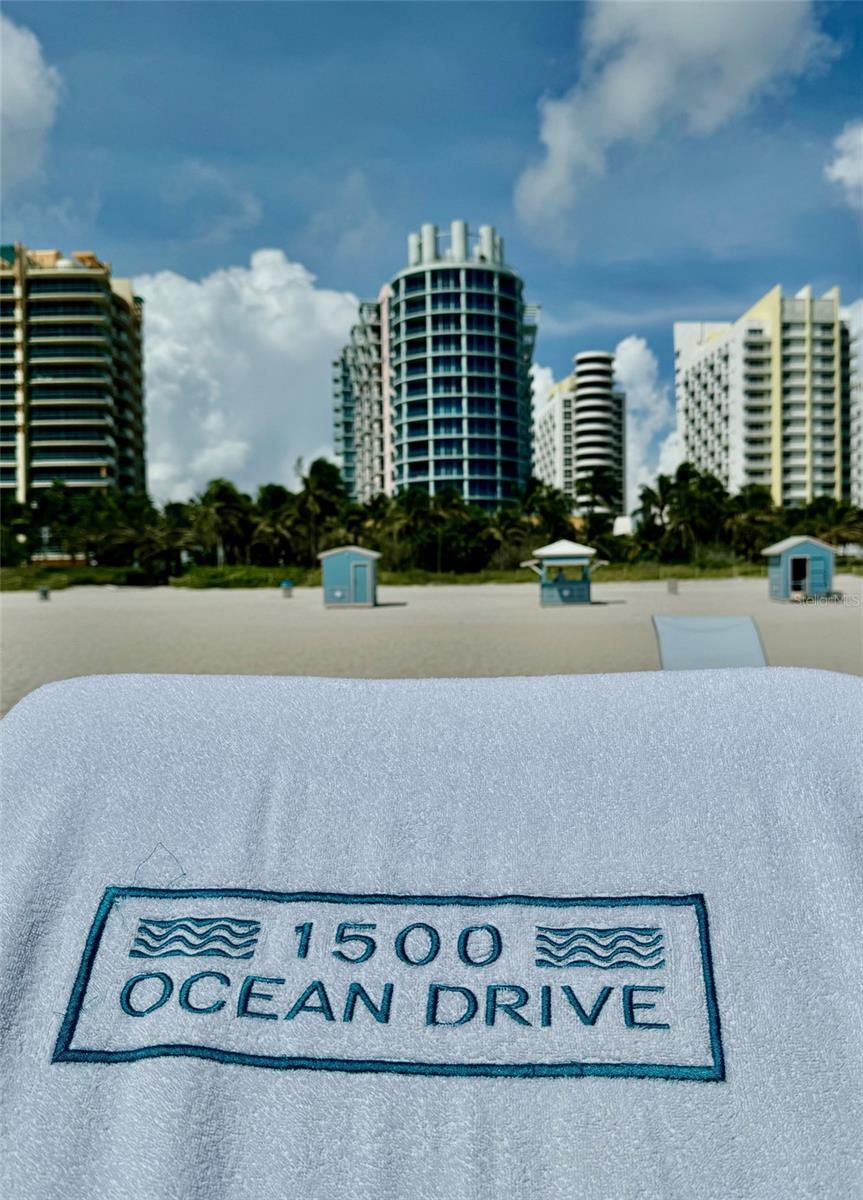
Active
$1,150,000
1
bds
|
2
ba
|
940
sqft
|
built
1998
1500 Ocean Dr, Miami Beach, FL 33139
$-3,105
Cash flow
-14.1%
Cash-on-Cash Return
3.0%
Cap rate
0.5%
Rent to Value Ratio
Active
$384,000
1
bds
|
1
ba
|
509
sqft
|
built
2006
1512 Washington Ave, Miami Beach, FL 33139
$-912
Cash flow
-12.4%
Cash-on-Cash Return
3.4%
Cap rate
0.7%
Rent to Value Ratio
Active
$414,000
1
bds
|
1
ba
|
567
sqft
|
built
2006
1512 Washington Ave, Miami Beach, FL 33139
$-1,009
Cash flow
-12.7%
Cash-on-Cash Return
3.4%
Cap rate
0.7%
Rent to Value Ratio
Active
$414,000
1
bds
|
1
ba
|
600
sqft
|
built
2006
1512 Washington Ave, Miami Beach, FL 33139
$-1,026
Cash flow
-12.9%
Cash-on-Cash Return
3.3%
Cap rate
0.7%
Rent to Value Ratio
Active
$799,999
1
bds
|
1
ba
|
580
sqft
|
built
1966
5445 Collins Ave, Miami Beach, FL 33140
$-3,732
Cash flow
-24.3%
Cash-on-Cash Return
0.7%
Cap rate
0.4%
Rent to Value Ratio
Active
$180,000
bds
|
1
ba
|
330
sqft
|
built
1925
642 Michigan Ave, Miami Beach, FL 33139
$-683
Cash flow
-19.8%
Cash-on-Cash Return
1.7%
Cap rate
0.9%
Rent to Value Ratio
Active
$399,000
bds
|
1
ba
|
530
sqft
|
built
1965
100 Lincoln Rd, Miami Beach, FL 33139
$-1,583
Cash flow
-20.7%
Cash-on-Cash Return
1.5%
Cap rate
0.6%
Rent to Value Ratio
Active
$293,000
bds
|
1
ba
|
552
sqft
|
built
1965
1200 West Ave, Miami Beach, FL 33139
$-979
Cash flow
-17.4%
Cash-on-Cash Return
2.3%
Cap rate
0.8%
Rent to Value Ratio
Active
$1,279,000
1
bds
|
1
ba
|
1,066
sqft
|
built
2005
4401 Collins Ave, Miami Beach, FL 33140
$-4,331
Cash flow
-17.7%
Cash-on-Cash Return
2.2%
Cap rate
0.6%
Rent to Value Ratio

Active
$1,399,000
2
bds
|
2
ba
|
1,080
sqft
|
built
1999
90 Alton Rd, Miami Beach, FL 33139
$-4,153
Cash flow
-15.5%
Cash-on-Cash Return
2.7%
Cap rate
0.4%
Rent to Value Ratio

Active
$1,249,000
2
bds
|
2
ba
|
1,035
sqft
|
built
2008
6799 Collins Ave, Miami Beach, FL 33141
$-2,266
Cash flow
-9.5%
Cash-on-Cash Return
4.1%
Cap rate
0.6%
Rent to Value Ratio
Active
$369,000
1
bds
|
1
ba
|
550
sqft
|
built
1965
100 Lincoln Rd, Miami Beach, FL 33139
$-640
Cash flow
-9.0%
Cash-on-Cash Return
4.2%
Cap rate
1.0%
Rent to Value Ratio

Active
$549,000
1
bds
|
1
ba
|
672
sqft
|
built
1965
1732 Meridian Ave, Miami Beach, FL 33139
$-1,478
Cash flow
-14.0%
Cash-on-Cash Return
3.1%
Cap rate
0.6%
Rent to Value Ratio

Active
$2,180,000
3
bds
|
3
ba
|
1,559
sqft
|
built
1987
400 S Pointe Dr, Miami Beach, FL 33139
$-9,852
Cash flow
-23.6%
Cash-on-Cash Return
0.9%
Cap rate
0.5%
Rent to Value Ratio
Active
$5,995,000
5
bds
|
5
ba
|
4,084
sqft
|
built
1947
5735 N Bay Rd, Miami Beach, FL 33140
$-32,393
Cash flow
-28.2%
Cash-on-Cash Return
-0.2%
Cap rate
0.2%
Rent to Value Ratio
Active
$360,000
2
bds
|
1
ba
|
635
sqft
|
built
1941
811 Jefferson Ave, Miami Beach, FL 33139
$-1,376
Cash flow
-19.9%
Cash-on-Cash Return
1.7%
Cap rate
0.7%
Rent to Value Ratio

Active
$615,000
2
bds
|
2
ba
|
958
sqft
|
built
2016
6620 Indian Creek Dr, Miami Beach, FL 33141
$-2,140
Cash flow
-18.2%
Cash-on-Cash Return
2.1%
Cap rate
0.7%
Rent to Value Ratio
Active
$699,000
2
bds
|
2
ba
|
1,030
sqft
|
built
1966
5161 Collins Ave, Miami Beach, FL 33140
$-1,893
Cash flow
-14.1%
Cash-on-Cash Return
3.0%
Cap rate
0.7%
Rent to Value Ratio
Active
$1,649,000
2
bds
|
2
ba
|
1,147
sqft
|
built
1997
650 West Ave, Miami Beach, FL 33139
$-7,363
Cash flow
-23.3%
Cash-on-Cash Return
0.9%
Cap rate
0.4%
Rent to Value Ratio

Active
$2,425,000
3
bds
|
2
ba
|
0
sqft
|
built
1947
1443 Lenox Ave, Miami Beach, FL 33139
$-8,509
Cash flow
-18.3%
Cash-on-Cash Return
2.1%
Cap rate
0.4%
Rent to Value Ratio
Active
$849,000
2
bds
|
2
ba
|
1,288
sqft
|
built
2011
2155 Washington Ct, Miami Beach, FL 33139
$-2,906
Cash flow
-17.9%
Cash-on-Cash Return
2.2%
Cap rate
0.8%
Rent to Value Ratio

Active
$539,900
2
bds
|
2
ba
|
960
sqft
|
built
1962
5225 Collins Ave, Miami Beach, FL 33140
$-2,250
Cash flow
-21.7%
Cash-on-Cash Return
1.3%
Cap rate
0.8%
Rent to Value Ratio

Active
$475,000
1
bds
|
2
ba
|
775
sqft
|
built
1966
2899 Collins Ave, Miami Beach, FL 33140
$-1,326
Cash flow
-14.6%
Cash-on-Cash Return
2.9%
Cap rate
0.7%
Rent to Value Ratio
Active
$13,900,000
4
bds
|
4
ba
|
4,154
sqft
|
built
2008
800 S Pointe Dr, Miami Beach, FL 33139
$-93,271
Cash flow
-35.0%
Cash-on-Cash Return
-1.8%
Cap rate
0.1%
Rent to Value Ratio
Active
$3,125,000
2
bds
|
3
ba
|
1,550
sqft
|
built
1998
1455 Ocean Dr, Miami Beach, FL 33139
$-16,510
Cash flow
-27.6%
Cash-on-Cash Return
-0.1%
Cap rate
0.3%
Rent to Value Ratio
Active
$860,000
1
bds
|
2
ba
|
808
sqft
|
built
2004
6365 Collins Ave, Miami Beach, FL 33141
$-3,288
Cash flow
-19.9%
Cash-on-Cash Return
1.7%
Cap rate
0.5%
Rent to Value Ratio
Active
$385,000
bds
|
1
ba
|
530
sqft
|
built
2008
1100 West Ave, Miami Beach, FL 33139
$-1,976
Cash flow
-26.8%
Cash-on-Cash Return
0.1%
Cap rate
0.8%
Rent to Value Ratio
Active
$18,999,000
6
bds
|
7
ba
|
6,211
sqft
|
built
2002
176 S Hibiscus Dr, Miami Beach, FL 33139
$-97,229
Cash flow
-26.7%
Cash-on-Cash Return
0.1%
Cap rate
0.0%
Rent to Value Ratio
Active
$2,950,000
4
bds
|
5
ba
|
2,938
sqft
|
built
2016
2382 Alton Rd, Miami Beach, FL 33140
$-9,740
Cash flow
-17.2%
Cash-on-Cash Return
2.3%
Cap rate
0.4%
Rent to Value Ratio

Active
$1,500,000
3
bds
|
3
ba
|
1,558
sqft
|
built
1937
1369 Biarritz Dr, Miami Beach, FL 33141
$-5,207
Cash flow
-18.1%
Cash-on-Cash Return
2.1%
Cap rate
0.4%
Rent to Value Ratio
Active
$2,100,000
2
bds
|
3
ba
|
1,530
sqft
|
built
1998
1500 Ocean Dr, Miami Beach, FL 33139
$-10,304
Cash flow
-25.6%
Cash-on-Cash Return
0.4%
Cap rate
0.4%
Rent to Value Ratio
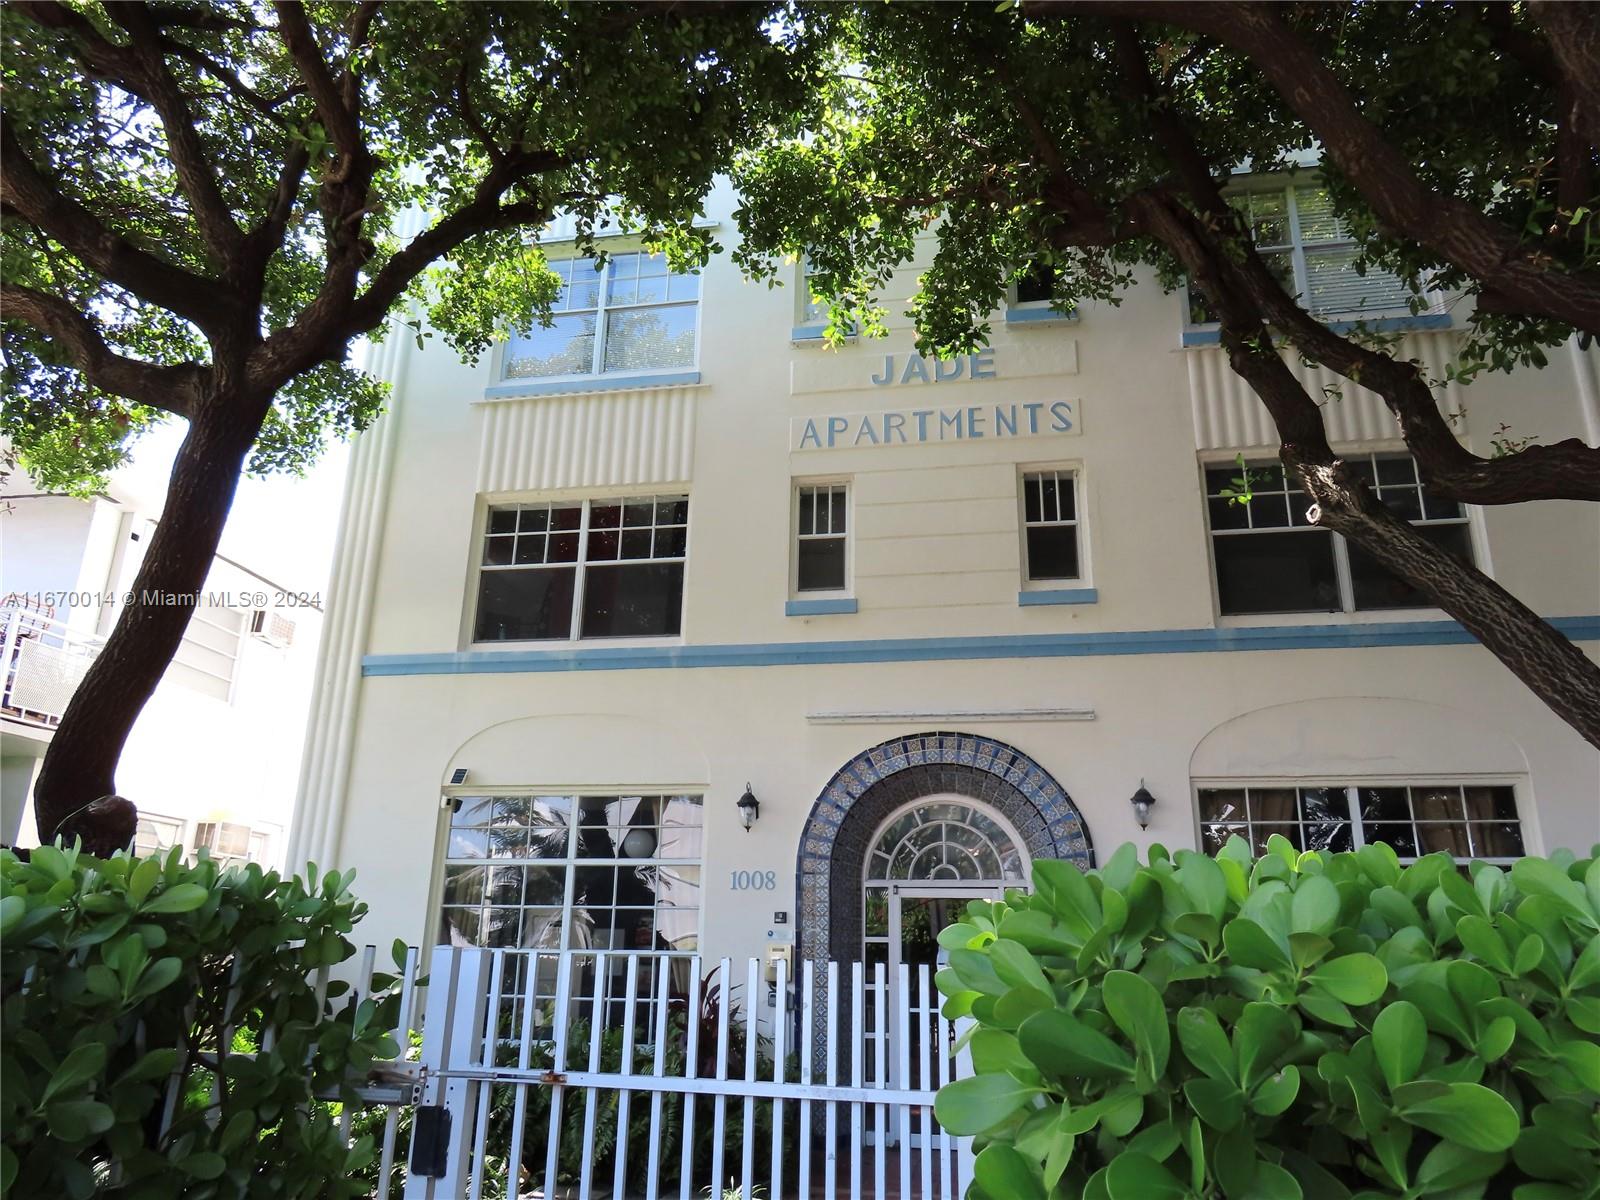
Active
$325,000
2
bds
|
1
ba
|
670
sqft
|
built
1935
1008 Jefferson Ave, Miami Beach, FL 33139
$-889
Cash flow
-14.3%
Cash-on-Cash Return
3.0%
Cap rate
0.8%
Rent to Value Ratio
Active
$12,800,000
4
bds
|
4
ba
|
3,105
sqft
|
built
1952
255 N Hibiscus Dr, Miami Beach, FL 33139
$-63,481
Cash flow
-25.9%
Cash-on-Cash Return
0.3%
Cap rate
0.1%
Rent to Value Ratio