Miami Beach, FL Investment Properties for Sale
Browse homes for sale and investment properties in Miami Beach, FL. Refine your search by price, property type, or more.
Best cash flowing properties in Miami Beach, FL

Active
$349,000
1
bds
|
1
ba
|
650
sqft
|
built
1951
1515 West Ave, Miami Beach, FL 33139
$-592
Cash flow
-8.9%
Cash-on-Cash Return
4.2%
Cap rate
0.8%
Rent to Value Ratio
Active
$262,495
1
bds
|
1
ba
|
420
sqft
|
built
1956
911 Meridian Ave, Miami Beach, FL 33139
$-770
Cash flow
-15.3%
Cash-on-Cash Return
2.8%
Cap rate
0.7%
Rent to Value Ratio
1,968 out of 2,170 properties for sale in Miami Beach, FL
Limited Results Shown
Create a free account, or log in to reveal all property listings and enjoy the complete experience.
Active
$1,000,000
2
bds
|
2
ba
|
1,078
sqft
|
built
1997
650 West Ave, Miami Beach, FL 33139
$-3,413
Cash flow
-17.8%
Cash-on-Cash Return
2.2%
Cap rate
0.6%
Rent to Value Ratio
Active
$38,900,000
6
bds
|
9
ba
|
7,875
sqft
|
built
2005
450 Alton Rd, Miami Beach, FL 33139
$-238,620
Cash flow
-32.0%
Cash-on-Cash Return
-1.1%
Cap rate
0.0%
Rent to Value Ratio
Active
$6,350,000
2
bds
|
3
ba
|
1,595
sqft
|
built
2002
100 S Pointe Dr, Miami Beach, FL 33139
$-36,404
Cash flow
-29.9%
Cash-on-Cash Return
-0.6%
Cap rate
0.1%
Rent to Value Ratio
Active
$320,000
bds
|
0
ba
|
345
sqft
|
built
1948
6345 Collins Ave, Miami Beach, FL 33141
$-1,374
Cash flow
-22.4%
Cash-on-Cash Return
1.1%
Cap rate
0.6%
Rent to Value Ratio
Active
$1,190,000
2
bds
|
2
ba
|
1,030
sqft
|
built
1966
5161 Collins Ave, Miami Beach, FL 33140
$-4,531
Cash flow
-19.9%
Cash-on-Cash Return
1.7%
Cap rate
0.5%
Rent to Value Ratio
Active
$280,000
1
bds
|
1
ba
|
527
sqft
|
built
1936
631 Euclid Ave, Miami Beach, FL 33139
$-794
Cash flow
-14.8%
Cash-on-Cash Return
2.9%
Cap rate
0.8%
Rent to Value Ratio
Active
$605,000
1
bds
|
2
ba
|
856
sqft
|
built
1962
20 Island Ave, Miami Beach, FL 33139
$-2,038
Cash flow
-17.6%
Cash-on-Cash Return
2.2%
Cap rate
0.7%
Rent to Value Ratio
Active
$262,495
1
bds
|
1
ba
|
420
sqft
|
built
1956
911 Meridian Ave, Miami Beach, FL 33139
$-770
Cash flow
-15.3%
Cash-on-Cash Return
2.8%
Cap rate
0.7%
Rent to Value Ratio
Active
$990,000
2
bds
|
2
ba
|
640
sqft
|
built
1966
5445 Collins Ave, Miami Beach, FL 33140
$-3,673
Cash flow
-19.4%
Cash-on-Cash Return
1.8%
Cap rate
0.5%
Rent to Value Ratio

Active
$1,200,000
bds
|
1
ba
|
574
sqft
|
built
2008
4391 Collins Ave, Miami Beach, FL 33140
$-4,711
Cash flow
-20.5%
Cash-on-Cash Return
1.6%
Cap rate
0.4%
Rent to Value Ratio

Active
$649,000
1
bds
|
1
ba
|
654
sqft
|
built
1969
465 Ocean Dr, Miami Beach, FL 33139
$-1,625
Cash flow
-13.1%
Cash-on-Cash Return
3.3%
Cap rate
0.7%
Rent to Value Ratio
Active
$349,000
1
bds
|
1
ba
|
650
sqft
|
built
1951
1515 West Ave, Miami Beach, FL 33139
$-592
Cash flow
-8.9%
Cash-on-Cash Return
4.2%
Cap rate
0.8%
Rent to Value Ratio
Active
$1,039,000
bds
|
1
ba
|
526
sqft
|
built
2005
4401 Collins Ave, Miami Beach, FL 33140
$-3,765
Cash flow
-18.9%
Cash-on-Cash Return
1.9%
Cap rate
0.5%
Rent to Value Ratio
Active
$388,000
1
bds
|
2
ba
|
912
sqft
|
built
1970
7135 Collins Ave, Miami Beach, FL 33141
$-1,186
Cash flow
-15.9%
Cash-on-Cash Return
2.6%
Cap rate
0.8%
Rent to Value Ratio
Active
$1,200,000
bds
|
1
ba
|
544
sqft
|
built
2008
4391 Collins Ave, Miami Beach, FL 33140
$-4,808
Cash flow
-20.9%
Cash-on-Cash Return
1.5%
Cap rate
0.4%
Rent to Value Ratio
Active
$530,000
1
bds
|
1
ba
|
873
sqft
|
built
2008
6801 Collins Ave, Miami Beach, FL 33141
$-3,444
Cash flow
-33.9%
Cash-on-Cash Return
-1.5%
Cap rate
0.8%
Rent to Value Ratio
Active
$350,000
bds
|
2
ba
|
500
sqft
|
built
2006
1437 Collins Ave, Miami Beach, FL 33139
$-2,223
Cash flow
-33.1%
Cash-on-Cash Return
-1.3%
Cap rate
0.8%
Rent to Value Ratio

Active
$579,000
2
bds
|
2
ba
|
880
sqft
|
built
1997
1621 Bay Rd, Miami Beach, FL 33139
$-1,948
Cash flow
-17.6%
Cash-on-Cash Return
2.2%
Cap rate
0.6%
Rent to Value Ratio
Active
$399,000
1
bds
|
1
ba
|
537
sqft
|
built
1937
420 15th St, Miami Beach, FL 33139
$-1,012
Cash flow
-13.2%
Cash-on-Cash Return
3.2%
Cap rate
0.7%
Rent to Value Ratio

Active
$449,950
bds
|
1
ba
|
550
sqft
|
built
1965
100 Lincoln Rd, Miami Beach, FL 33139
$-1,036
Cash flow
-12.0%
Cash-on-Cash Return
3.5%
Cap rate
0.8%
Rent to Value Ratio

Active
$405,000
1
bds
|
1
ba
|
885
sqft
|
built
1953
2250 Bay Dr, Miami Beach, FL 33141
$-1,046
Cash flow
-13.5%
Cash-on-Cash Return
3.2%
Cap rate
0.7%
Rent to Value Ratio
Active
$4,440,000
4
bds
|
3
ba
|
3,080
sqft
|
built
1953
1531 Stillwater Dr, Miami Beach, FL 33141
$-18,805
Cash flow
-22.1%
Cash-on-Cash Return
1.2%
Cap rate
0.2%
Rent to Value Ratio

Active
$698,800
bds
|
1
ba
|
600
sqft
|
built
1926
2301 Collins Ave, Miami Beach, FL 33139
$-2,904
Cash flow
-21.7%
Cash-on-Cash Return
1.3%
Cap rate
0.6%
Rent to Value Ratio
Active
$7,750,000
5
bds
|
7
ba
|
4,524
sqft
|
built
2016
5327 N Bay Rd, Miami Beach, FL 33140
$-43,774
Cash flow
-29.5%
Cash-on-Cash Return
-0.5%
Cap rate
0.1%
Rent to Value Ratio
Active
$345,000
1
bds
|
1
ba
|
490
sqft
|
built
1935
2615 Collins Ave, Miami Beach, FL 33140
$-930
Cash flow
-14.1%
Cash-on-Cash Return
3.1%
Cap rate
0.7%
Rent to Value Ratio
Active
$4,400,000
2
bds
|
2
ba
|
1,569
sqft
|
built
2015
102 24th St, Miami Beach, FL 33139
$-26,804
Cash flow
-31.8%
Cash-on-Cash Return
-1.0%
Cap rate
0.2%
Rent to Value Ratio
Active
$285,000
1
bds
|
1
ba
|
560
sqft
|
built
1925
1614 Pennsylvania Ave, Miami Beach, FL 33139
$-828
Cash flow
-15.2%
Cash-on-Cash Return
2.8%
Cap rate
0.8%
Rent to Value Ratio
Active
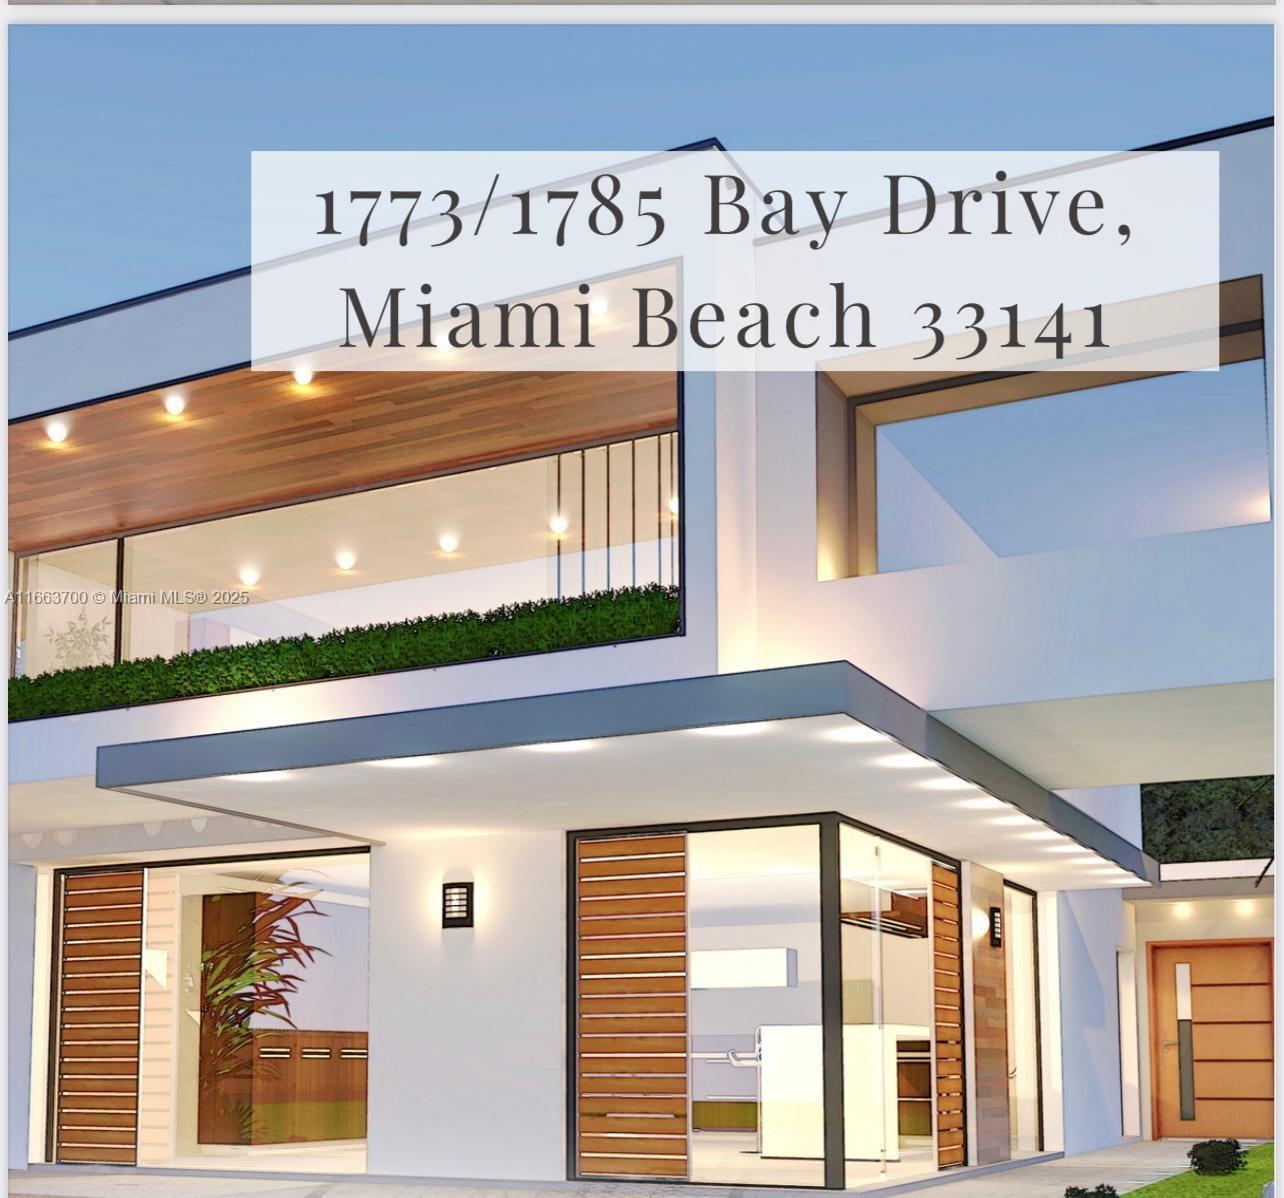
$1,270,000
3
bds
|
2
ba
|
2,261
sqft
|
built
1940
1785 Bay Dr, Miami Beach, FL 33141
$-1,492
Cash flow
-6.1%
Cash-on-Cash Return
4.9%
Cap rate
0.6%
Rent to Value Ratio
Active
$735,000
2
bds
|
2
ba
|
1,030
sqft
|
built
1966
5151 Collins Ave, Miami Beach, FL 33140
$-2,546
Cash flow
-18.1%
Cash-on-Cash Return
2.1%
Cap rate
0.6%
Rent to Value Ratio
Active
$270,000
1
bds
|
1
ba
|
678
sqft
|
built
1963
900 Bay Dr, Miami Beach, FL 33141
$-1,244
Cash flow
-24.0%
Cash-on-Cash Return
0.8%
Cap rate
0.9%
Rent to Value Ratio

Active
$450,000
1
bds
|
2
ba
|
930
sqft
|
built
1968
5601 Collins Ave, Miami Beach, FL 33140
$-1,907
Cash flow
-22.1%
Cash-on-Cash Return
1.2%
Cap rate
0.6%
Rent to Value Ratio

Active
$38,000,000
5
bds
|
7
ba
|
7,890
sqft
|
built
2018
126 W San Marino Dr, Miami Beach, FL 33139
$-213,580
Cash flow
-29.3%
Cash-on-Cash Return
-0.5%
Cap rate
0.0%
Rent to Value Ratio
Active
$6,900,000
4
bds
|
4
ba
|
2,431
sqft
|
built
1953
116 W 1st Ct, Miami Beach, FL 33139
$-33,415
Cash flow
-25.3%
Cash-on-Cash Return
0.5%
Cap rate
0.1%
Rent to Value Ratio
Active
$629,000
2
bds
|
2
ba
|
1,190
sqft
|
built
1967
5600 Collins Ave, Miami Beach, FL 33140
$-2,642
Cash flow
-21.9%
Cash-on-Cash Return
1.2%
Cap rate
0.6%
Rent to Value Ratio

Active
$4,399,000
3
bds
|
4
ba
|
3,096
sqft
|
built
2019
4701 N Meridian Ave, Miami Beach, FL 33140
$-28,407
Cash flow
-33.7%
Cash-on-Cash Return
-1.5%
Cap rate
0.2%
Rent to Value Ratio
Active
$699,000
2
bds
|
2
ba
|
1,034
sqft
|
built
1980
1623 Collins Ave, Miami Beach, FL 33139
$-1,715
Cash flow
-12.8%
Cash-on-Cash Return
3.3%
Cap rate
0.6%
Rent to Value Ratio
Active
$1,750,000
1
bds
|
1
ba
|
850
sqft
|
built
2009
2201 Collins Ave, Miami Beach, FL 33139
$-8,834
Cash flow
-26.3%
Cash-on-Cash Return
0.2%
Cap rate
0.4%
Rent to Value Ratio

Active
$325,000
1
bds
|
1
ba
|
428
sqft
|
built
1941
3030 Collins Ave, Miami Beach, FL 33140
$-841
Cash flow
-13.5%
Cash-on-Cash Return
3.2%
Cap rate
0.7%
Rent to Value Ratio
Active
$22,900,000
6
bds
|
6
ba
|
5,566
sqft
|
built
1939
185 Palm Ave, Miami Beach, FL 33139
$-122,173
Cash flow
-27.8%
Cash-on-Cash Return
-0.1%
Cap rate
0.0%
Rent to Value Ratio
Active
$2,390,000
1
bds
|
0
ba
|
1,784
sqft
|
built
1940
8109 Harding Ave, Miami Beach, FL 33141
$-10,782
Cash flow
-23.5%
Cash-on-Cash Return
0.9%
Cap rate
0.2%
Rent to Value Ratio