Miami Beach, FL Investment Properties for Sale
Browse homes for sale and investment properties in Miami Beach, FL. Refine your search by price, property type, or more.
Best cash flowing properties in Miami Beach, FL
Active
$199,000
bds
|
1
ba
|
430
sqft
|
built
1940
1601 Lenox Ave, Miami Beach, FL 33139
$-186
Cash flow
-4.9%
Cash-on-Cash Return
5.2%
Cap rate
0.8%
Rent to Value Ratio

Active
$185,000
bds
|
1
ba
|
400
sqft
|
built
1961
1228 Pennsylvania Ave, Miami Beach, FL 33139
$-260
Cash flow
-7.3%
Cash-on-Cash Return
4.6%
Cap rate
1.0%
Rent to Value Ratio
1,968 out of 2,170 properties for sale in Miami Beach, FL
Limited Results Shown
Create a free account, or log in to reveal all property listings and enjoy the complete experience.

Active
$480,000
2
bds
|
2
ba
|
1,064
sqft
|
built
1967
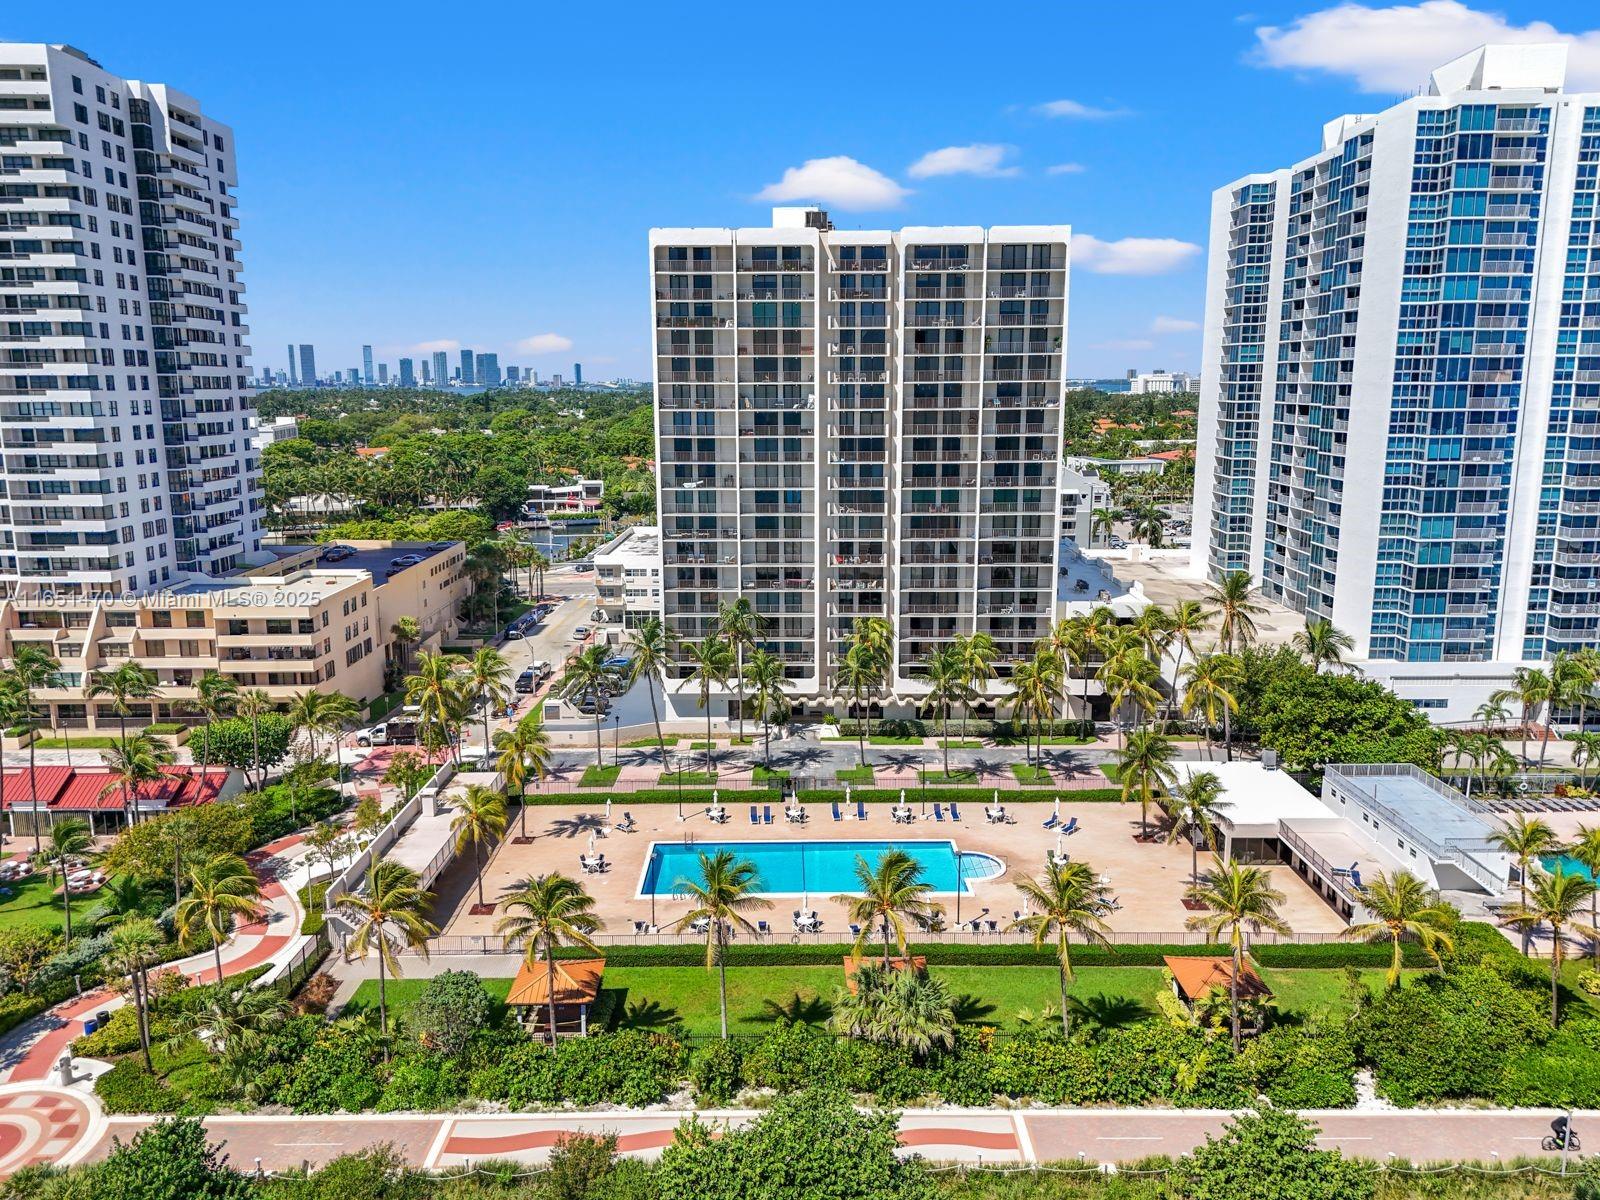
5555 Collins Ave, Miami Beach, FL 33140
$-887
Cash flow
-9.6%
Cash-on-Cash Return
4.1%
Cap rate
0.6%
Rent to Value Ratio
Active
$340,000
1
bds
|
1
ba
|
805
sqft
|
built
1967
1670 Bay Rd, Miami Beach, FL 33139
$-552
Cash flow
-8.5%
Cash-on-Cash Return
4.3%
Cap rate
0.9%
Rent to Value Ratio
Active
$365,000
2
bds
|
2
ba
|
730
sqft
|
built
1925
1320 Drexel Ave, Miami Beach, FL 33139
$-1,134
Cash flow
-16.2%
Cash-on-Cash Return
2.6%
Cap rate
0.8%
Rent to Value Ratio
Active
$278,000
1
bds
|
1
ba
|
663
sqft
|
built
1923
824 Jefferson Ave, Miami Beach, FL 33139
$-881
Cash flow
-16.5%
Cash-on-Cash Return
2.5%
Cap rate
0.8%
Rent to Value Ratio
Active
$1,225,000
3
bds
|
2
ba
|
2,010
sqft
|
built
1967
5640 Collins Ave, Miami Beach, FL 33140
$-1,292
Cash flow
-5.5%
Cash-on-Cash Return
5.0%
Cap rate
0.7%
Rent to Value Ratio

Active
$6,900,000
3
bds
|
3
ba
|
1,777
sqft
|
built
1952
4470 Alton Rd, Miami Beach, FL 33140
$-30,919
Cash flow
-23.4%
Cash-on-Cash Return
0.9%
Cap rate
0.1%
Rent to Value Ratio
Active
$199,000
bds
|
1
ba
|
430
sqft
|
built
1940
1601 Lenox Ave, Miami Beach, FL 33139
$-186
Cash flow
-4.9%
Cash-on-Cash Return
5.2%
Cap rate
0.8%
Rent to Value Ratio
Active
$695,000
2
bds
|
2
ba
|
1,190
sqft
|
built
1967
5600 Collins Ave, Miami Beach, FL 33140
$-2,192
Cash flow
-16.5%
Cash-on-Cash Return
2.5%
Cap rate
0.7%
Rent to Value Ratio
Active
$790,000
2
bds
|
2
ba
|
970
sqft
|
built
1998
5900 Collins Ave, Miami Beach, FL 33140
$-2,868
Cash flow
-18.9%
Cash-on-Cash Return
1.9%
Cap rate
0.6%
Rent to Value Ratio
Active
$479,000
2
bds
|
2
ba
|
910
sqft
|
built
1937
1460 Ocean Dr, Miami Beach, FL 33139
$-2,003
Cash flow
-21.8%
Cash-on-Cash Return
1.3%
Cap rate
0.6%
Rent to Value Ratio
Active
$185,000
bds
|
1
ba
|
400
sqft
|
built
1961
1228 Pennsylvania Ave, Miami Beach, FL 33139
$-260
Cash flow
-7.3%
Cash-on-Cash Return
4.6%
Cap rate
1.0%
Rent to Value Ratio
Pending
$1,196,000
3
bds
|
2
ba
|
1,294
sqft
|
built
2011
2100 Park Ave, Miami Beach, FL 33139
$-3,712
Cash flow
-16.2%
Cash-on-Cash Return
2.6%
Cap rate
0.5%
Rent to Value Ratio
Active
$185,000
bds
|
1
ba
|
400
sqft
|
built
1961
1228 Pennsylvania Ave, Miami Beach, FL 33139
$-329
Cash flow
-9.3%
Cash-on-Cash Return
4.2%
Cap rate
0.9%
Rent to Value Ratio
Active
$549,900
2
bds
|
2
ba
|
1,520
sqft
|
built
1963
900 Bay Dr, Miami Beach, FL 33141
$-1,968
Cash flow
-18.7%
Cash-on-Cash Return
2.0%
Cap rate
0.7%
Rent to Value Ratio
Active
$210,000
bds
|
1
ba
|
350
sqft
|
built
1966
1300 Lincoln Rd, Miami Beach, FL 33139
$-553
Cash flow
-13.7%
Cash-on-Cash Return
3.1%
Cap rate
0.8%
Rent to Value Ratio

Active
$990,000
2
bds
|
2
ba
|
1,360
sqft
|
built
1966
5161 Collins Ave, Miami Beach, FL 33140
$-1,502
Cash flow
-7.9%
Cash-on-Cash Return
4.5%
Cap rate
0.7%
Rent to Value Ratio

Active
$2,820,000
10
bds
|
0
ba
|
5,426
sqft
|
built
1948
1150 8th St, Miami Beach, FL 33139
$-15,446
Cash flow
-28.6%
Cash-on-Cash Return
-0.3%
Cap rate
0.1%
Rent to Value Ratio
Active
$275,000
1
bds
|
1
ba
|
560
sqft
|
built
1961
640 Pennsylvania Ave, Miami Beach, FL 33139
$-708
Cash flow
-13.4%
Cash-on-Cash Return
3.2%
Cap rate
0.8%
Rent to Value Ratio
Active
$325,000
1
bds
|
1
ba
|
912
sqft
|
built
1967
5555 Collins Ave, Miami Beach, FL 33140
$-1,095
Cash flow
-17.6%
Cash-on-Cash Return
2.2%
Cap rate
0.9%
Rent to Value Ratio

Active
$500,000
2
bds
|
2
ba
|
1,030
sqft
|
built
1968
5700 Collins Ave, Miami Beach, FL 33140
$-2,241
Cash flow
-23.4%
Cash-on-Cash Return
0.9%
Cap rate
0.6%
Rent to Value Ratio
Active
$385,000
1
bds
|
1
ba
|
646
sqft
|
built
1962
8000 Tatum Waterway Dr, Miami Beach, FL 33141
$-1,334
Cash flow
-18.1%
Cash-on-Cash Return
2.1%
Cap rate
0.5%
Rent to Value Ratio

Active
$4,450,000
5
bds
|
6
ba
|
4,229
sqft
|
built
1934
5069 N Bay Rd, Miami Beach, FL 33140
$-21,890
Cash flow
-25.7%
Cash-on-Cash Return
0.4%
Cap rate
0.2%
Rent to Value Ratio
Active
$289,999
1
bds
|
1
ba
|
500
sqft
|
built
1954
1551 Michigan Ave, Miami Beach, FL 33139
$-617
Cash flow
-11.1%
Cash-on-Cash Return
3.7%
Cap rate
0.7%
Rent to Value Ratio

Active
$1,080,000
3
bds
|
2
ba
|
1,284
sqft
|
built
1930
846 Michigan Ave, Miami Beach, FL 33139
$-3,212
Cash flow
-15.5%
Cash-on-Cash Return
2.7%
Cap rate
0.5%
Rent to Value Ratio
Active
$479,000
1
bds
|
2
ba
|
1,075
sqft
|
built
1980
2625 Collins Ave, Miami Beach, FL 33140
$-1,505
Cash flow
-16.4%
Cash-on-Cash Return
2.5%
Cap rate
0.7%
Rent to Value Ratio
Active
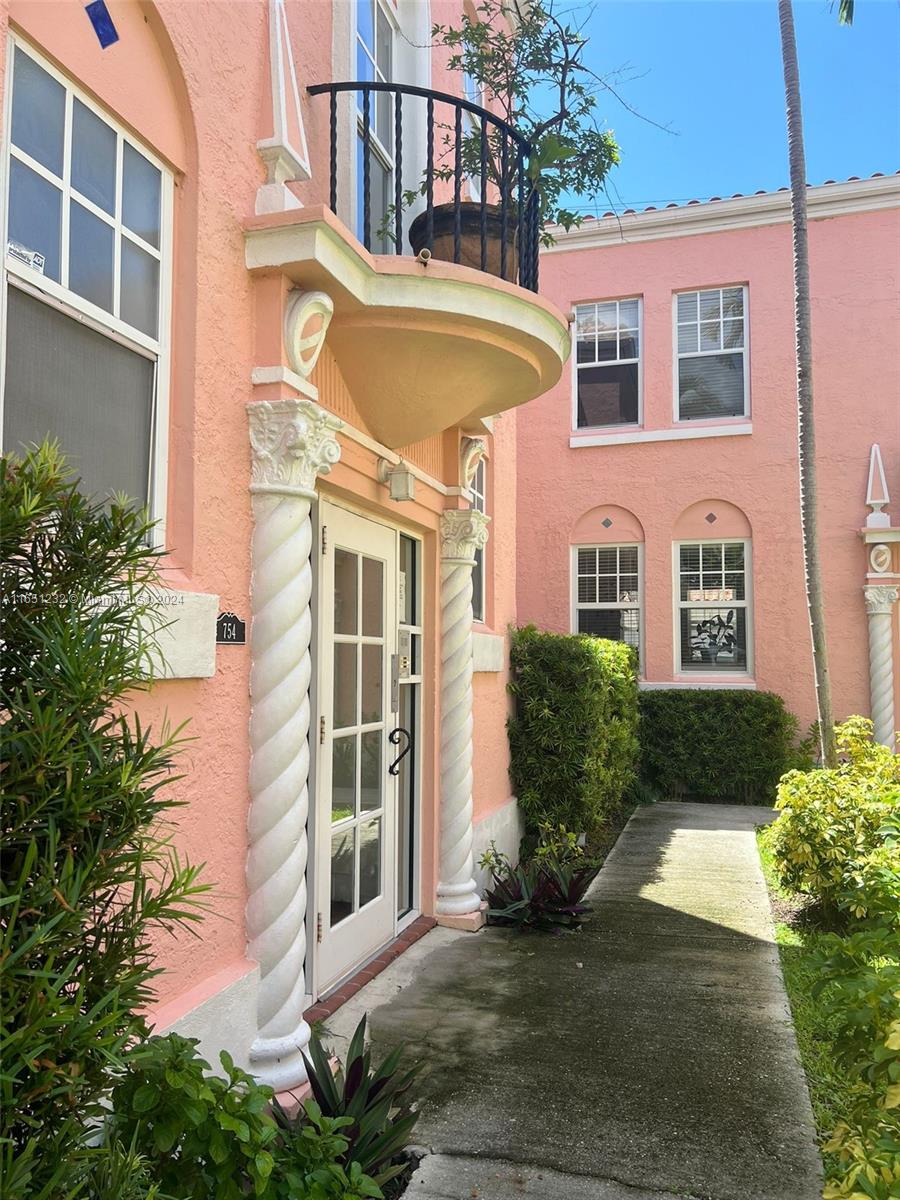
$295,000
1
bds
|
1
ba
|
510
sqft
|
built
1923
754 Meridian Ave, Miami Beach, FL 33139
$-1,021
Cash flow
-18.1%
Cash-on-Cash Return
2.1%
Cap rate
0.6%
Rent to Value Ratio
Active
$340,000
bds
|
1
ba
|
570
sqft
|
built
1967
5401 Collins Ave, Miami Beach, FL 33140
$-1,577
Cash flow
-24.2%
Cash-on-Cash Return
0.7%
Cap rate
0.7%
Rent to Value Ratio

Active
$3,999,900
4
bds
|
5
ba
|
3,016
sqft
|
built
1955
970 S Shore Dr, Miami Beach, FL 33141
$-19,554
Cash flow
-25.5%
Cash-on-Cash Return
0.4%
Cap rate
0.3%
Rent to Value Ratio
Active
$350,000
bds
|
1
ba
|
530
sqft
|
built
1965
100 Lincoln Rd, Miami Beach, FL 33139
$-1,169
Cash flow
-17.4%
Cash-on-Cash Return
2.3%
Cap rate
0.7%
Rent to Value Ratio
Active
$380,000
2
bds
|
2
ba
|
1,151
sqft
|
built
1969
8001 Crespi Blvd, Miami Beach, FL 33141
$-1,024
Cash flow
-14.1%
Cash-on-Cash Return
3.1%
Cap rate
0.8%
Rent to Value Ratio

Active
$1,280,000
3
bds
|
3
ba
|
1,304
sqft
|
built
2013
6700 Indian Creek Dr, Miami Beach, FL 33141
$-6,222
Cash flow
-25.4%
Cash-on-Cash Return
0.5%
Cap rate
0.5%
Rent to Value Ratio
Active
$342,000
1
bds
|
1
ba
|
579
sqft
|
built
1936
435 21st St, Miami Beach, FL 33139
$-1,650
Cash flow
-25.2%
Cash-on-Cash Return
0.5%
Cap rate
0.6%
Rent to Value Ratio

Active
$500,000
2
bds
|
2
ba
|
1,047
sqft
|
built
1967
5555 Collins Ave, Miami Beach, FL 33140
$-1,039
Cash flow
-10.8%
Cash-on-Cash Return
3.8%
Cap rate
0.6%
Rent to Value Ratio
Active
$1,550,000
3
bds
|
3
ba
|
2,060
sqft
|
built
1966
5151 Collins Ave, Miami Beach, FL 33140
$-7,479
Cash flow
-25.2%
Cash-on-Cash Return
0.5%
Cap rate
0.4%
Rent to Value Ratio

Active
$5,950,000
4
bds
|
2
ba
|
2,927
sqft
|
built
1951
1020 S Shore Dr, Miami Beach, FL 33141
$-25,435
Cash flow
-22.3%
Cash-on-Cash Return
1.2%
Cap rate
0.2%
Rent to Value Ratio
Active
$799,000
2
bds
|
2
ba
|
1,301
sqft
|
built
1967
5555 Collins Ave, Miami Beach, FL 33140
$-2,857
Cash flow
-18.7%
Cash-on-Cash Return
2.0%
Cap rate
0.7%
Rent to Value Ratio
Active
$1,525,000
bds
|
1
ba
|
574
sqft
|
built
2009
2201 Collins Ave, Miami Beach, FL 33139
$-7,514
Cash flow
-25.7%
Cash-on-Cash Return
0.4%
Cap rate
0.4%
Rent to Value Ratio
Active
$375,000
0
bds
|
1
ba
|
390
sqft
|
built
1966
5445 Collins Ave, Miami Beach, FL 33140
$-1,623
Cash flow
-22.6%
Cash-on-Cash Return
1.1%
Cap rate
0.7%
Rent to Value Ratio

Active
$1,098,000
2
bds
|
2
ba
|
1,037
sqft
|
built
1982
2555 Collins Ave, Miami Beach, FL 33140
$-4,332
Cash flow
-20.6%
Cash-on-Cash Return
1.5%
Cap rate
0.5%
Rent to Value Ratio
Active
$245,000
1
bds
|
1
ba
|
470
sqft
|
built
2015
920 Jefferson Ave, Miami Beach, FL 33139
$-660
Cash flow
-14.1%
Cash-on-Cash Return
3.1%
Cap rate
0.8%
Rent to Value Ratio