Miami Beach, FL Investment Properties for Sale
Browse homes for sale and investment properties in Miami Beach, FL. Refine your search by price, property type, or more.
Best cash flowing properties in Miami Beach, FL

Active
$189,000
1
bds
|
1
ba
|
475
sqft
|
built
1966
6856 Abbott Ave, Miami Beach, FL 33141
$-84
Cash flow
-2.3%
Cash-on-Cash Return
5.8%
Cap rate
1.1%
Rent to Value Ratio

Active
$275,000
1
bds
|
2
ba
|
676
sqft
|
built
1971
6969 Collins Ave, Miami Beach, FL 33141
$-317
Cash flow
-6.0%
Cash-on-Cash Return
4.9%
Cap rate
0.8%
Rent to Value Ratio
1,965 out of 2,167 properties for sale in Miami Beach, FL
Limited Results Shown
Create a free account, or log in to reveal all property listings and enjoy the complete experience.
Active
$279,000
2
bds
|
2
ba
|
952
sqft
|
built
1951
8420 Byron Ave, Miami Beach, FL 33141
$-686
Cash flow
-12.8%
Cash-on-Cash Return
3.3%
Cap rate
0.8%
Rent to Value Ratio
Active
$315,000
bds
|
1
ba
|
570
sqft
|
built
1967
5401 Collins Ave, Miami Beach, FL 33140
$-1,393
Cash flow
-23.1%
Cash-on-Cash Return
1.0%
Cap rate
0.8%
Rent to Value Ratio
Active
$925,000
2
bds
|
2
ba
|
1,520
sqft
|
built
1998
1 Century Ln, Miami Beach, FL 33139
$-3,290
Cash flow
-18.6%
Cash-on-Cash Return
2.0%
Cap rate
0.7%
Rent to Value Ratio

Active
$510,000
2
bds
|
1
ba
|
665
sqft
|
built
1970
240 Collins Ave, Miami Beach, FL 33139
$-939
Cash flow
-9.6%
Cash-on-Cash Return
4.1%
Cap rate
0.8%
Rent to Value Ratio
Active
$460,000
1
bds
|
1
ba
|
550
sqft
|
built
1965
100 Lincoln Rd, Miami Beach, FL 33139
$-1,588
Cash flow
-18.0%
Cash-on-Cash Return
2.1%
Cap rate
0.6%
Rent to Value Ratio
Active
$192,000
bds
|
1
ba
|
465
sqft
|
built
1957
8080 Tatum Waterway Dr, Miami Beach, FL 33141
$-486
Cash flow
-13.2%
Cash-on-Cash Return
3.2%
Cap rate
0.9%
Rent to Value Ratio
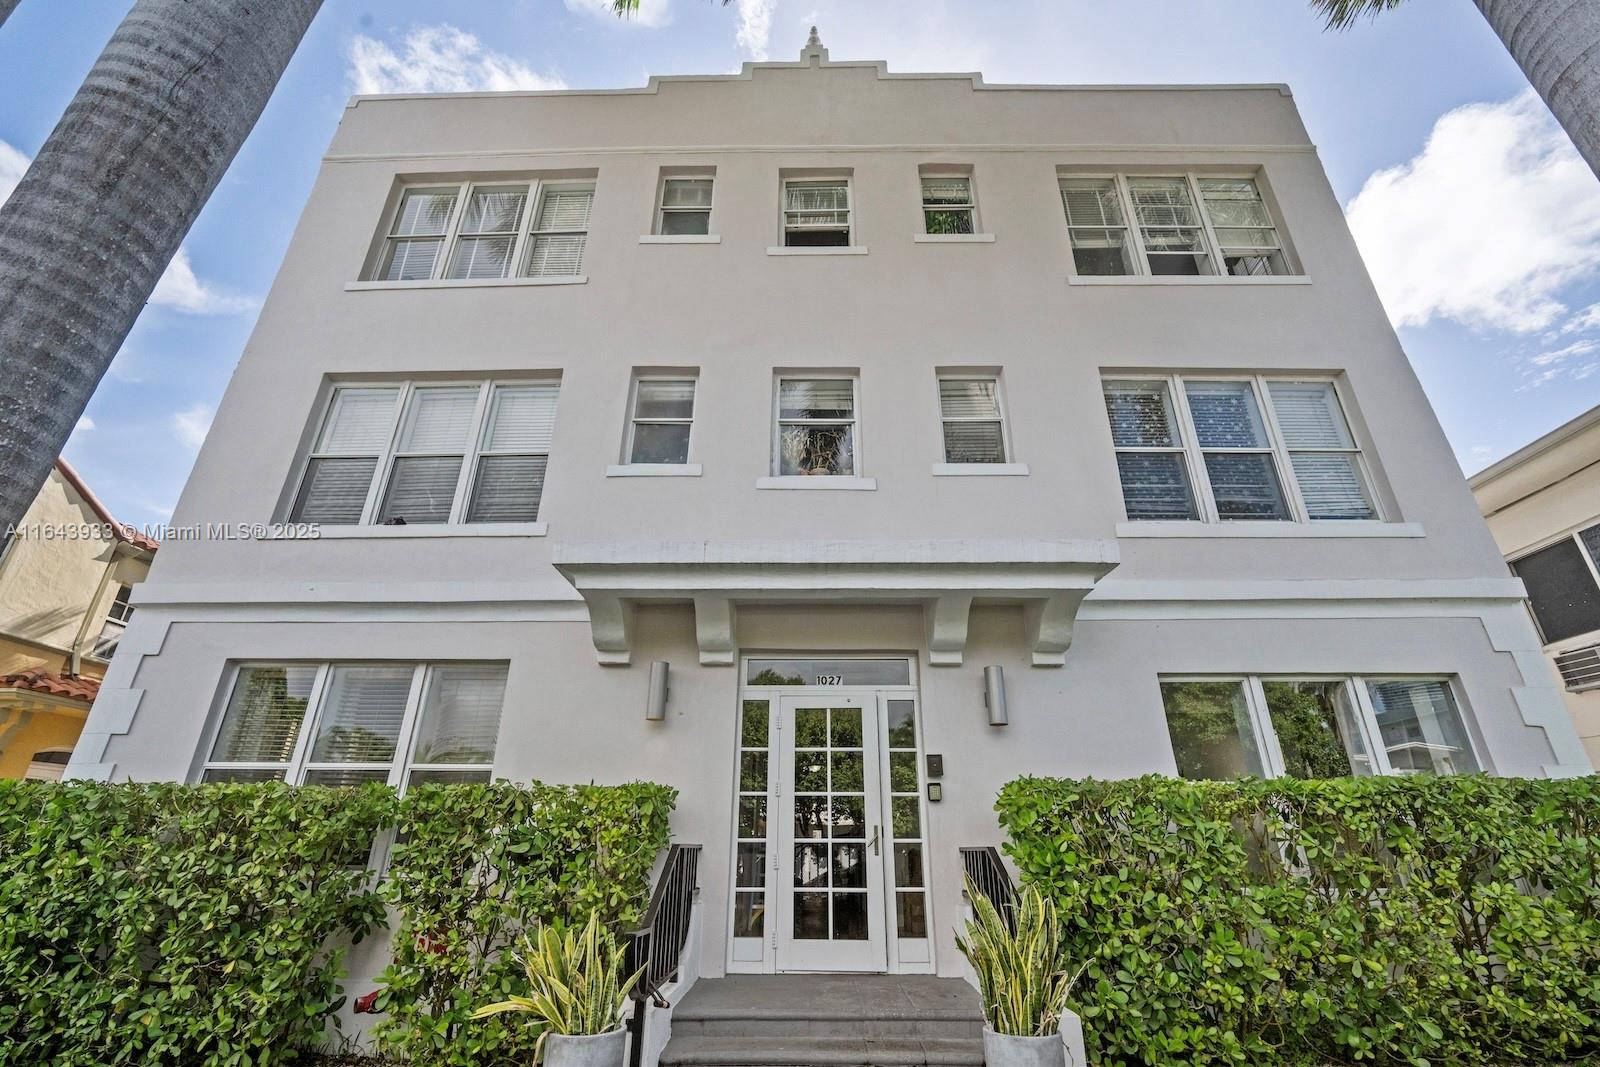
Active
$254,000
1
bds
|
1
ba
|
580
sqft
|
built
1925
1027 Pennsylvania Ave, Miami Beach, FL 33139
$-583
Cash flow
-12.0%
Cash-on-Cash Return
3.5%
Cap rate
0.9%
Rent to Value Ratio
Active
$2,750,000
5
bds
|
4
ba
|
2,698
sqft
|
built
1940
621 W Dilido Dr, Miami Beach, FL 33139
$-9,179
Cash flow
-17.4%
Cash-on-Cash Return
2.3%
Cap rate
0.4%
Rent to Value Ratio

Active
$345,000
1
bds
|
1
ba
|
837
sqft
|
built
1965
1200 West Ave, Miami Beach, FL 33139
$-510
Cash flow
-7.7%
Cash-on-Cash Return
4.5%
Cap rate
0.7%
Rent to Value Ratio
Active
$239,000
1
bds
|
1
ba
|
426
sqft
|
built
1945
551 Michigan Ave, Miami Beach, FL 33139
$-864
Cash flow
-18.9%
Cash-on-Cash Return
1.9%
Cap rate
0.8%
Rent to Value Ratio
Active
$275,000
1
bds
|
2
ba
|
676
sqft
|
built
1971
6969 Collins Ave, Miami Beach, FL 33141
$-317
Cash flow
-6.0%
Cash-on-Cash Return
4.9%
Cap rate
0.8%
Rent to Value Ratio
Active
$253,000
1
bds
|
1
ba
|
670
sqft
|
built
1969
821 Jefferson Ave, Miami Beach, FL 33139
$-623
Cash flow
-12.8%
Cash-on-Cash Return
3.3%
Cap rate
1.0%
Rent to Value Ratio

Active
$398,000
1
bds
|
1
ba
|
665
sqft
|
built
1970
240 Collins Ave, Miami Beach, FL 33139
$-1,161
Cash flow
-15.2%
Cash-on-Cash Return
2.8%
Cap rate
0.7%
Rent to Value Ratio
Active
$599,000
1
bds
|
1
ba
|
800
sqft
|
built
2008
6799 Collins Ave, Miami Beach, FL 33141
$-773
Cash flow
-6.7%
Cash-on-Cash Return
4.7%
Cap rate
0.8%
Rent to Value Ratio
Active
$330,000
bds
|
1
ba
|
570
sqft
|
built
1967
5401 Collins Ave, Miami Beach, FL 33140
$-1,584
Cash flow
-25.0%
Cash-on-Cash Return
0.5%
Cap rate
0.7%
Rent to Value Ratio
Active
$699,900
2
bds
|
2
ba
|
1,040
sqft
|
built
1966
5161 Collins Ave, Miami Beach, FL 33140
$-2,404
Cash flow
-17.9%
Cash-on-Cash Return
2.2%
Cap rate
0.6%
Rent to Value Ratio
Active
$1,595,000
2
bds
|
2
ba
|
1,060
sqft
|
built
1997
1900 Purdy Ave, Miami Beach, FL 33139
$-6,395
Cash flow
-20.9%
Cash-on-Cash Return
1.5%
Cap rate
0.4%
Rent to Value Ratio
Active
$245,000
1
bds
|
2
ba
|
799
sqft
|
built
1973
7900 Tatum Waterway Dr, Miami Beach, FL 33141
$-677
Cash flow
-14.4%
Cash-on-Cash Return
3.0%
Cap rate
0.8%
Rent to Value Ratio

Active
$825,000
2
bds
|
2
ba
|
1,955
sqft
|
built
1976
6423 Collins Ave, Miami Beach, FL 33141
$-2,893
Cash flow
-18.3%
Cash-on-Cash Return
2.1%
Cap rate
0.7%
Rent to Value Ratio
Active
$189,000
1
bds
|
1
ba
|
475
sqft
|
built
1966
6856 Abbott Ave, Miami Beach, FL 33141
$-84
Cash flow
-2.3%
Cash-on-Cash Return
5.8%
Cap rate
1.1%
Rent to Value Ratio
Active
$340,000
1
bds
|
1
ba
|
938
sqft
|
built
1964
5005 Collins Ave, Miami Beach, FL 33140
$-2,130
Cash flow
-32.7%
Cash-on-Cash Return
-1.2%
Cap rate
0.8%
Rent to Value Ratio
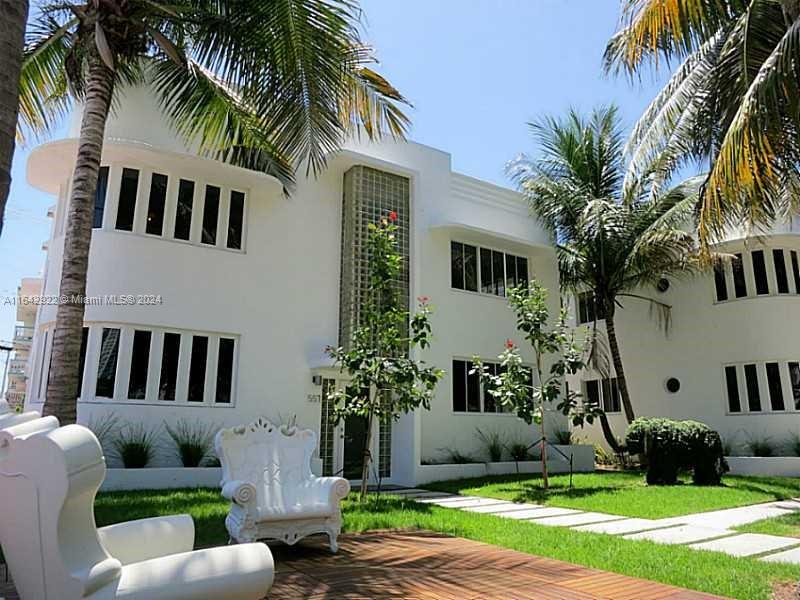
Active
$795,000
2
bds
|
2
ba
|
1,360
sqft
|
built
1991
5757 Collins Ave, Miami Beach, FL 33140
$-2,608
Cash flow
-17.1%
Cash-on-Cash Return
2.3%
Cap rate
0.6%
Rent to Value Ratio
Active
$855,000
bds
|
1
ba
|
491
sqft
|
built
2005
4401 Collins Ave, Miami Beach, FL 33140
$-3,307
Cash flow
-20.2%
Cash-on-Cash Return
1.6%
Cap rate
0.5%
Rent to Value Ratio

Active
$550,000
1
bds
|
1
ba
|
865
sqft
|
built
1965
100 Lincoln Rd, Miami Beach, FL 33139
$-1,204
Cash flow
-11.4%
Cash-on-Cash Return
3.7%
Cap rate
0.8%
Rent to Value Ratio
Active
$324,975
bds
|
1
ba
|
400
sqft
|
built
1976
710 Washington Ave, Miami Beach, FL 33139
$-1,036
Cash flow
-16.6%
Cash-on-Cash Return
2.5%
Cap rate
0.6%
Rent to Value Ratio
Active
$245,000
bds
|
1
ba
|
409
sqft
|
built
1960
4015 Indian Creek Dr, Miami Beach, FL 33140
$-354
Cash flow
-7.5%
Cash-on-Cash Return
4.6%
Cap rate
0.8%
Rent to Value Ratio

Active
$729,000
1
bds
|
2
ba
|
808
sqft
|
built
2004
6365 Collins Ave, Miami Beach, FL 33141
$-3,029
Cash flow
-21.7%
Cash-on-Cash Return
1.3%
Cap rate
0.5%
Rent to Value Ratio

Active
$360,000
bds
|
1
ba
|
340
sqft
|
built
1966
5445 Collins Ave, Miami Beach, FL 33140
$-1,671
Cash flow
-24.2%
Cash-on-Cash Return
0.7%
Cap rate
0.6%
Rent to Value Ratio

Active
$1,775,000
2
bds
|
2
ba
|
1,130
sqft
|
built
1999
90 Alton Rd, Miami Beach, FL 33139
$-6,614
Cash flow
-19.4%
Cash-on-Cash Return
1.8%
Cap rate
0.4%
Rent to Value Ratio

Active
$310,000
1
bds
|
1
ba
|
905
sqft
|
built
1970
401 69th St, Miami Beach, FL 33141
$-958
Cash flow
-16.1%
Cash-on-Cash Return
2.6%
Cap rate
0.9%
Rent to Value Ratio
Active
$345,000
1
bds
|
2
ba
|
920
sqft
|
built
1963
900 Bay Dr, Miami Beach, FL 33141
$-1,645
Cash flow
-24.9%
Cash-on-Cash Return
0.6%
Cap rate
0.7%
Rent to Value Ratio

Active
$250,000
bds
|
1
ba
|
345
sqft
|
built
1948
6345 Collins Ave, Miami Beach, FL 33141
$-877
Cash flow
-18.3%
Cash-on-Cash Return
2.1%
Cap rate
0.8%
Rent to Value Ratio
Active
$1,700,000
1
bds
|
1
ba
|
880
sqft
|
built
1926
2301 Collins Ave, Miami Beach, FL 33139
$-5,692
Cash flow
-17.5%
Cash-on-Cash Return
2.3%
Cap rate
0.5%
Rent to Value Ratio

Active
$525,000
bds
|
1
ba
|
470
sqft
|
built
1966
5445 Collins Ave, Miami Beach, FL 33140
$-1,907
Cash flow
-19.0%
Cash-on-Cash Return
1.9%
Cap rate
0.6%
Rent to Value Ratio
Active
$1,350,000
2
bds
|
2
ba
|
1,645
sqft
|
built
1975
2655 Collins Ave, Miami Beach, FL 33140
$-5,279
Cash flow
-20.4%
Cash-on-Cash Return
1.6%
Cap rate
0.5%
Rent to Value Ratio

Active
$560,000
2
bds
|
2
ba
|
1,280
sqft
|
built
1971
6039 Collins Ave, Miami Beach, FL 33140
$-1,793
Cash flow
-16.7%
Cash-on-Cash Return
2.4%
Cap rate
0.7%
Rent to Value Ratio
Active
$599,000
2
bds
|
2
ba
|
1,010
sqft
|
built
1983
1775 Washington Ave, Miami Beach, FL 33139
$-2,248
Cash flow
-19.6%
Cash-on-Cash Return
1.8%
Cap rate
0.7%
Rent to Value Ratio
Active
$245,000
bds
|
1
ba
|
411
sqft
|
built
1966
626 Meridian Ave, Miami Beach, FL 33139
$-530
Cash flow
-11.3%
Cash-on-Cash Return
3.7%
Cap rate
0.7%
Rent to Value Ratio
Active
$450,000
1
bds
|
2
ba
|
990
sqft
|
built
1965
1200 West Ave, Miami Beach, FL 33139
$-717
Cash flow
-8.3%
Cash-on-Cash Return
4.4%
Cap rate
0.7%
Rent to Value Ratio
Active
$340,000
bds
|
1
ba
|
746
sqft
|
built
1968
1000 West Ave, Miami Beach, FL 33139
$-1,064
Cash flow
-16.3%
Cash-on-Cash Return
2.5%
Cap rate
0.7%
Rent to Value Ratio