Miami Beach, FL Investment Properties for Sale
Browse homes for sale and investment properties in Miami Beach, FL. Refine your search by price, property type, or more.
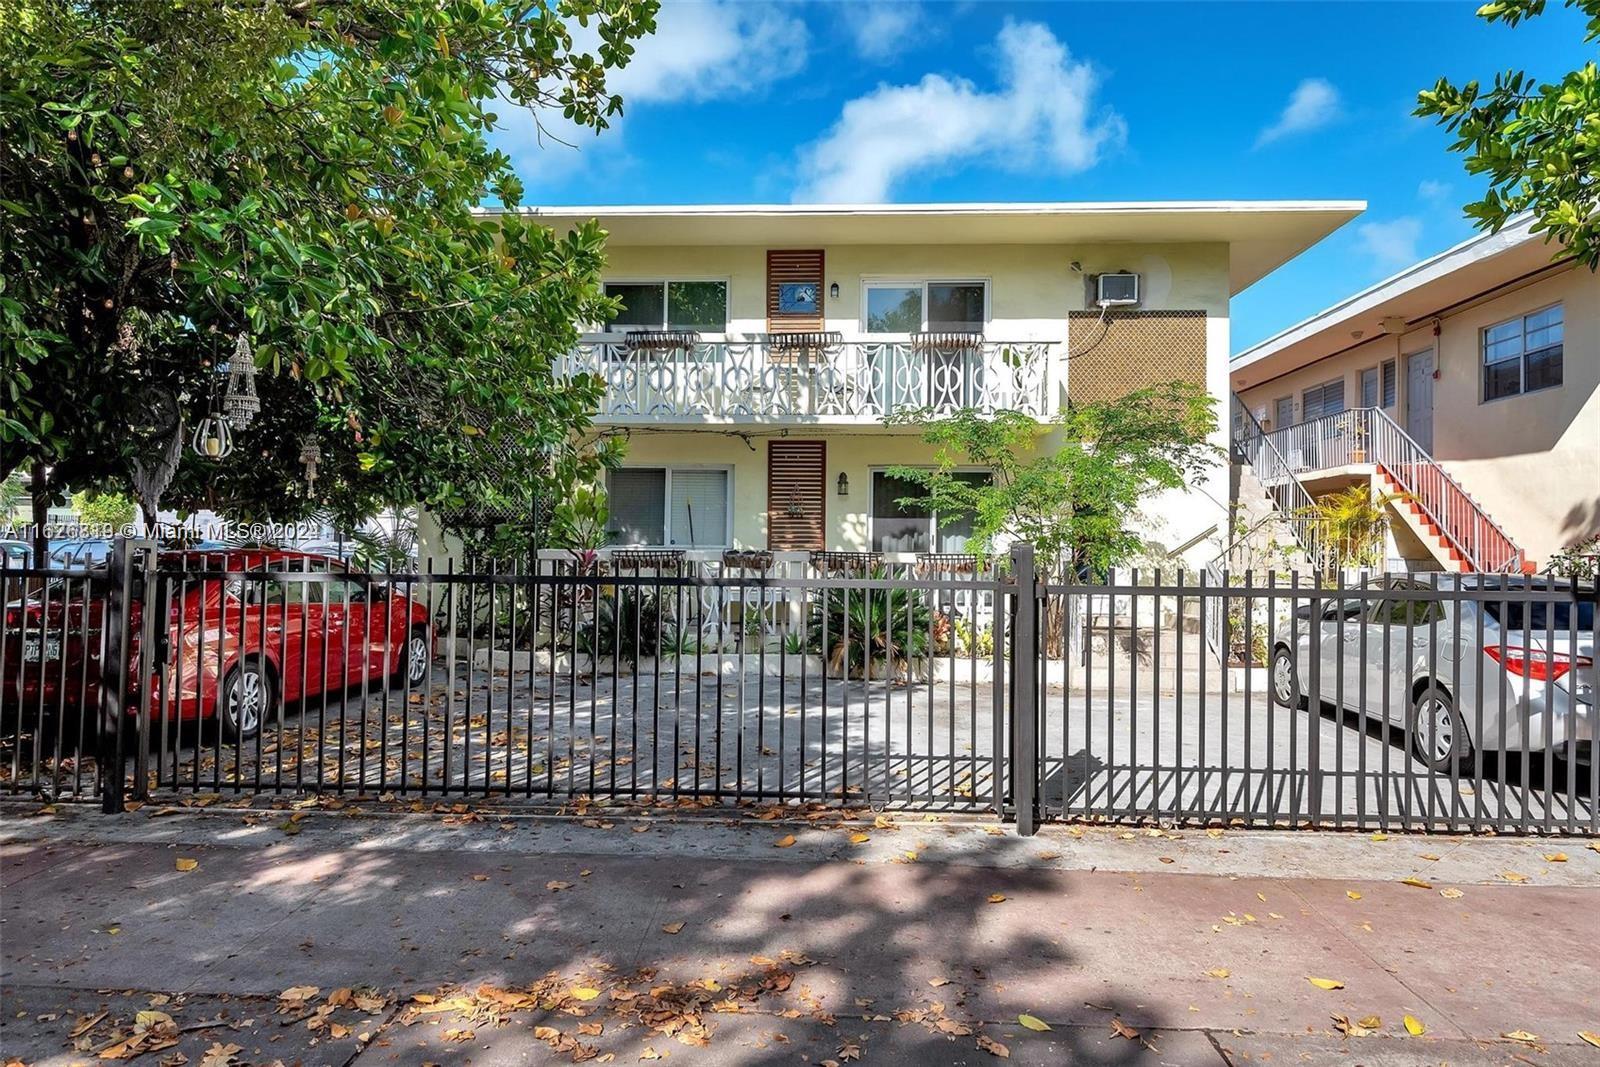
Best cash flowing properties in Miami Beach, FL

Active
$187,000
bds
|
1
ba
|
341
sqft
|
built
1940
1021 Euclid Ave, Miami Beach, FL 33139
$359
Cash flow
10.0%
Cash-on-Cash Return
8.5%
Cap rate
1.2%
Rent to Value Ratio
Active
$245,000
bds
|
1
ba
|
411
sqft
|
built
1966
626 Meridian Ave, Miami Beach, FL 33139
$-502
Cash flow
-10.7%
Cash-on-Cash Return
3.7%
Cap rate
0.7%
Rent to Value Ratio
1,984 out of 2,186 properties for sale in Miami Beach, FL
Limited Results Shown
Create a free account, or log in to reveal all property listings and enjoy the complete experience.

Active
$360,000
bds
|
1
ba
|
340
sqft
|
built
1966
5445 Collins Ave, Miami Beach, FL 33140
$-1,630
Cash flow
-23.6%
Cash-on-Cash Return
0.7%
Cap rate
0.6%
Rent to Value Ratio

Active
$310,000
1
bds
|
1
ba
|
905
sqft
|
built
1970
401 69th St, Miami Beach, FL 33141
$-923
Cash flow
-15.5%
Cash-on-Cash Return
2.6%
Cap rate
0.9%
Rent to Value Ratio

Active
$1,775,000
2
bds
|
2
ba
|
1,130
sqft
|
built
1999
90 Alton Rd, Miami Beach, FL 33139
$-6,411
Cash flow
-18.8%
Cash-on-Cash Return
1.8%
Cap rate
0.4%
Rent to Value Ratio
Active
$345,000
1
bds
|
2
ba
|
920
sqft
|
built
1963
900 Bay Dr, Miami Beach, FL 33141
$-1,605
Cash flow
-24.3%
Cash-on-Cash Return
0.6%
Cap rate
0.7%
Rent to Value Ratio

Active
$250,000
bds
|
1
ba
|
345
sqft
|
built
1948
6345 Collins Ave, Miami Beach, FL 33141
$-849
Cash flow
-17.7%
Cash-on-Cash Return
2.1%
Cap rate
0.8%
Rent to Value Ratio
Active
$1,700,000
1
bds
|
1
ba
|
880
sqft
|
built
1926
2301 Collins Ave, Miami Beach, FL 33139
$-5,498
Cash flow
-16.9%
Cash-on-Cash Return
2.3%
Cap rate
0.5%
Rent to Value Ratio

Active
$525,000
bds
|
1
ba
|
470
sqft
|
built
1966
5445 Collins Ave, Miami Beach, FL 33140
$-1,847
Cash flow
-18.4%
Cash-on-Cash Return
1.9%
Cap rate
0.6%
Rent to Value Ratio
Active
$1,350,000
2
bds
|
2
ba
|
1,645
sqft
|
built
1975
2655 Collins Ave, Miami Beach, FL 33140
$-5,124
Cash flow
-19.8%
Cash-on-Cash Return
1.6%
Cap rate
0.5%
Rent to Value Ratio

Active
$560,000
2
bds
|
2
ba
|
1,280
sqft
|
built
1971
6039 Collins Ave, Miami Beach, FL 33140
$-1,729
Cash flow
-16.1%
Cash-on-Cash Return
2.4%
Cap rate
0.7%
Rent to Value Ratio
Active
$599,000
2
bds
|
2
ba
|
1,010
sqft
|
built
1983
1775 Washington Ave, Miami Beach, FL 33139
$-2,179
Cash flow
-19.0%
Cash-on-Cash Return
1.8%
Cap rate
0.7%
Rent to Value Ratio
Active
$245,000
bds
|
1
ba
|
411
sqft
|
built
1966
626 Meridian Ave, Miami Beach, FL 33139
$-502
Cash flow
-10.7%
Cash-on-Cash Return
3.7%
Cap rate
0.7%
Rent to Value Ratio
Active
$450,000
1
bds
|
2
ba
|
990
sqft
|
built
1965
1200 West Ave, Miami Beach, FL 33139
$-665
Cash flow
-7.7%
Cash-on-Cash Return
4.4%
Cap rate
0.7%
Rent to Value Ratio
Active
$340,000
bds
|
1
ba
|
746
sqft
|
built
1968
1000 West Ave, Miami Beach, FL 33139
$-1,026
Cash flow
-15.7%
Cash-on-Cash Return
2.5%
Cap rate
0.7%
Rent to Value Ratio
Active
$315,000
1
bds
|
1
ba
|
900
sqft
|
built
1969
7133 Bay Dr, Miami Beach, FL 33141
$-1,082
Cash flow
-17.9%
Cash-on-Cash Return
2.0%
Cap rate
0.7%
Rent to Value Ratio

Active
$975,000
1
bds
|
1
ba
|
980
sqft
|
built
1966
5445 Collins Ave, Miami Beach, FL 33140
$-4,209
Cash flow
-22.5%
Cash-on-Cash Return
1.0%
Cap rate
0.5%
Rent to Value Ratio

Active
$920,000
2
bds
|
2
ba
|
1,030
sqft
|
built
1966
5151 Collins Ave, Miami Beach, FL 33140
$-3,385
Cash flow
-19.2%
Cash-on-Cash Return
1.7%
Cap rate
0.5%
Rent to Value Ratio

Active
$430,000
bds
|
1
ba
|
787
sqft
|
built
1968
1000 West Ave, Miami Beach, FL 33139
$-1,570
Cash flow
-19.0%
Cash-on-Cash Return
1.8%
Cap rate
0.7%
Rent to Value Ratio
Active
$535,000
1
bds
|
2
ba
|
800
sqft
|
built
2011
2100 Park Ave, Miami Beach, FL 33139
$-1,168
Cash flow
-11.4%
Cash-on-Cash Return
3.5%
Cap rate
0.7%
Rent to Value Ratio
Active
$2,100,000
2
bds
|
0
ba
|
4,278
sqft
|
built
1947
1310 15th St, Miami Beach, FL 33139
$-8,349
Cash flow
-20.7%
Cash-on-Cash Return
1.4%
Cap rate
0.3%
Rent to Value Ratio
Active
$1,699,000
3
bds
|
3
ba
|
1,660
sqft
|
built
1995
5025 Collins Ave, Miami Beach, FL 33140
$-7,146
Cash flow
-21.9%
Cash-on-Cash Return
1.1%
Cap rate
0.5%
Rent to Value Ratio
Active
$936,000
bds
|
1
ba
|
526
sqft
|
built
2005
4401 Collins Ave, Miami Beach, FL 33140
$-3,336
Cash flow
-18.6%
Cash-on-Cash Return
1.9%
Cap rate
0.5%
Rent to Value Ratio

Active
$425,000
2
bds
|
2
ba
|
1,550
sqft
|
built
1963
900 Bay Dr, Miami Beach, FL 33141
$-2,086
Cash flow
-25.6%
Cash-on-Cash Return
0.3%
Cap rate
0.8%
Rent to Value Ratio

Active
$1,595,000
3
bds
|
3
ba
|
2,029
sqft
|
built
1960
1500 Bay Rd, Miami Beach, FL 33139
$-7,670
Cash flow
-25.1%
Cash-on-Cash Return
0.4%
Cap rate
0.6%
Rent to Value Ratio
Active
$1,950,000
5
bds
|
5
ba
|
3,104
sqft
|
built
1956
8221 Crespi Blvd, Miami Beach, FL 33141
$-5,578
Cash flow
-14.9%
Cash-on-Cash Return
2.7%
Cap rate
0.4%
Rent to Value Ratio
Active
$650,000
1
bds
|
1
ba
|
560
sqft
|
built
1925
918 Ocean Dr, Miami Beach, FL 33139
$-45,417
Cash flow
-364.6%
Cash-on-Cash Return
-77.7%
Cap rate
0.5%
Rent to Value Ratio

Active
$483,000
1
bds
|
1
ba
|
900
sqft
|
built
1968
5700 Collins Ave, Miami Beach, FL 33140
$-2,098
Cash flow
-22.7%
Cash-on-Cash Return
0.9%
Cap rate
0.6%
Rent to Value Ratio
Active
$190,000
1
bds
|
1
ba
|
400
sqft
|
built
1930
1027 Euclid Ave, Miami Beach, FL 33139
$-634
Cash flow
-17.4%
Cash-on-Cash Return
2.1%
Cap rate
0.8%
Rent to Value Ratio
Active
$1,800,000
2
bds
|
2
ba
|
1,550
sqft
|
built
2000
4779 Collins Ave, Miami Beach, FL 33140
$-5,381
Cash flow
-15.6%
Cash-on-Cash Return
2.6%
Cap rate
0.4%
Rent to Value Ratio
Active
$3,950,000
5
bds
|
4
ba
|
1,806
sqft
|
built
1921
242 Meridian Ave, Miami Beach, FL 33139
$-15,916
Cash flow
-21.0%
Cash-on-Cash Return
1.3%
Cap rate
0.3%
Rent to Value Ratio
Active
$499,000
2
bds
|
2
ba
|
1,326
sqft
|
built
1967
5825 Collins Ave, Miami Beach, FL 33140
$-2,019
Cash flow
-21.1%
Cash-on-Cash Return
1.3%
Cap rate
0.6%
Rent to Value Ratio
Active
$3,990,000
4
bds
|
4
ba
|
2,760
sqft
|
built
1972
11 Island Ave, Miami Beach, FL 33139
$-15,351
Cash flow
-20.1%
Cash-on-Cash Return
1.5%
Cap rate
0.2%
Rent to Value Ratio
Active
$675,000
1
bds
|
2
ba
|
960
sqft
|
built
1968
5601 Collins Ave, Miami Beach, FL 33140
$-2,188
Cash flow
-16.9%
Cash-on-Cash Return
2.3%
Cap rate
0.6%
Rent to Value Ratio
Active
$187,000
bds
|
1
ba
|
341
sqft
|
built
1940
1021 Euclid Ave, Miami Beach, FL 33139
$359
Cash flow
10.0%
Cash-on-Cash Return
8.5%
Cap rate
1.2%
Rent to Value Ratio

Active
$1,950,000
2
bds
|
2
ba
|
1,437
sqft
|
built
2003
400 Alton Rd, Miami Beach, FL 33139
$-8,458
Cash flow
-22.6%
Cash-on-Cash Return
0.9%
Cap rate
0.4%
Rent to Value Ratio
Active
$560,000
2
bds
|
2
ba
|
1,030
sqft
|
built
1968
5700 Collins Ave, Miami Beach, FL 33140
$-1,596
Cash flow
-14.9%
Cash-on-Cash Return
2.7%
Cap rate
0.7%
Rent to Value Ratio
Active
$7,950,000
6
bds
|
6
ba
|
4,330
sqft
|
built
2018
2456 Prairie Ave, Miami Beach, FL 33140
$-39,763
Cash flow
-26.1%
Cash-on-Cash Return
0.1%
Cap rate
0.1%
Rent to Value Ratio

Active
$400,000
2
bds
|
2
ba
|
739
sqft
|
built
1941
811 Jefferson Ave, Miami Beach, FL 33139
$-1,478
Cash flow
-19.3%
Cash-on-Cash Return
1.7%
Cap rate
0.7%
Rent to Value Ratio
Active
$974,000
2
bds
|
2
ba
|
952
sqft
|
built
2011
421 Meridian Ave, Miami Beach, FL 33139
$-3,505
Cash flow
-18.8%
Cash-on-Cash Return
1.8%
Cap rate
0.5%
Rent to Value Ratio
Active
$9,300,000
7
bds
|
7
ba
|
7,034
sqft
|
built
1951
5077 N Bay Rd, Miami Beach, FL 33140
$-43,957
Cash flow
-24.7%
Cash-on-Cash Return
0.5%
Cap rate
0.1%
Rent to Value Ratio

Active
$559,000
1
bds
|
2
ba
|
692
sqft
|
built
2011
2155 Washington Ct, Miami Beach, FL 33139
$-1,858
Cash flow
-17.3%
Cash-on-Cash Return
2.2%
Cap rate
0.6%
Rent to Value Ratio