Miami Beach, FL Investment Properties for Sale
Browse homes for sale and investment properties in Miami Beach, FL. Refine your search by price, property type, or more.
Best cash flowing properties in Miami Beach, FL
Active
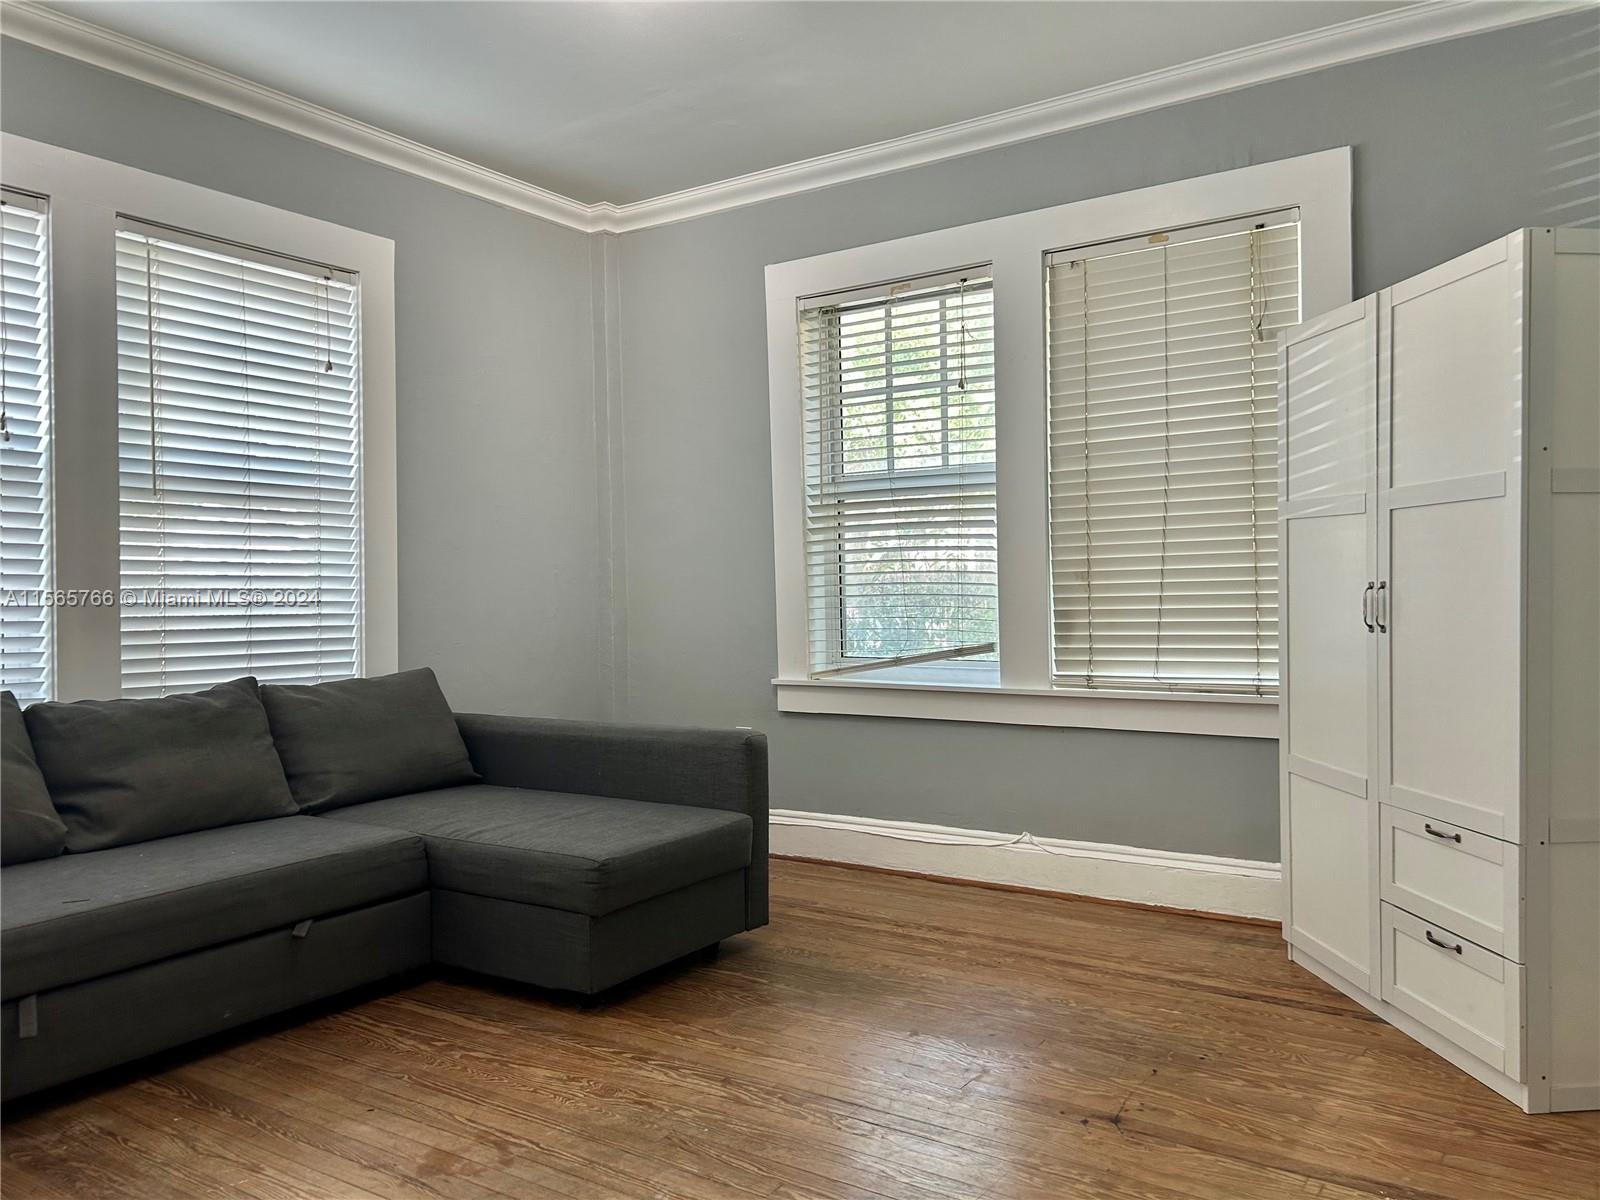
$249,999
1
bds
|
1
ba
|
580
sqft
|
built
1925
536 14th St, Miami Beach, FL 33139
$-199
Cash flow
-4.2%
Cash-on-Cash Return
5.3%
Cap rate
0.8%
Rent to Value Ratio

Active
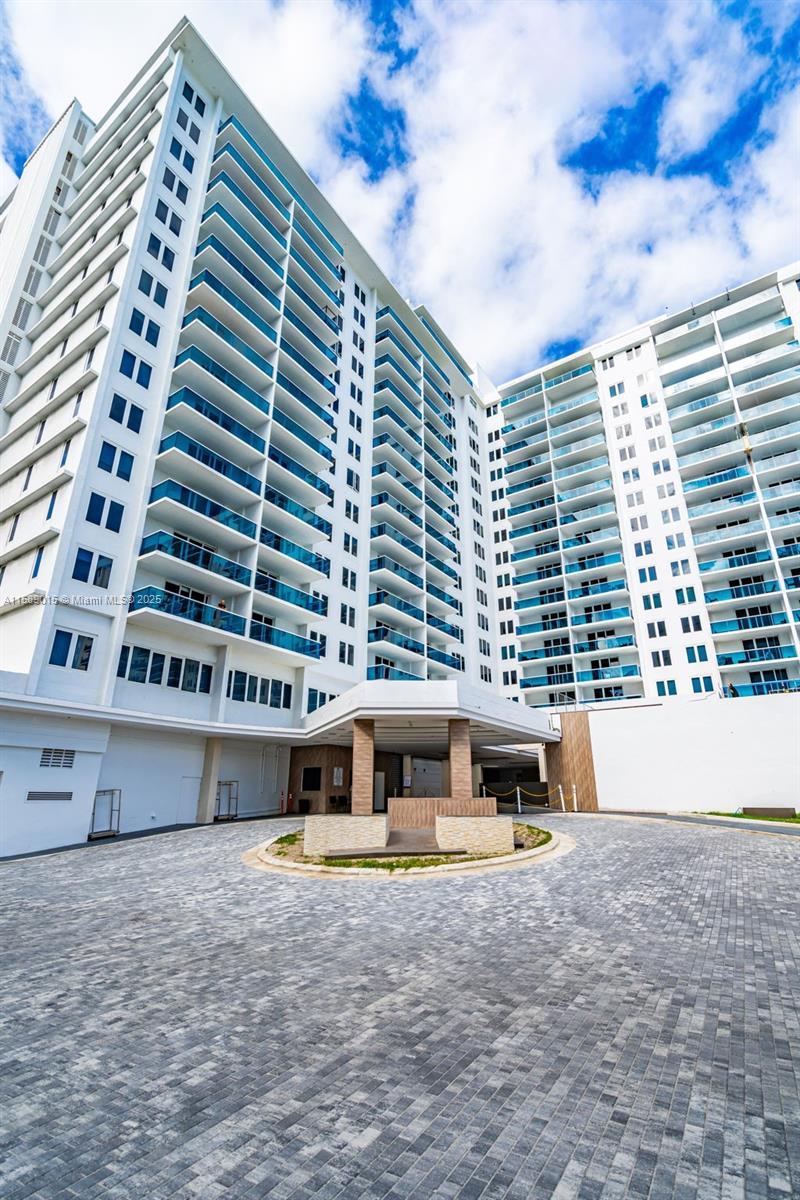
$195,000
1
bds
|
1
ba
|
493
sqft
|
built
1940
7928 Harding Ave, Miami Beach, FL 33141
$-355
Cash flow
-9.5%
Cash-on-Cash Return
4.1%
Cap rate
0.9%
Rent to Value Ratio
1,984 out of 2,186 properties for sale in Miami Beach, FL
Limited Results Shown
Create a free account, or log in to reveal all property listings and enjoy the complete experience.

Active
$219,500
1
bds
|
1
ba
|
532
sqft
|
built
1945
1000 Meridian Ave, Miami Beach, FL 33139
$-540
Cash flow
-12.8%
Cash-on-Cash Return
3.3%
Cap rate
0.8%
Rent to Value Ratio

Active
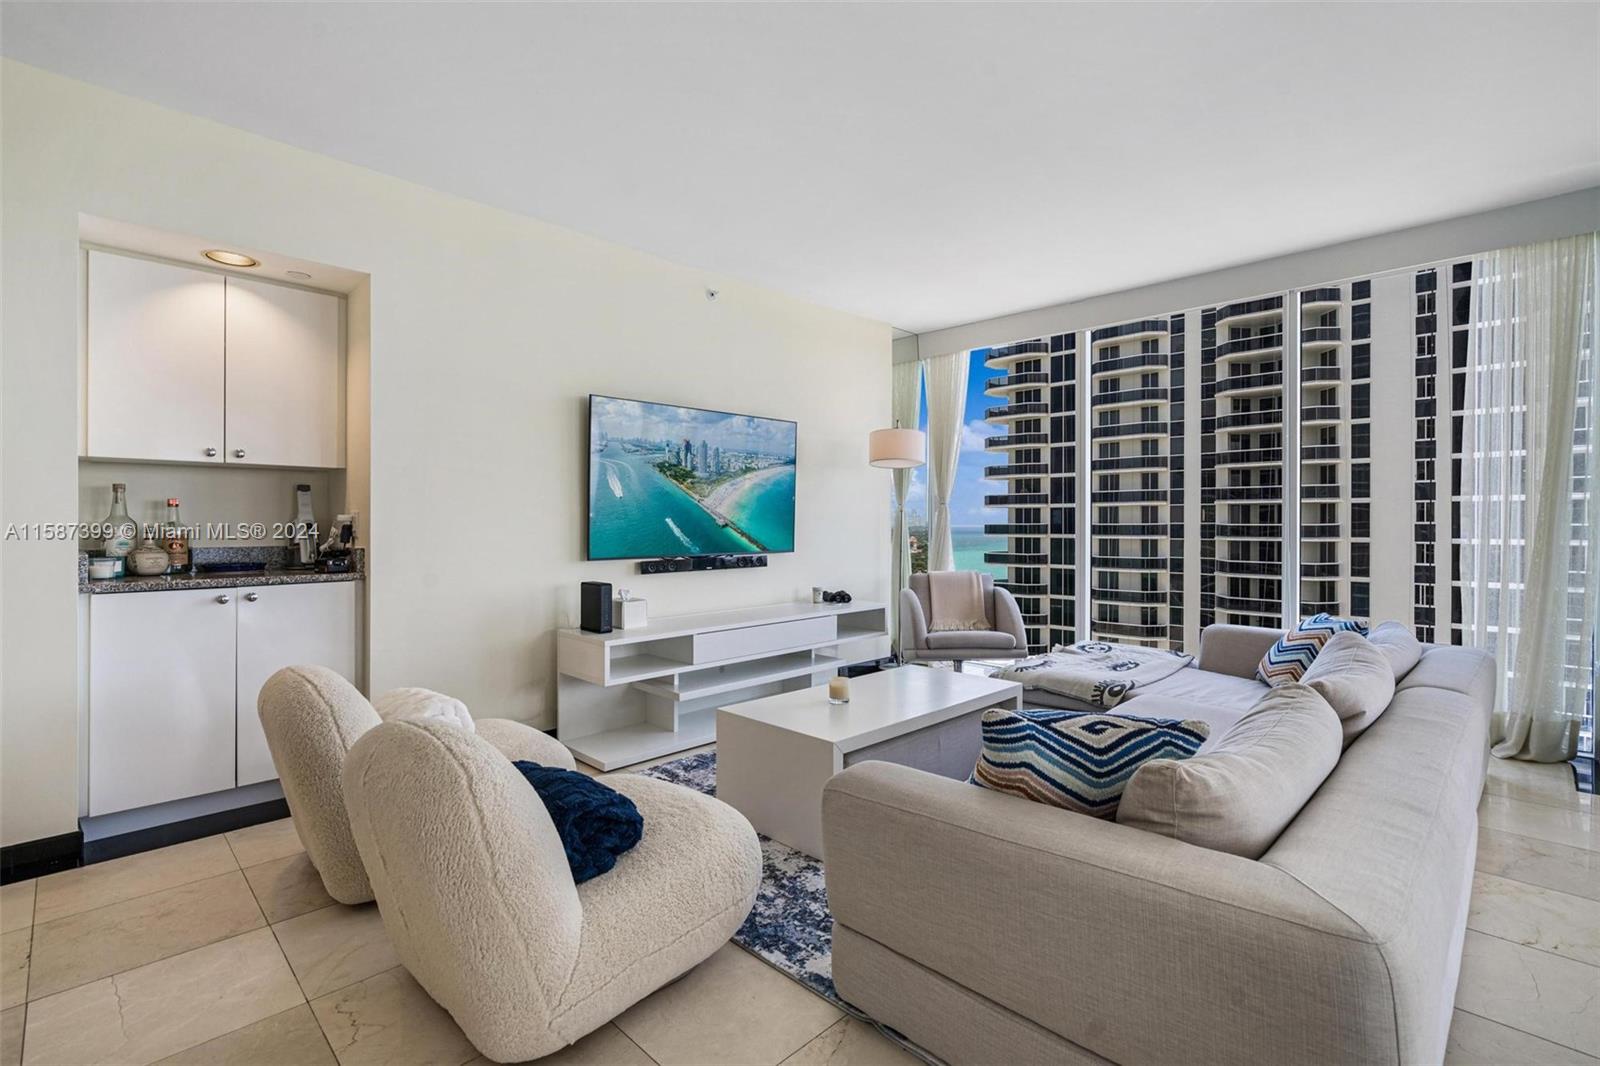
$695,000
2
bds
|
2
ba
|
1,121
sqft
|
built
1980
2401 Collins Ave, Miami Beach, FL 33140
$-2,049
Cash flow
-15.4%
Cash-on-Cash Return
2.7%
Cap rate
0.6%
Rent to Value Ratio
Active
$195,000
1
bds
|
1
ba
|
493
sqft
|
built
1940
7928 Harding Ave, Miami Beach, FL 33141
$-355
Cash flow
-9.5%
Cash-on-Cash Return
4.1%
Cap rate
0.9%
Rent to Value Ratio
Active
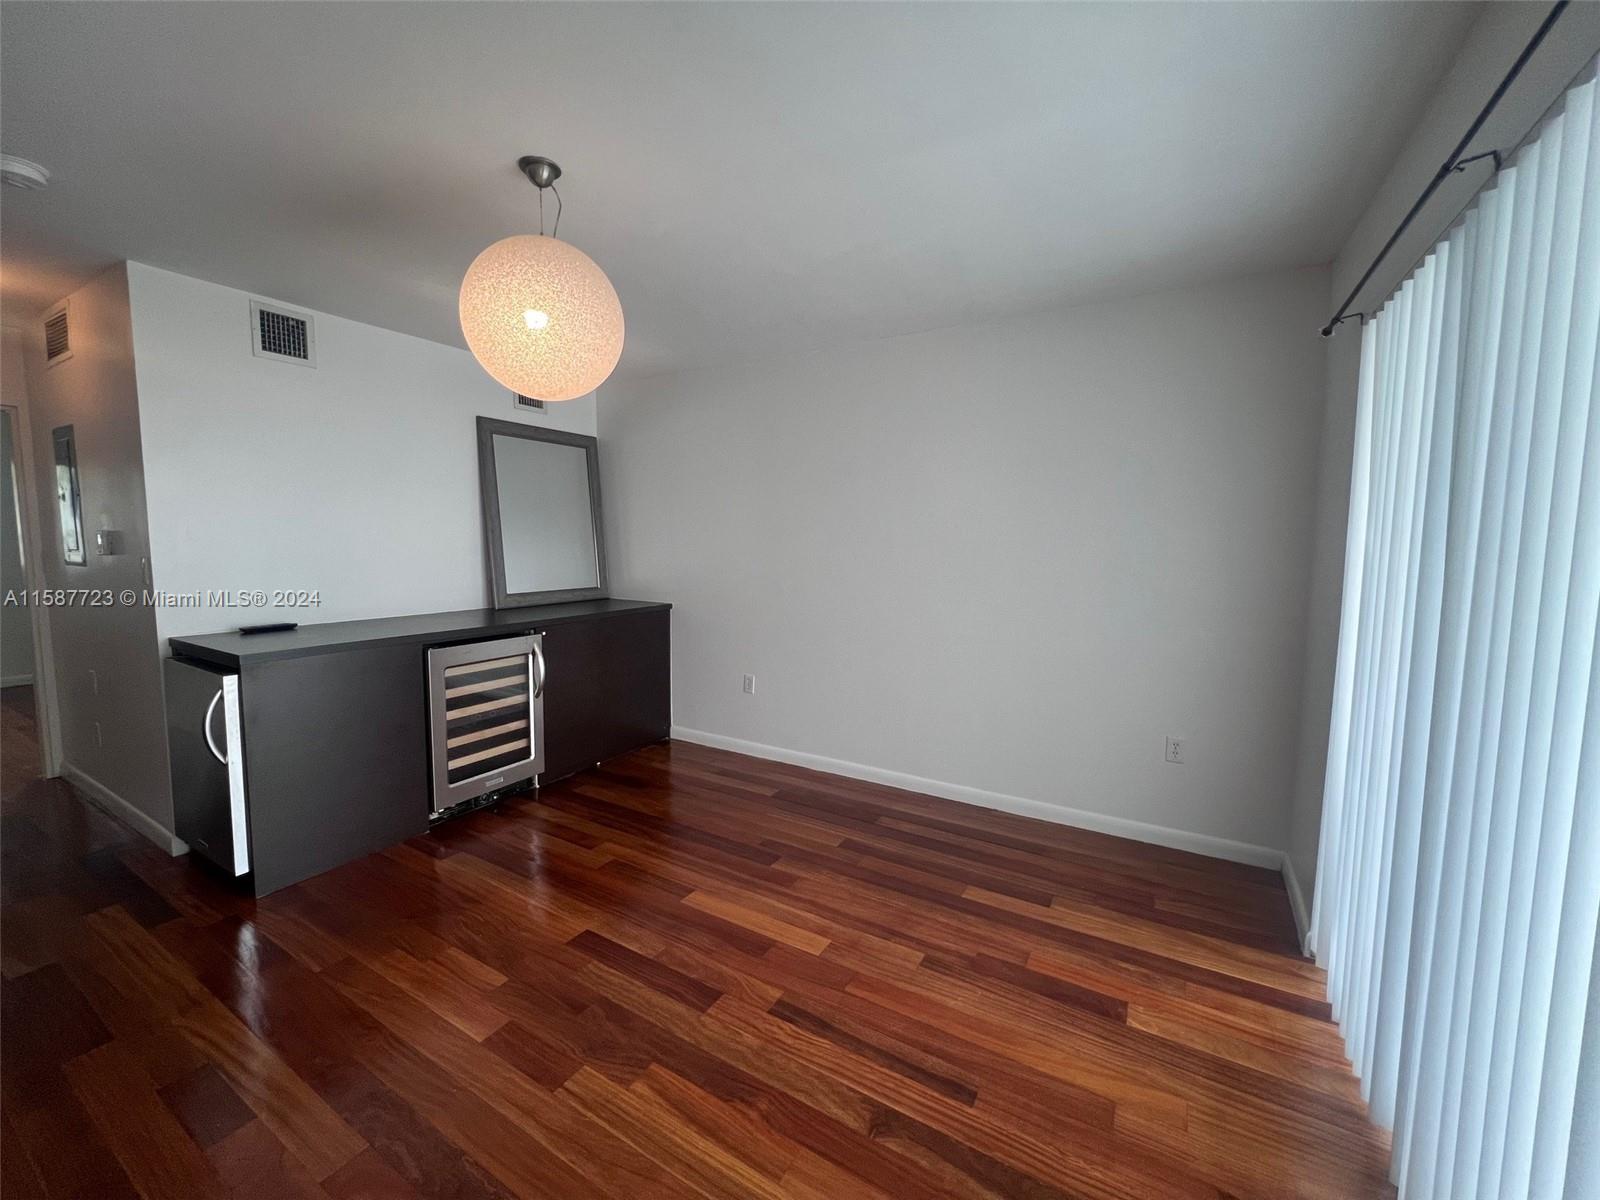
$1,075,000
1
bds
|
1
ba
|
850
sqft
|
built
1926
2301 Collins Ave, Miami Beach, FL 33139
$-4,411
Cash flow
-21.4%
Cash-on-Cash Return
1.4%
Cap rate
0.5%
Rent to Value Ratio
Active
$1,700,000
2
bds
|
2
ba
|
1,380
sqft
|
built
2000
4779 Collins Ave, Miami Beach, FL 33140
$-7,501
Cash flow
-23.0%
Cash-on-Cash Return
1.0%
Cap rate
0.4%
Rent to Value Ratio
Active
$239,000
1
bds
|
1
ba
|
436
sqft
|
built
2008
1550 Pennsylvania Ave, Miami Beach, FL 33139
$-658
Cash flow
-14.4%
Cash-on-Cash Return
3.0%
Cap rate
0.8%
Rent to Value Ratio
Active
$259,000
1
bds
|
1
ba
|
436
sqft
|
built
2016
1560 Meridian Ave, Miami Beach, FL 33139
$-821
Cash flow
-16.5%
Cash-on-Cash Return
2.5%
Cap rate
0.8%
Rent to Value Ratio
Active
$465,000
1
bds
|
1
ba
|
550
sqft
|
built
1965
100 Lincoln Rd, Miami Beach, FL 33139
$-1,238
Cash flow
-13.9%
Cash-on-Cash Return
3.1%
Cap rate
0.7%
Rent to Value Ratio

Active
$234,900
1
bds
|
1
ba
|
610
sqft
|
built
1940
1610 Michigan Ave, Miami Beach, FL 33139
$-924
Cash flow
-20.5%
Cash-on-Cash Return
1.6%
Cap rate
0.8%
Rent to Value Ratio
Active
$2,150,000
2
bds
|
2
ba
|
960
sqft
|
built
1926
2301 Collins Ave, Miami Beach, FL 33139
$-7,697
Cash flow
-18.7%
Cash-on-Cash Return
2.0%
Cap rate
0.5%
Rent to Value Ratio
Active
$925,000
2
bds
|
2
ba
|
1,048
sqft
|
built
2008
6801 Collins Ave, Miami Beach, FL 33141
$-6,937
Cash flow
-39.1%
Cash-on-Cash Return
-2.7%
Cap rate
0.4%
Rent to Value Ratio
Active
$415,000
1
bds
|
1
ba
|
530
sqft
|
built
2013
6700 Indian Creek Dr, Miami Beach, FL 33141
$-1,600
Cash flow
-20.1%
Cash-on-Cash Return
1.7%
Cap rate
0.8%
Rent to Value Ratio
Active
$230,000
1
bds
|
1
ba
|
411
sqft
|
built
1940
760 Jefferson Ave, Miami Beach, FL 33139
$-755
Cash flow
-17.1%
Cash-on-Cash Return
2.3%
Cap rate
0.7%
Rent to Value Ratio
Active
$249,000
1
bds
|
1
ba
|
648
sqft
|
built
1973
2000 Biarritz Dr, Miami Beach, FL 33141
$-745
Cash flow
-15.6%
Cash-on-Cash Return
2.7%
Cap rate
0.7%
Rent to Value Ratio
Active
$649,999
2
bds
|
2
ba
|
1,139
sqft
|
built
1983
2457 Collins Ave, Miami Beach, FL 33140
$-2,505
Cash flow
-20.1%
Cash-on-Cash Return
1.7%
Cap rate
0.6%
Rent to Value Ratio
Active
$440,000
bds
|
1
ba
|
550
sqft
|
built
1967
5401 Collins Ave, Miami Beach, FL 33140
$-1,846
Cash flow
-21.9%
Cash-on-Cash Return
1.2%
Cap rate
0.6%
Rent to Value Ratio
Active
$485,000
1
bds
|
1
ba
|
662
sqft
|
built
2008
6801 Collins Ave, Miami Beach, FL 33141
$-2,882
Cash flow
-31.0%
Cash-on-Cash Return
-0.8%
Cap rate
0.7%
Rent to Value Ratio
Active
$2,999,999
3
bds
|
4
ba
|
2,395
sqft
|
built
2004
6101 Aqua Ave, Miami Beach, FL 33141
$-16,436
Cash flow
-28.6%
Cash-on-Cash Return
-0.3%
Cap rate
0.3%
Rent to Value Ratio
Active
$417,800
bds
|
1
ba
|
477
sqft
|
built
2008
1100 West Ave, Miami Beach, FL 33139
$-1,350
Cash flow
-16.9%
Cash-on-Cash Return
2.4%
Cap rate
0.9%
Rent to Value Ratio
Active
$350,000
bds
|
1
ba
|
570
sqft
|
built
1967
5401 Collins Ave, Miami Beach, FL 33140
$-1,564
Cash flow
-23.3%
Cash-on-Cash Return
0.9%
Cap rate
0.7%
Rent to Value Ratio
Active
$3,500,000
2
bds
|
2
ba
|
1,316
sqft
|
built
2004
101 20th St, Miami Beach, FL 33139
$-16,048
Cash flow
-23.9%
Cash-on-Cash Return
0.8%
Cap rate
0.3%
Rent to Value Ratio
Active
$1,100,000
2
bds
|
3
ba
|
1,328
sqft
|
built
2005
2001 Meridian Ave, Miami Beach, FL 33139
$-2,717
Cash flow
-12.9%
Cash-on-Cash Return
3.3%
Cap rate
0.8%
Rent to Value Ratio

Active
$500,000
bds
|
1
ba
|
400
sqft
|
built
1966
5445 Collins Ave, Miami Beach, FL 33140
$-1,942
Cash flow
-20.3%
Cash-on-Cash Return
1.6%
Cap rate
0.6%
Rent to Value Ratio
Active
$10,500,000
4
bds
|
4
ba
|
4,097
sqft
|
built
1956
3633 Flamingo Dr, Miami Beach, FL 33140
$-50,300
Cash flow
-25.0%
Cash-on-Cash Return
0.5%
Cap rate
0.1%
Rent to Value Ratio
Active
$3,500,000
2
bds
|
3
ba
|
1,480
sqft
|
built
1926
2301 Collins Ave, Miami Beach, FL 33139
$-16,803
Cash flow
-25.0%
Cash-on-Cash Return
0.5%
Cap rate
0.3%
Rent to Value Ratio
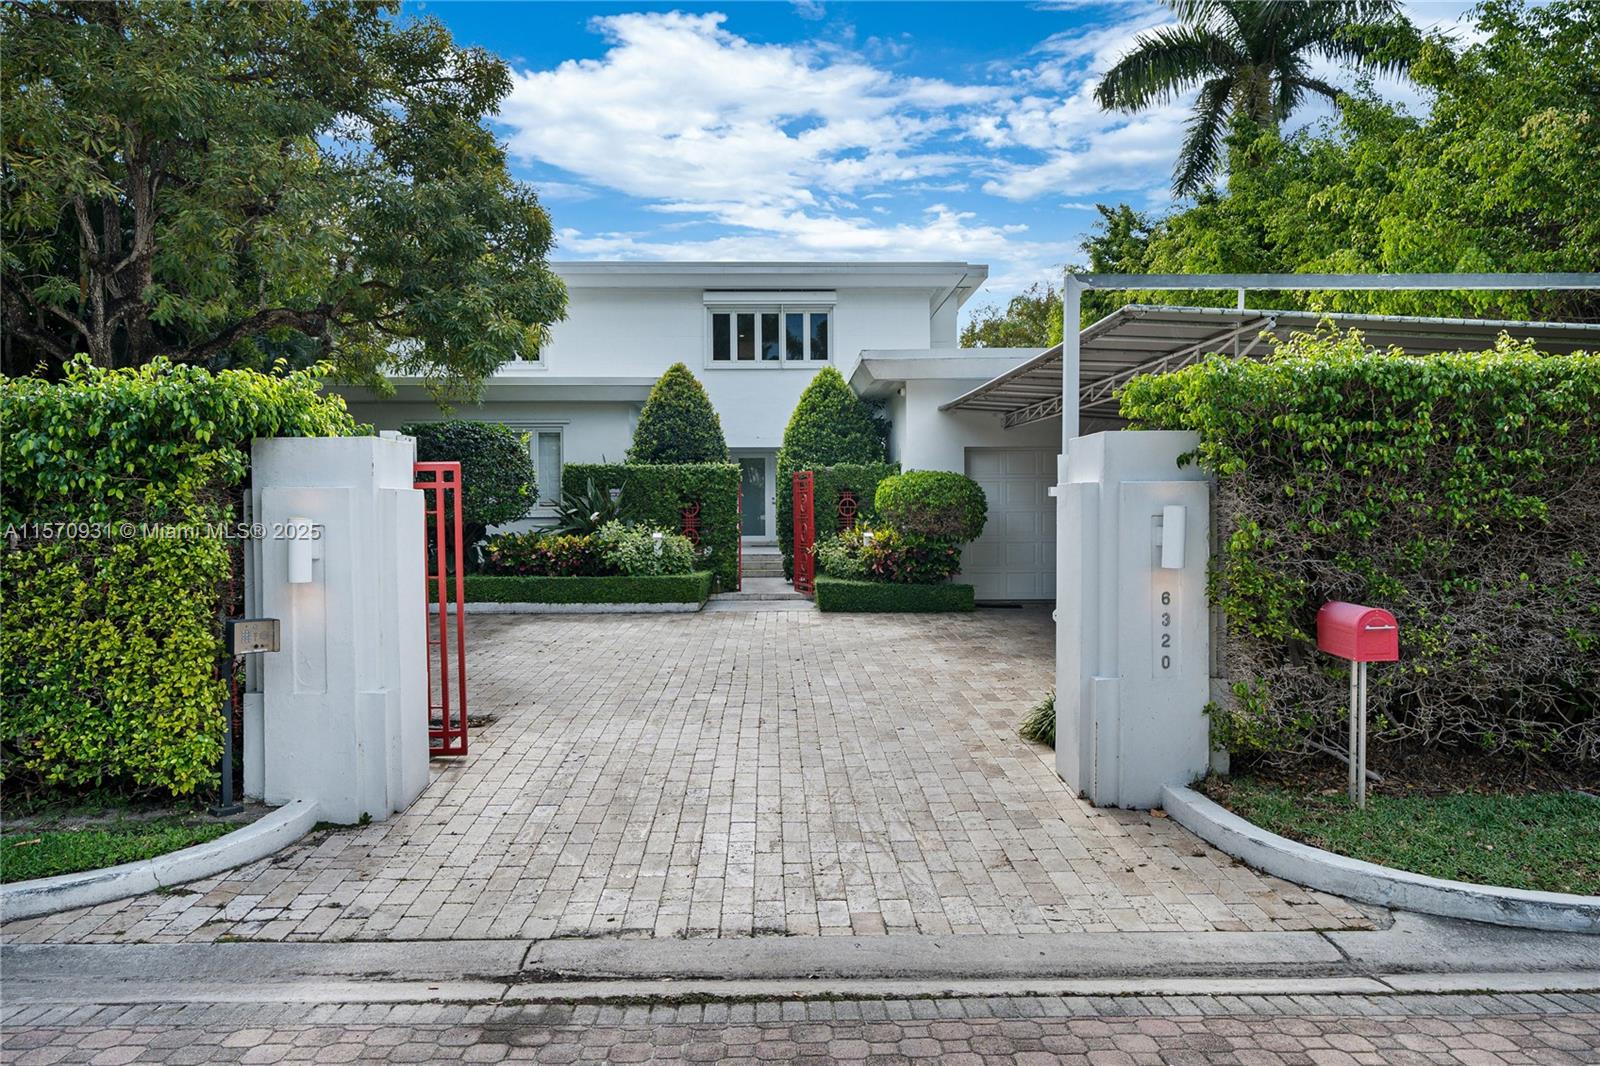
Active
$12,500,000
7
bds
|
6
ba
|
5,811
sqft
|
built
1948
6320 Allison Rd, Miami Beach, FL 33141
$-66,294
Cash flow
-27.7%
Cash-on-Cash Return
-0.1%
Cap rate
0.1%
Rent to Value Ratio
Active
$790,000
2
bds
|
2
ba
|
1,088
sqft
|
built
1964
1100 West Ave, Miami Beach, FL 33139
$-4,165
Cash flow
-27.5%
Cash-on-Cash Return
0.0%
Cap rate
0.8%
Rent to Value Ratio
Active
$209,000
1
bds
|
1
ba
|
470
sqft
|
built
1925
842 Meridian Ave, Miami Beach, FL 33139
$-740
Cash flow
-18.5%
Cash-on-Cash Return
2.0%
Cap rate
0.9%
Rent to Value Ratio
Active
$1,025,000
3
bds
|
2
ba
|
1,700
sqft
|
built
2010
6000 Collins Ave, Miami Beach, FL 33140
$-3,877
Cash flow
-19.7%
Cash-on-Cash Return
1.7%
Cap rate
0.6%
Rent to Value Ratio
Active
$305,000
bds
|
1
ba
|
552
sqft
|
built
1965
1200 West Ave, Miami Beach, FL 33139
$-382
Cash flow
-6.5%
Cash-on-Cash Return
4.8%
Cap rate
0.7%
Rent to Value Ratio
Active
$238,000
1
bds
|
1
ba
|
470
sqft
|
built
1925
934 Michigan Ave, Miami Beach, FL 33139
$-806
Cash flow
-17.7%
Cash-on-Cash Return
2.2%
Cap rate
0.7%
Rent to Value Ratio
Active
$495,000
1
bds
|
1
ba
|
656
sqft
|
built
1970
345 Ocean Dr, Miami Beach, FL 33139
$-517
Cash flow
-5.4%
Cash-on-Cash Return
5.0%
Cap rate
0.6%
Rent to Value Ratio
Active
$220,000
bds
|
1
ba
|
560
sqft
|
built
1966
800 West Ave, Miami Beach, FL 33139
$-744
Cash flow
-17.6%
Cash-on-Cash Return
2.2%
Cap rate
0.9%
Rent to Value Ratio
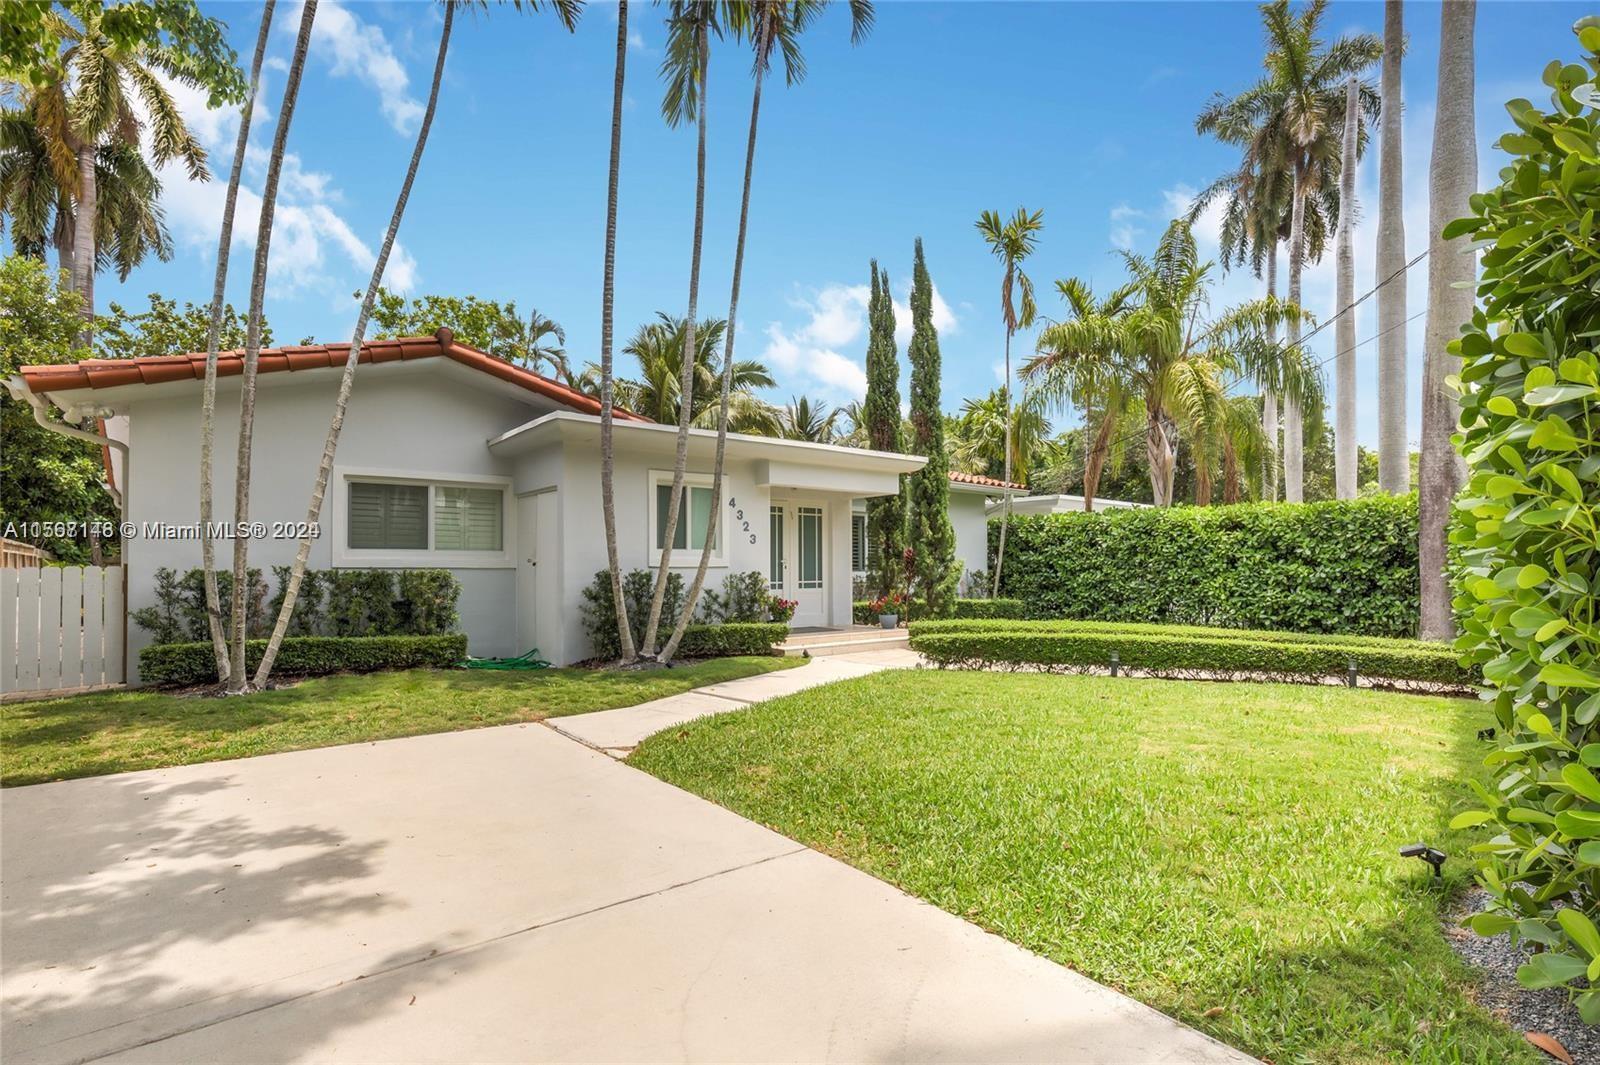
Active
$2,100,000
3
bds
|
3
ba
|
2,440
sqft
|
built
1956
4323 N Bay Rd, Miami Beach, FL 33140
$-6,402
Cash flow
-15.9%
Cash-on-Cash Return
2.6%
Cap rate
0.5%
Rent to Value Ratio
Active
$290,000
1
bds
|
1
ba
|
467
sqft
|
built
1941
811 Jefferson Ave, Miami Beach, FL 33139
$-1,122
Cash flow
-20.2%
Cash-on-Cash Return
1.6%
Cap rate
0.7%
Rent to Value Ratio
Active
$218,000
1
bds
|
1
ba
|
666
sqft
|
built
1960
1185 Marseille Dr, Miami Beach, FL 33141
$-690
Cash flow
-16.5%
Cash-on-Cash Return
2.5%
Cap rate
0.9%
Rent to Value Ratio

Active
$1,450,000
bds
|
1
ba
|
600
sqft
|
built
1926
2301 Collins Ave, Miami Beach, FL 33139
$-3,476
Cash flow
-12.5%
Cash-on-Cash Return
3.4%
Cap rate
0.6%
Rent to Value Ratio
Active
$249,999
1
bds
|
1
ba
|
580
sqft
|
built
1925
536 14th St, Miami Beach, FL 33139
$-199
Cash flow
-4.2%
Cash-on-Cash Return
5.3%
Cap rate
0.8%
Rent to Value Ratio
Active
$1,700,000
1
bds
|
2
ba
|
933
sqft
|
built
2009
2201 Collins Ave, Miami Beach, FL 33139
$-11,512
Cash flow
-35.3%
Cash-on-Cash Return
-1.8%
Cap rate
0.4%
Rent to Value Ratio
Active
$395,000
2
bds
|
1
ba
|
964
sqft
|
built
1964
5005 Collins Ave, Miami Beach, FL 33140
$-1,551
Cash flow
-20.5%
Cash-on-Cash Return
1.6%
Cap rate
0.8%
Rent to Value Ratio