Miami Beach, FL Investment Properties for Sale
Browse homes for sale and investment properties in Miami Beach, FL. Refine your search by price, property type, or more.
Best cash flowing properties in Miami Beach, FL
Active
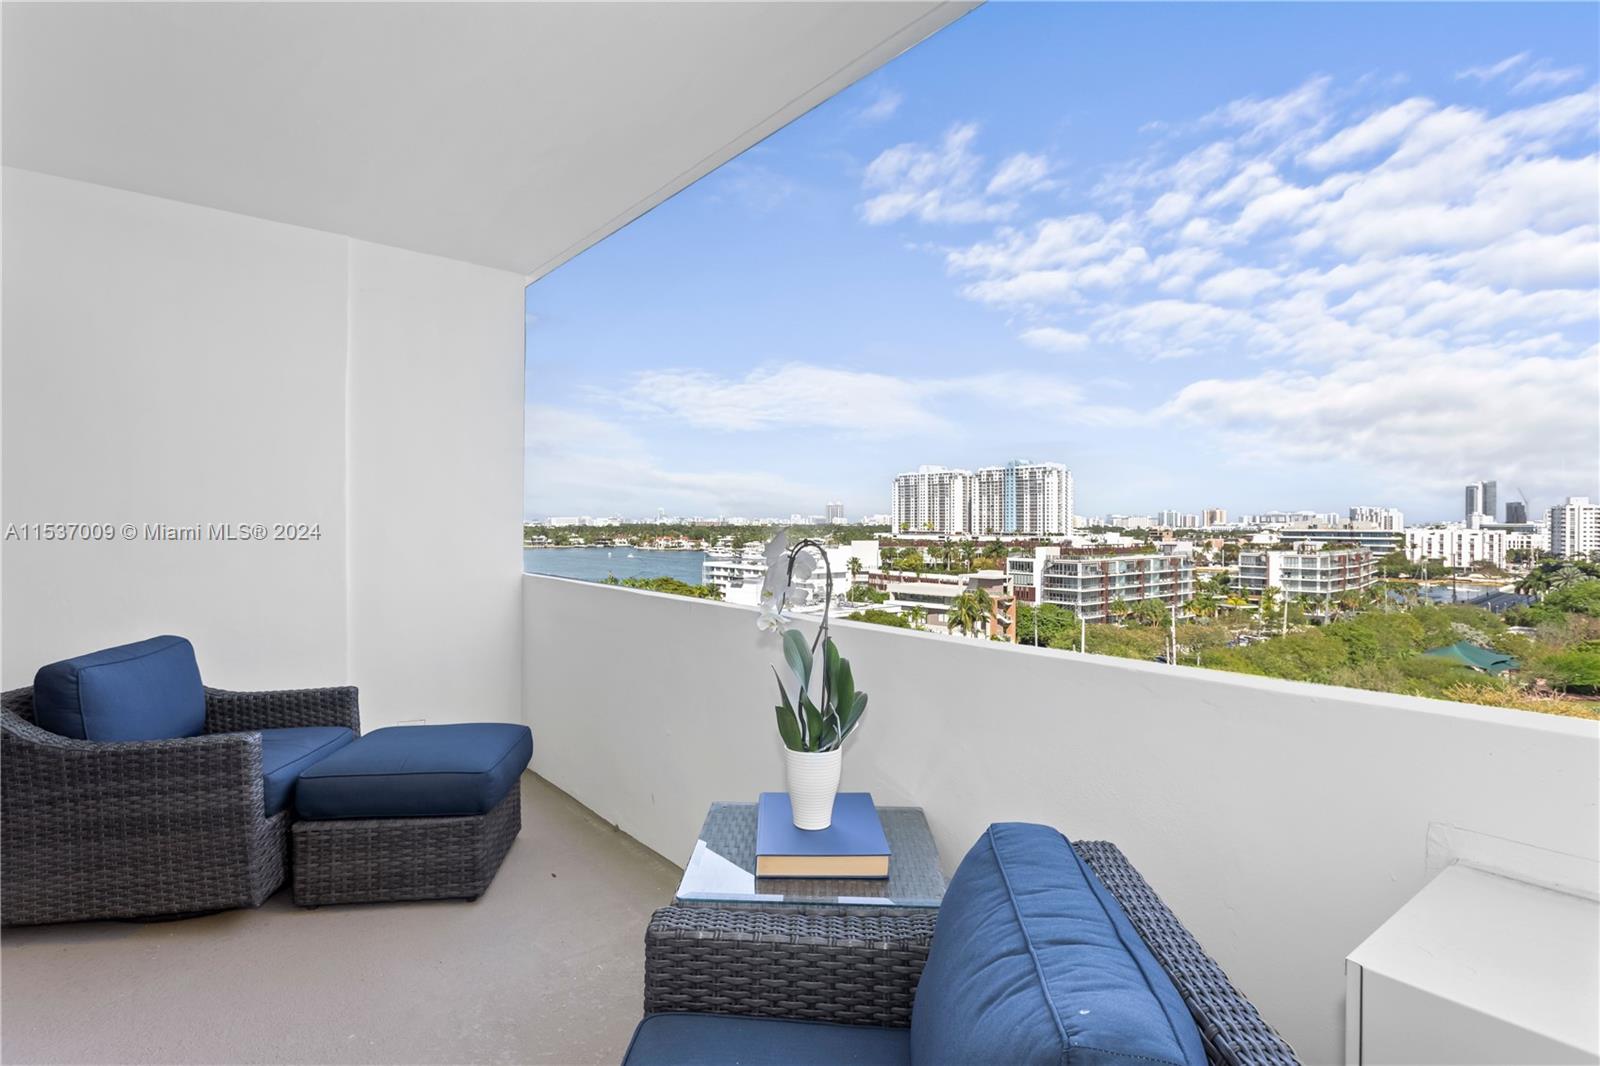
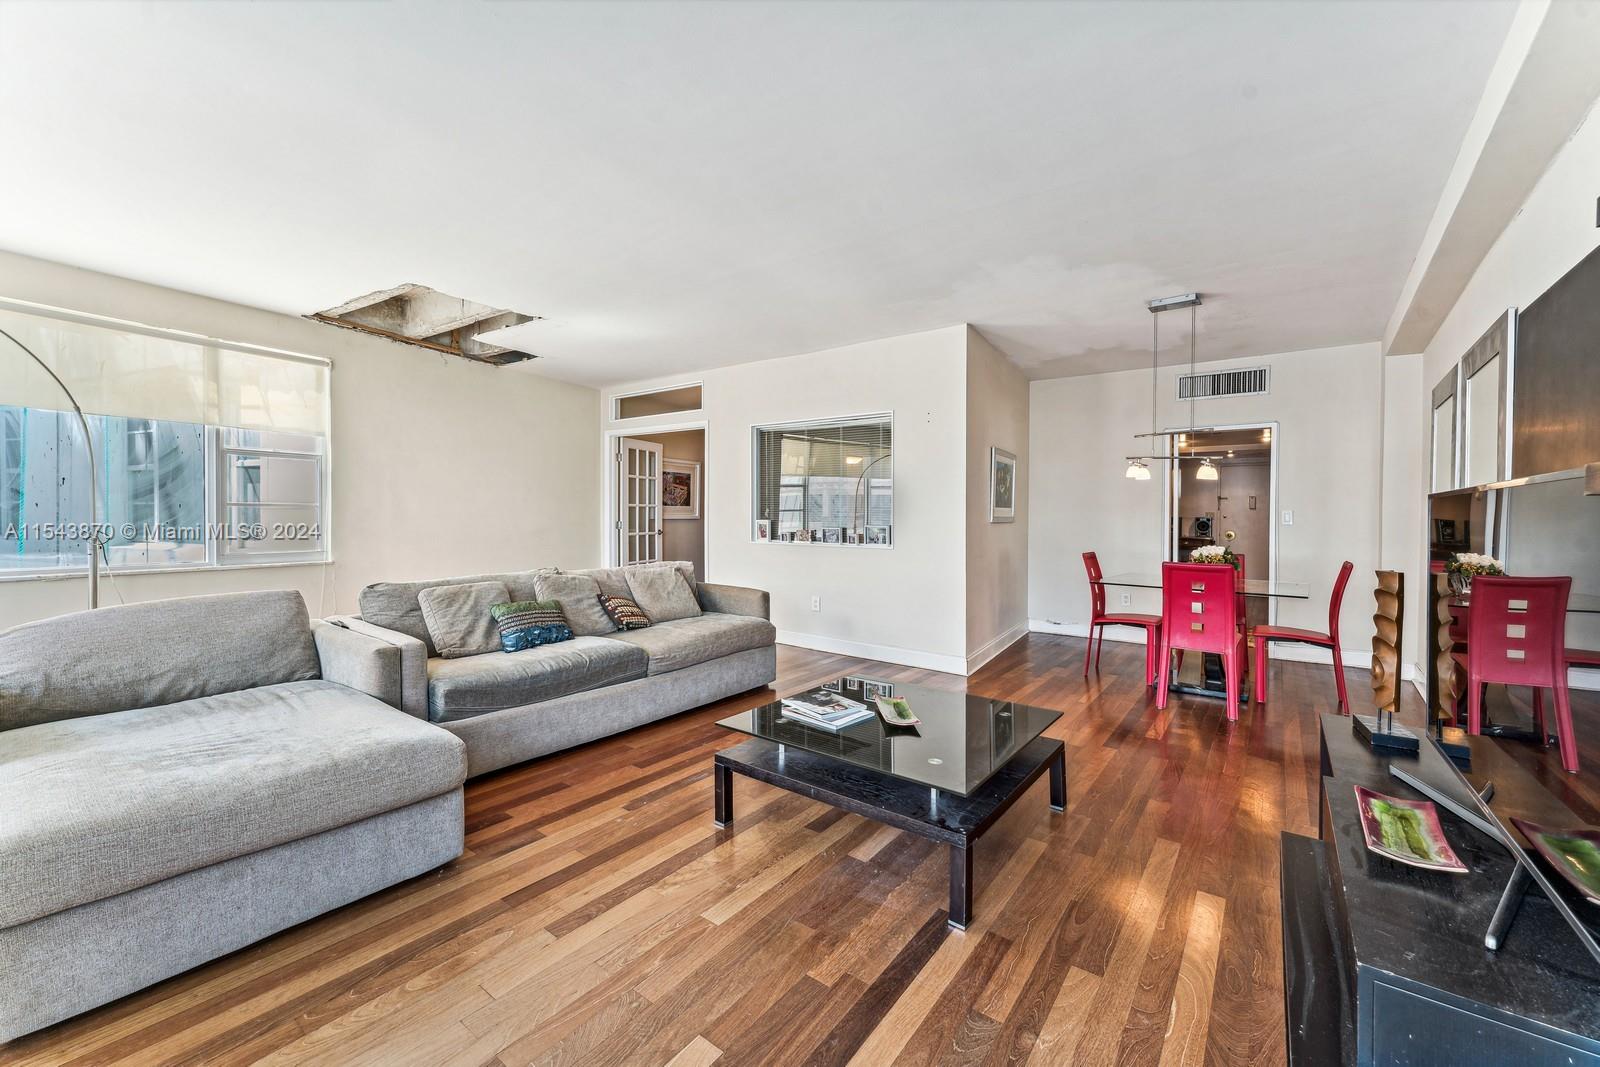
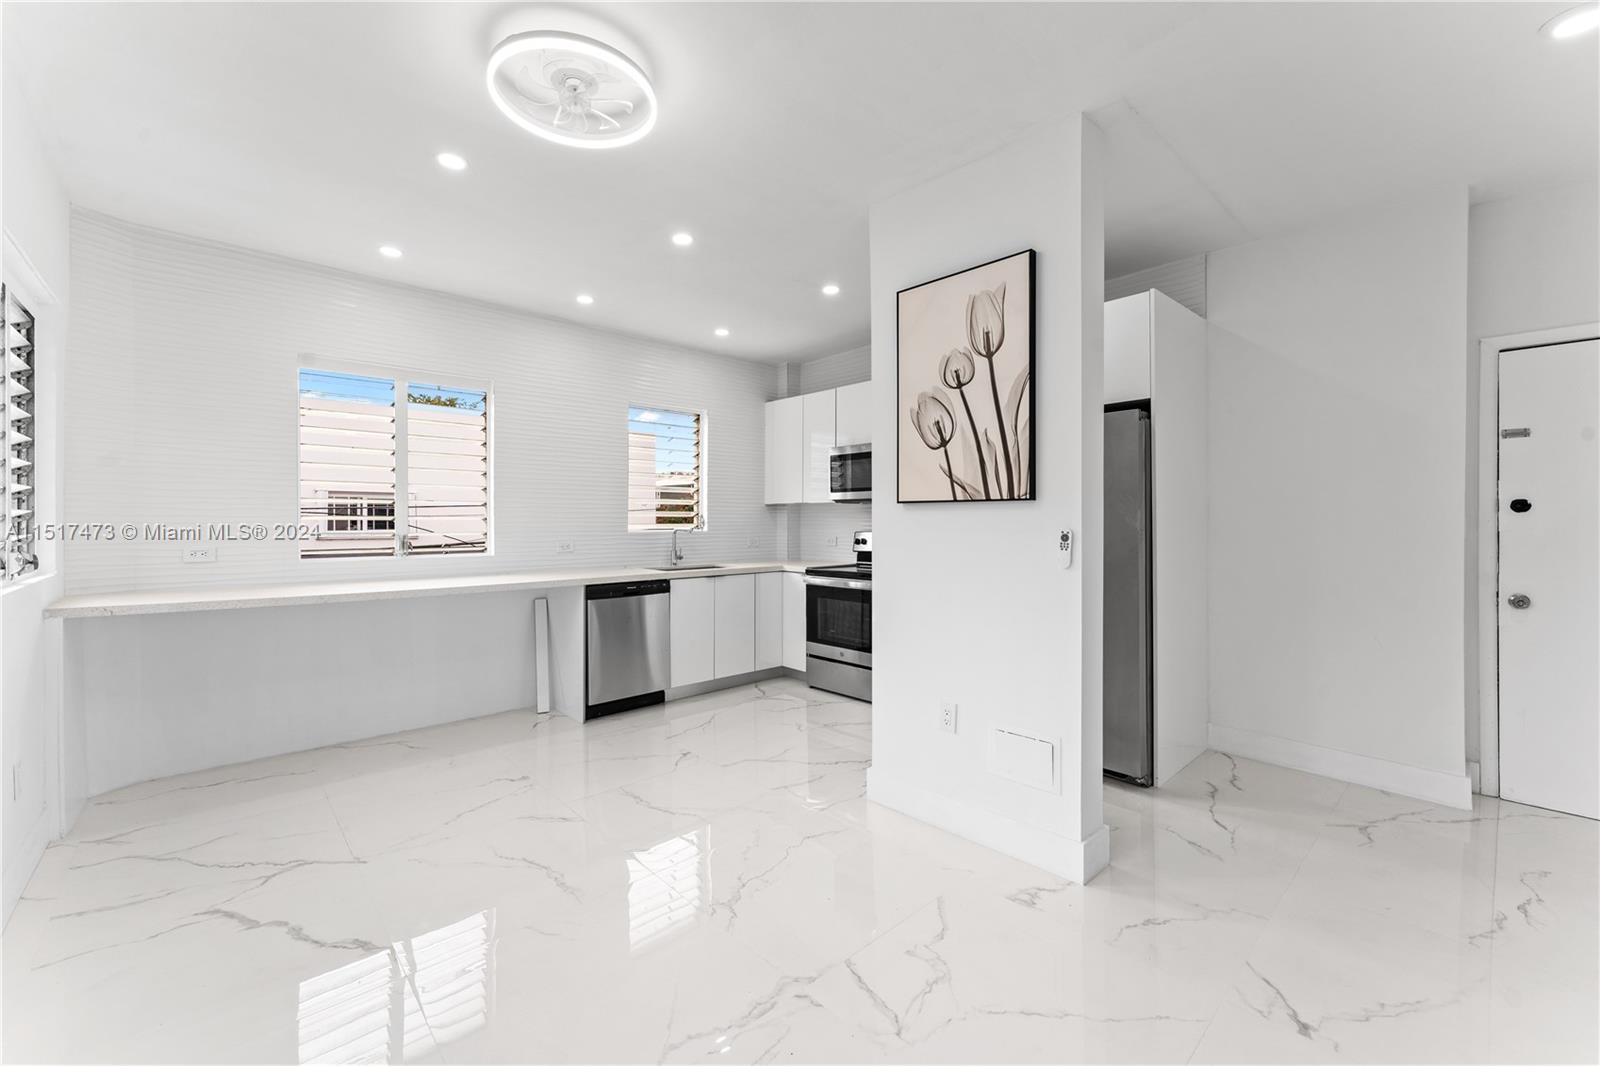
$450,000
1
bds
|
1
ba
|
861
sqft
|
built
1962
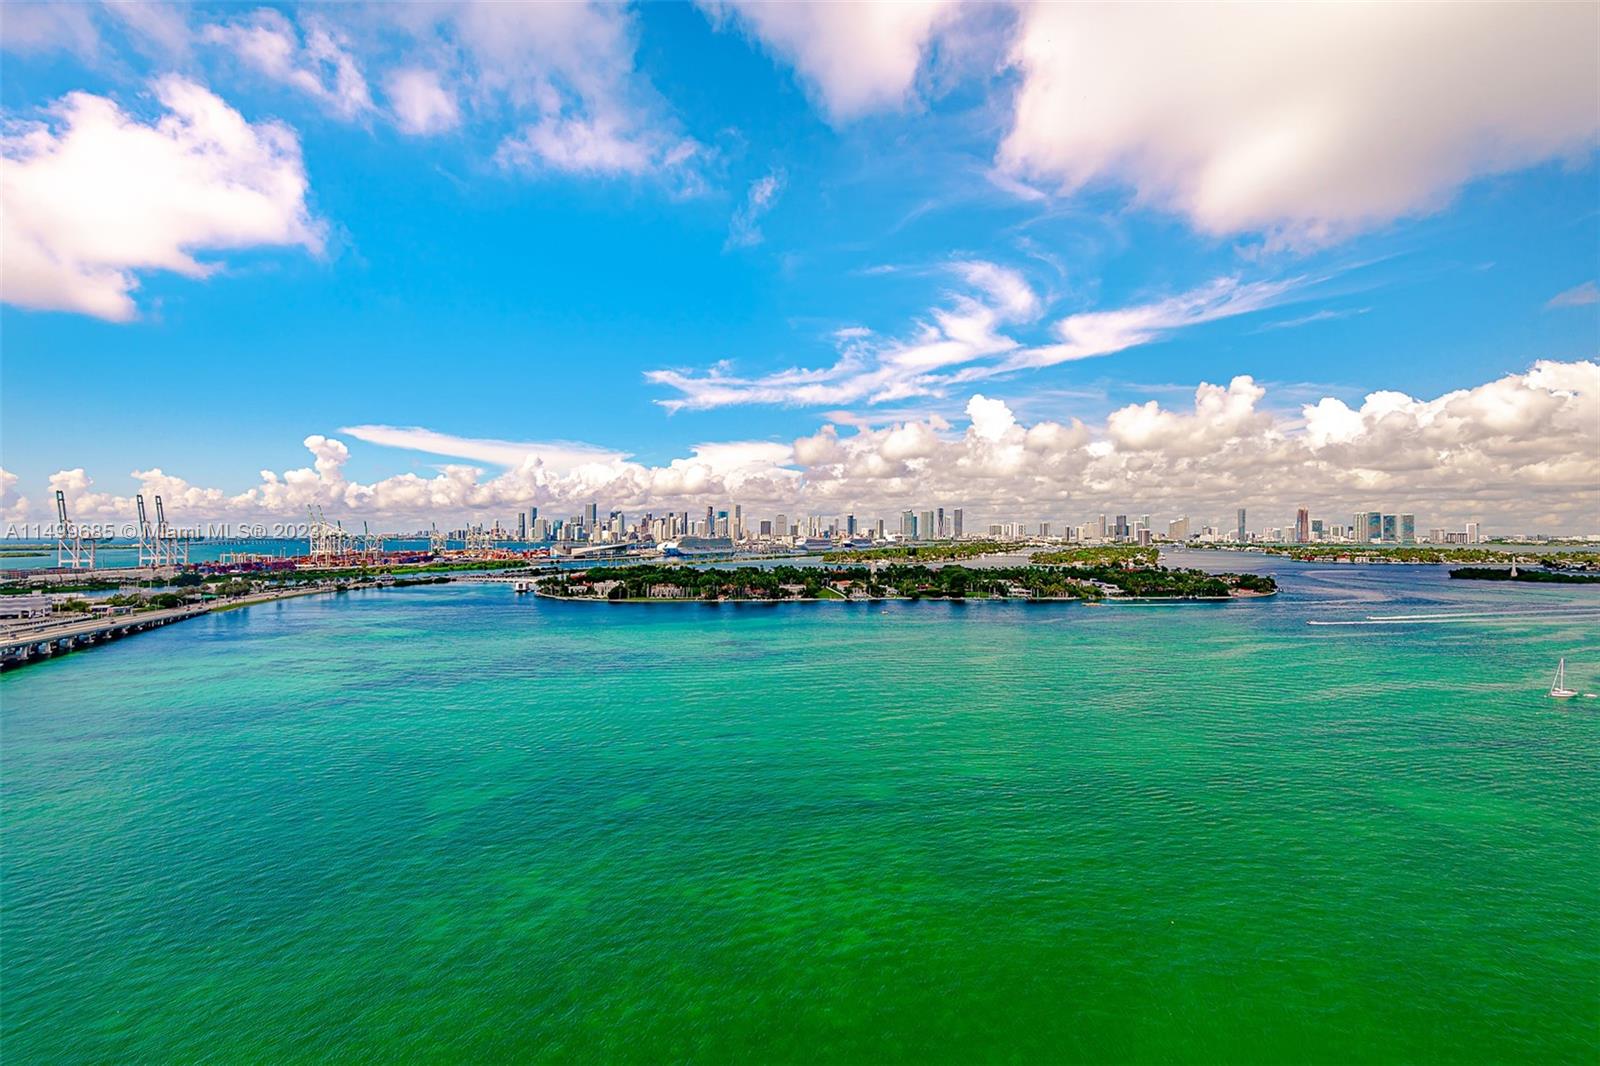
3 Island Ave, Miami Beach, FL 33139
$-81
Cash flow
-0.9%
Cash-on-Cash Return
6.1%
Cap rate
0.9%
Rent to Value Ratio
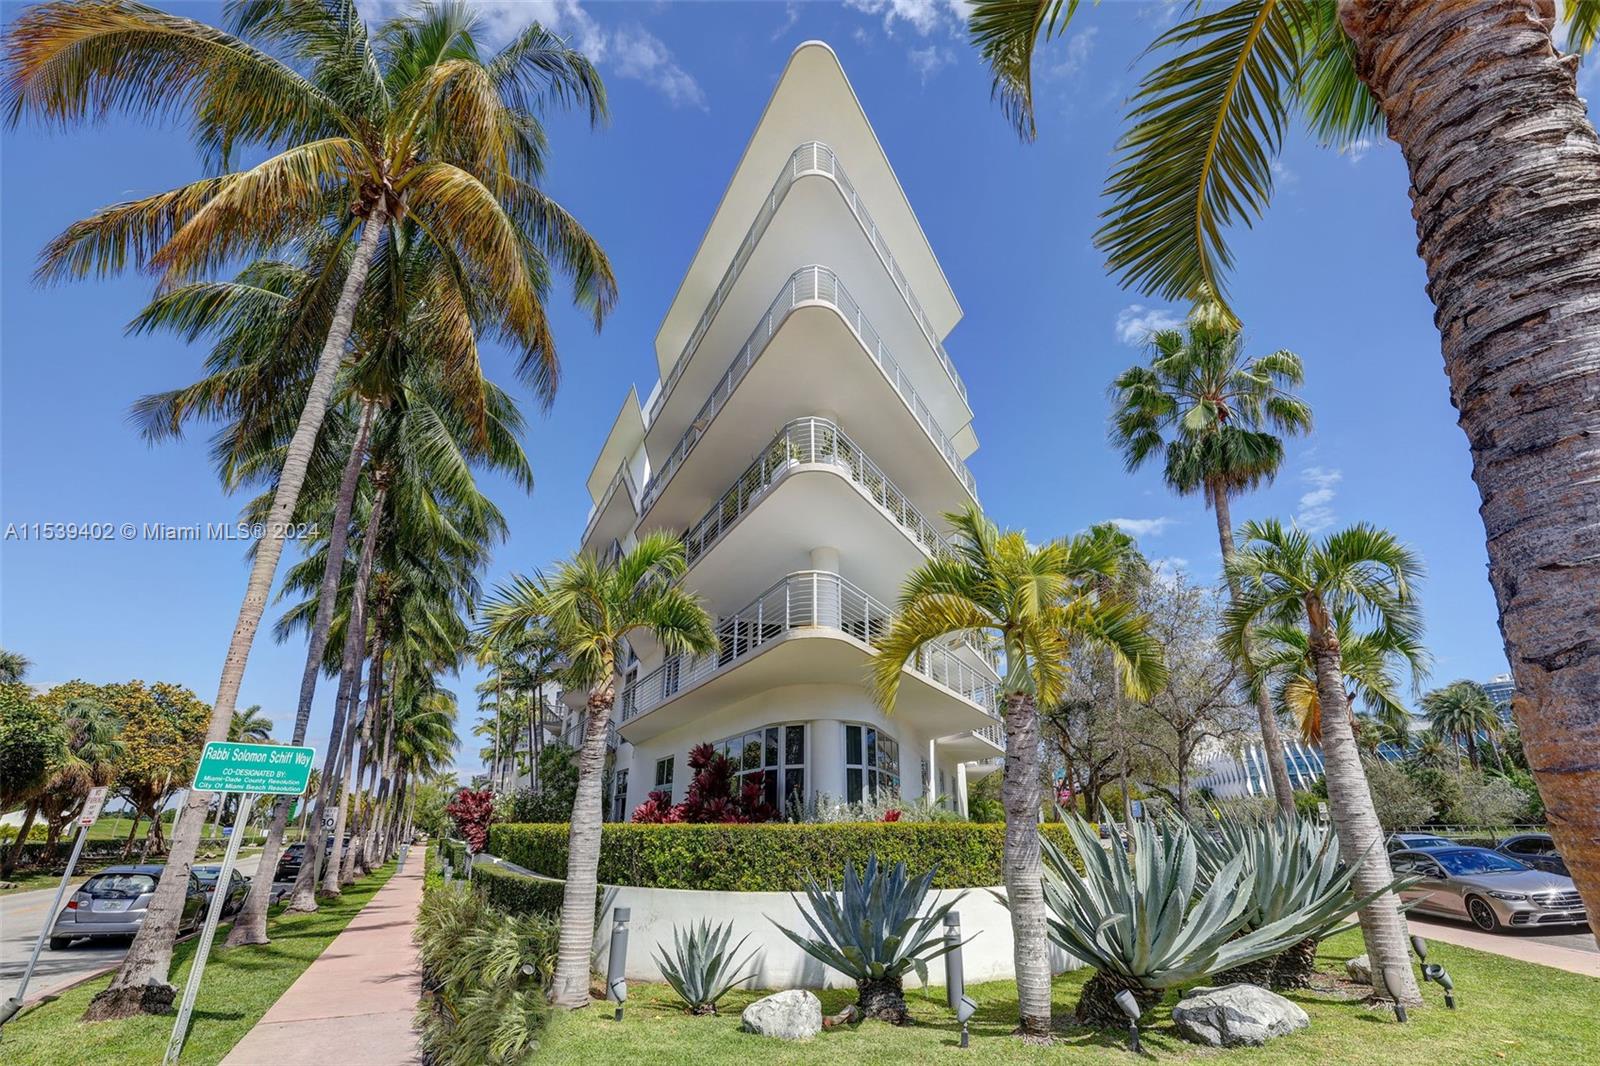
Active
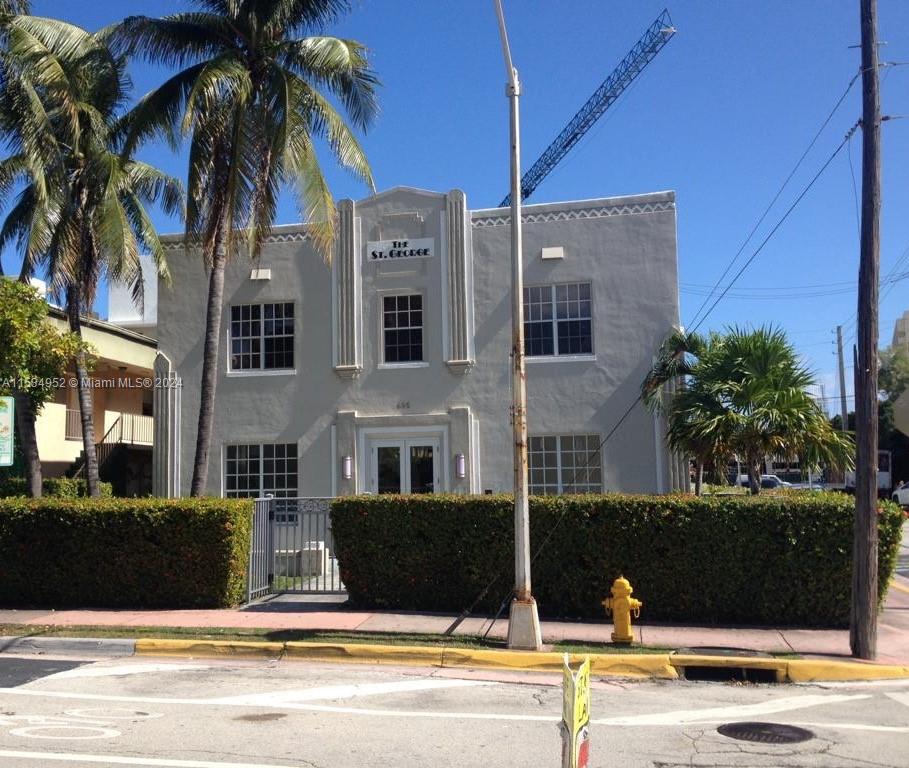
$245,000
1
bds
|
1
ba
|
440
sqft
|
built
1935
605 Euclid Ave, Miami Beach, FL 33139
$-566
Cash flow
-12.1%
Cash-on-Cash Return
3.5%
Cap rate
0.8%
Rent to Value Ratio
1,968 out of 2,170 properties for sale in Miami Beach, FL
Limited Results Shown
Create a free account, or log in to reveal all property listings and enjoy the complete experience.
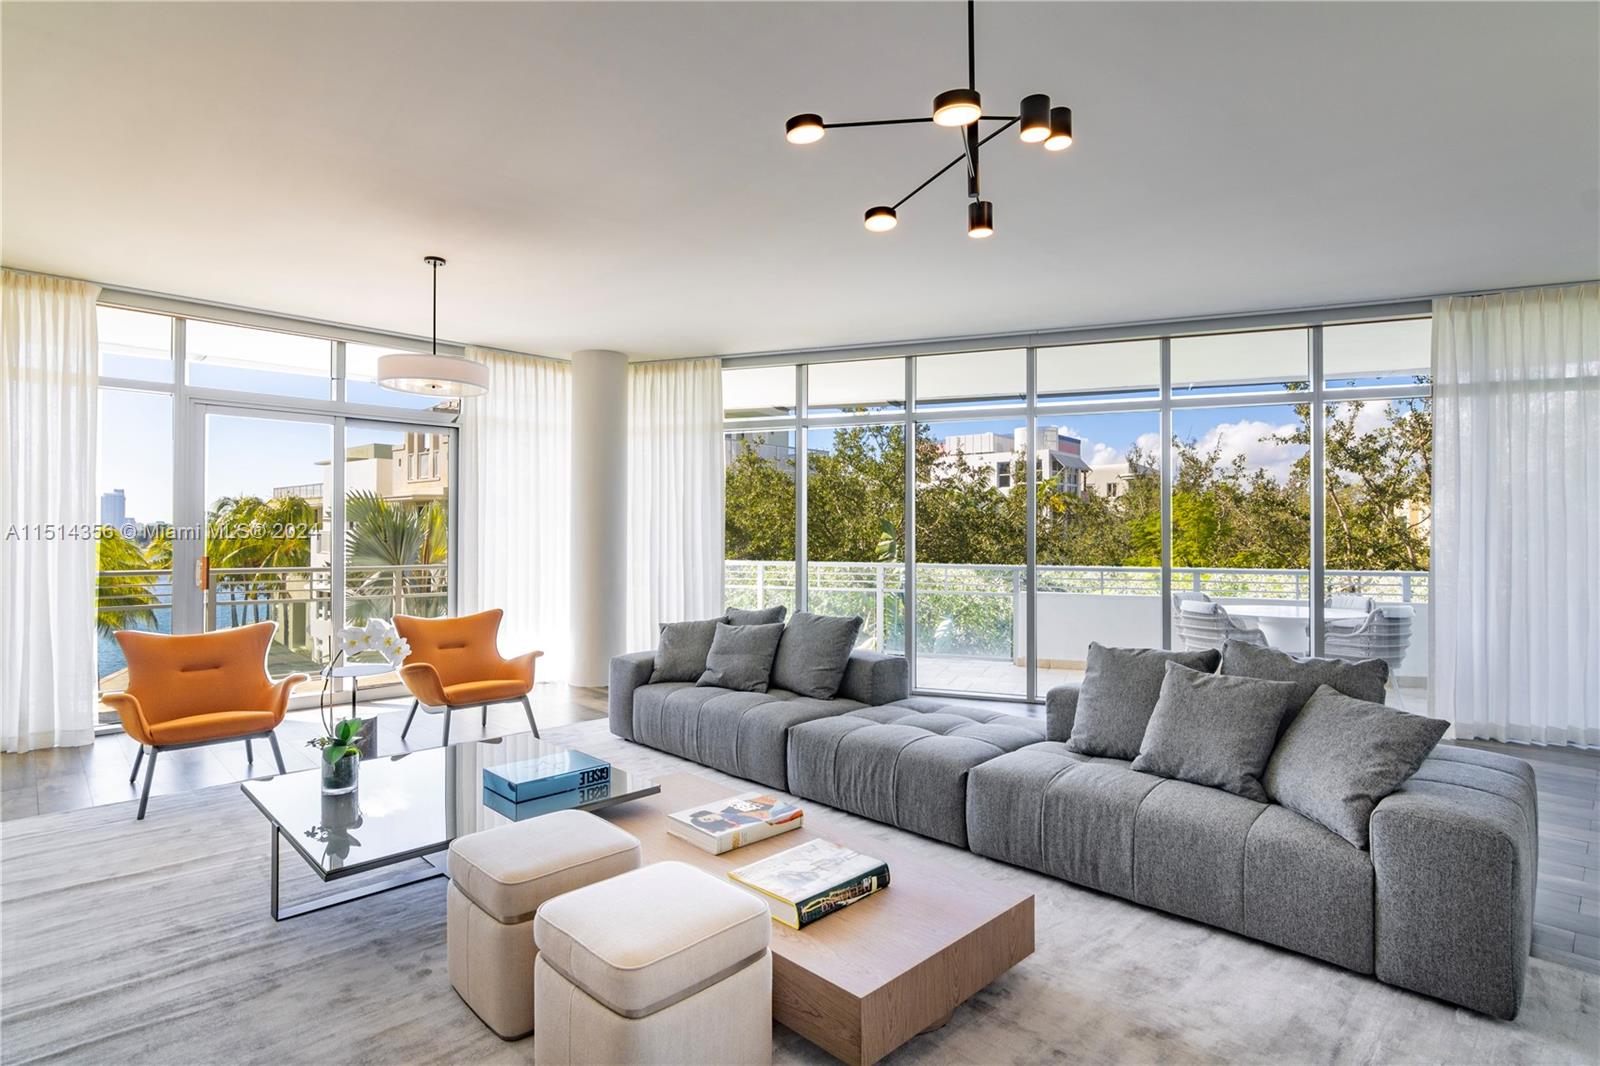
Active
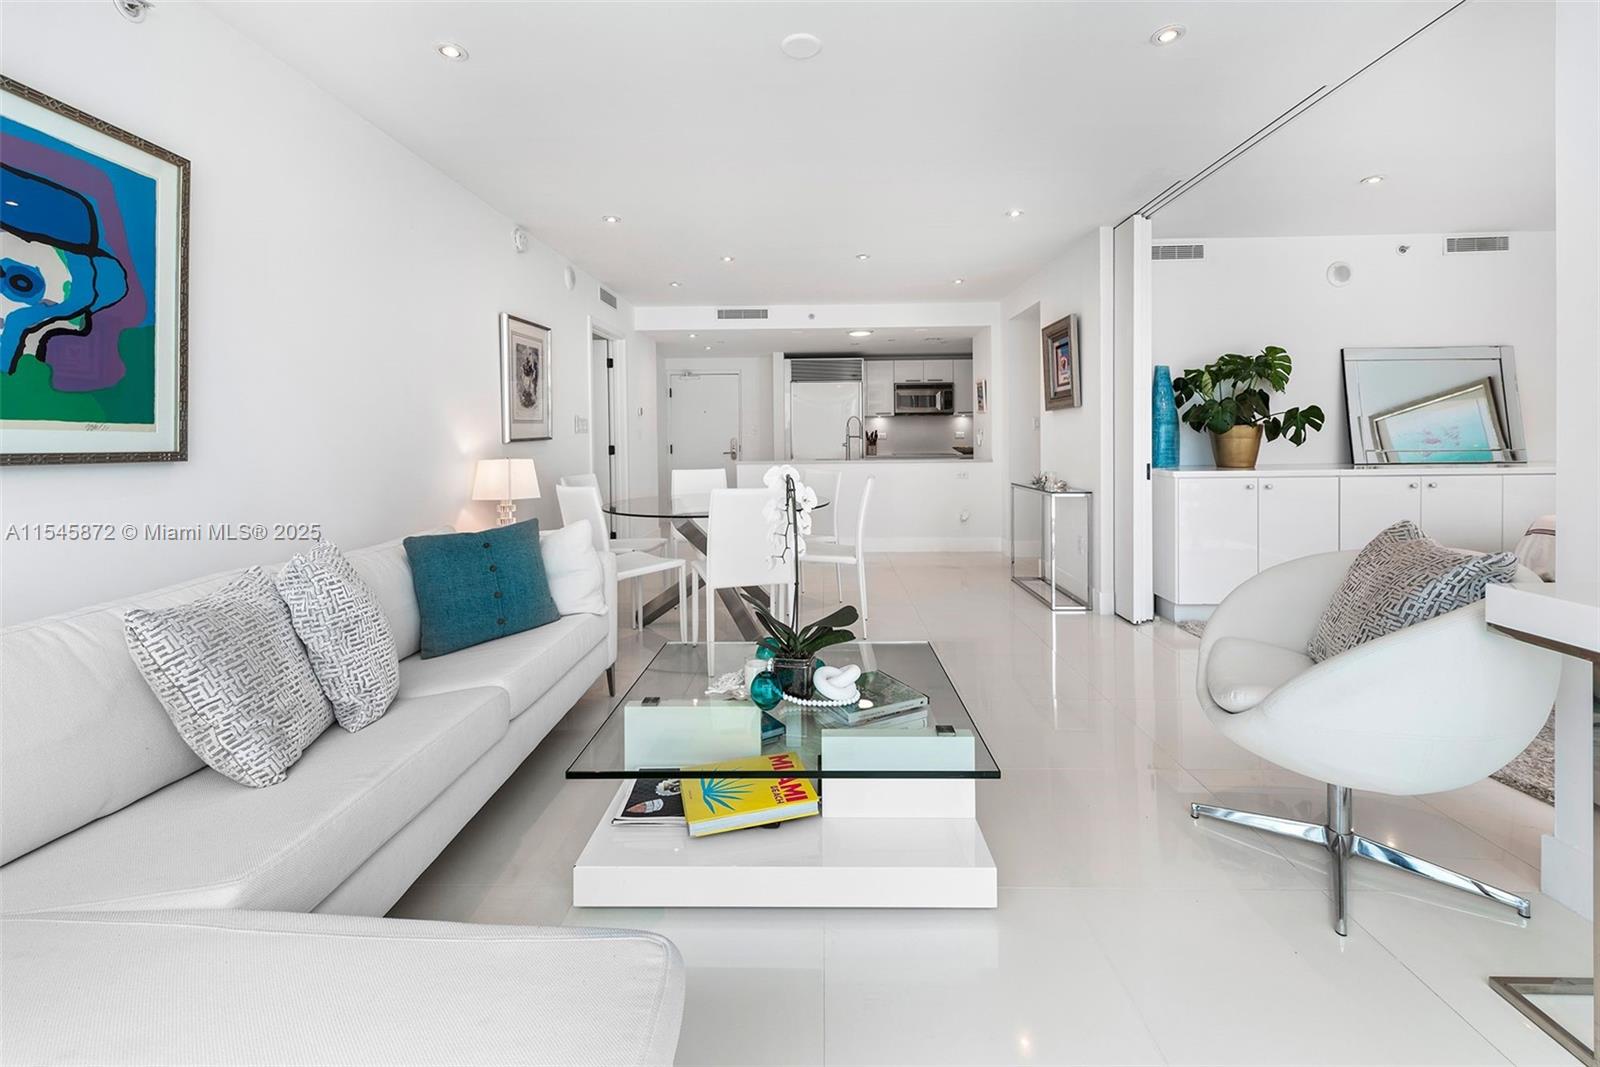
$1,699,000
2
bds
|
2
ba
|
1,103
sqft
|
built
2008
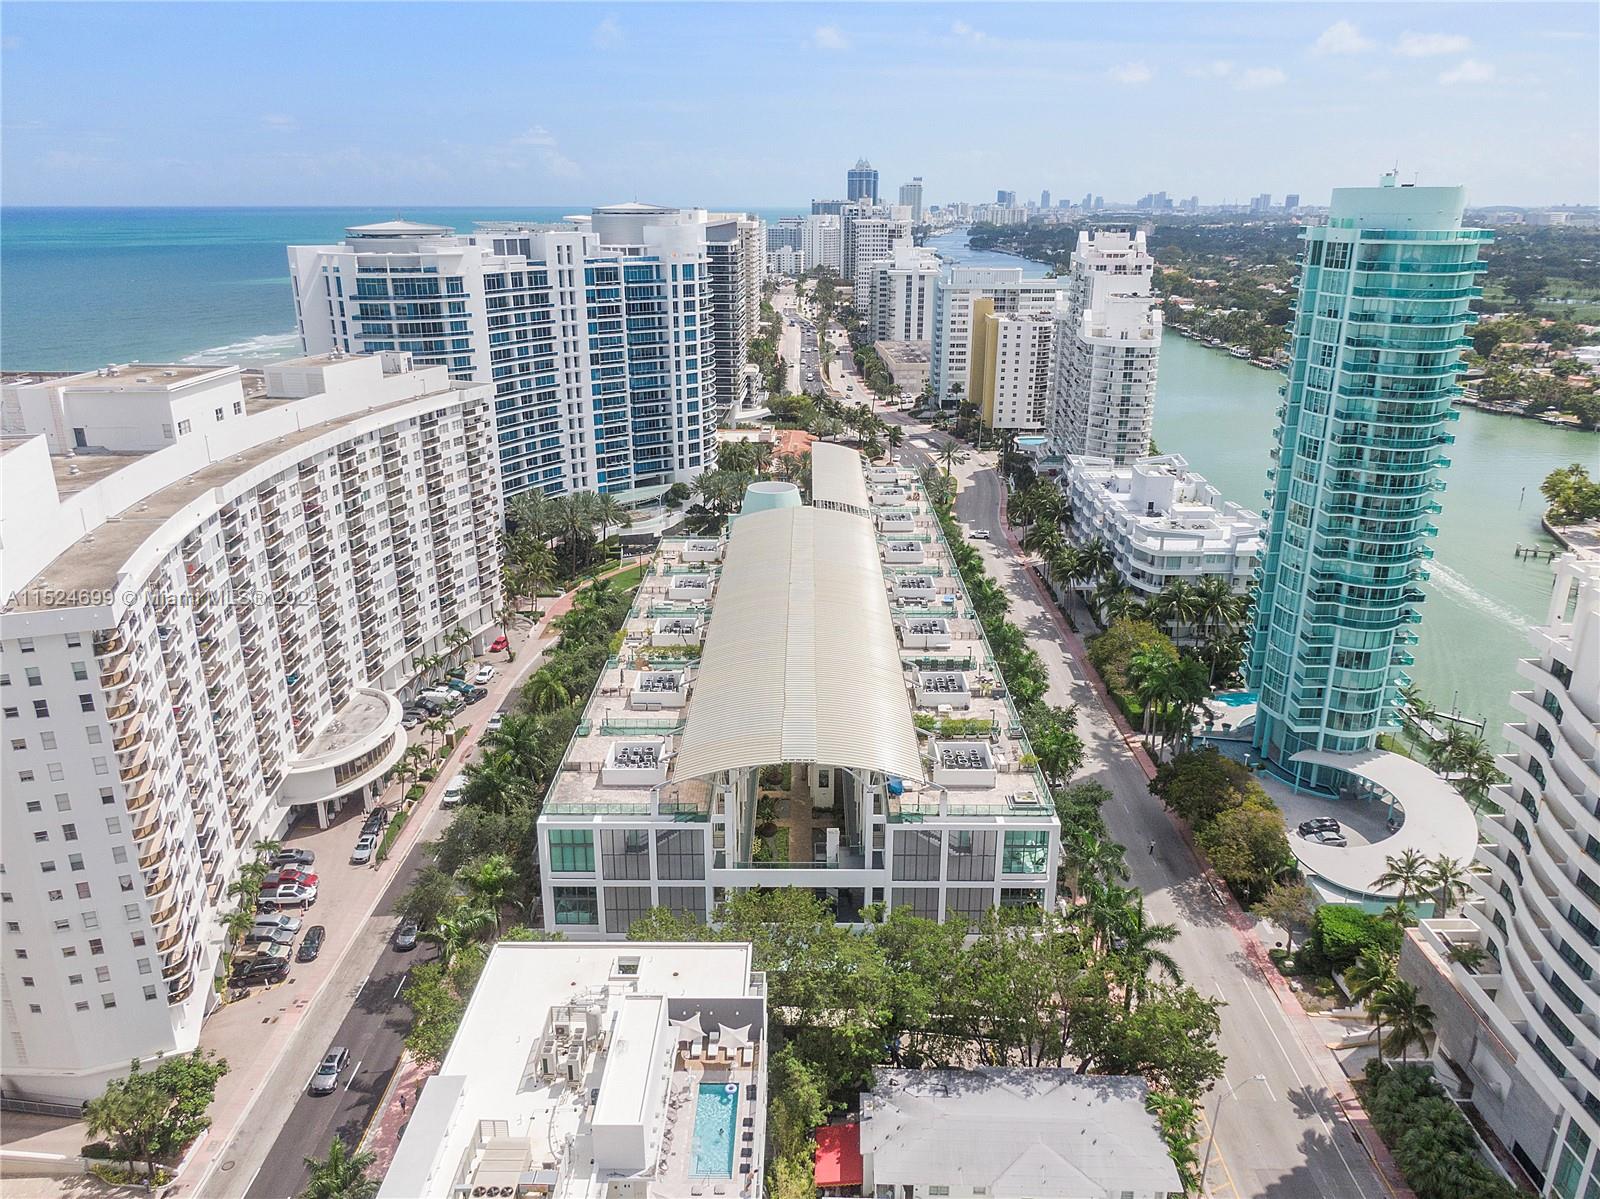
6801 Collins Ave, Miami Beach, FL 33141
$-3,636
Cash flow
-11.2%
Cash-on-Cash Return
3.7%
Cap rate
0.6%
Rent to Value Ratio
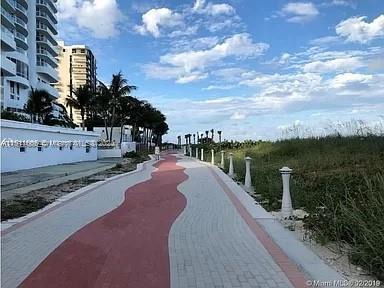
Active
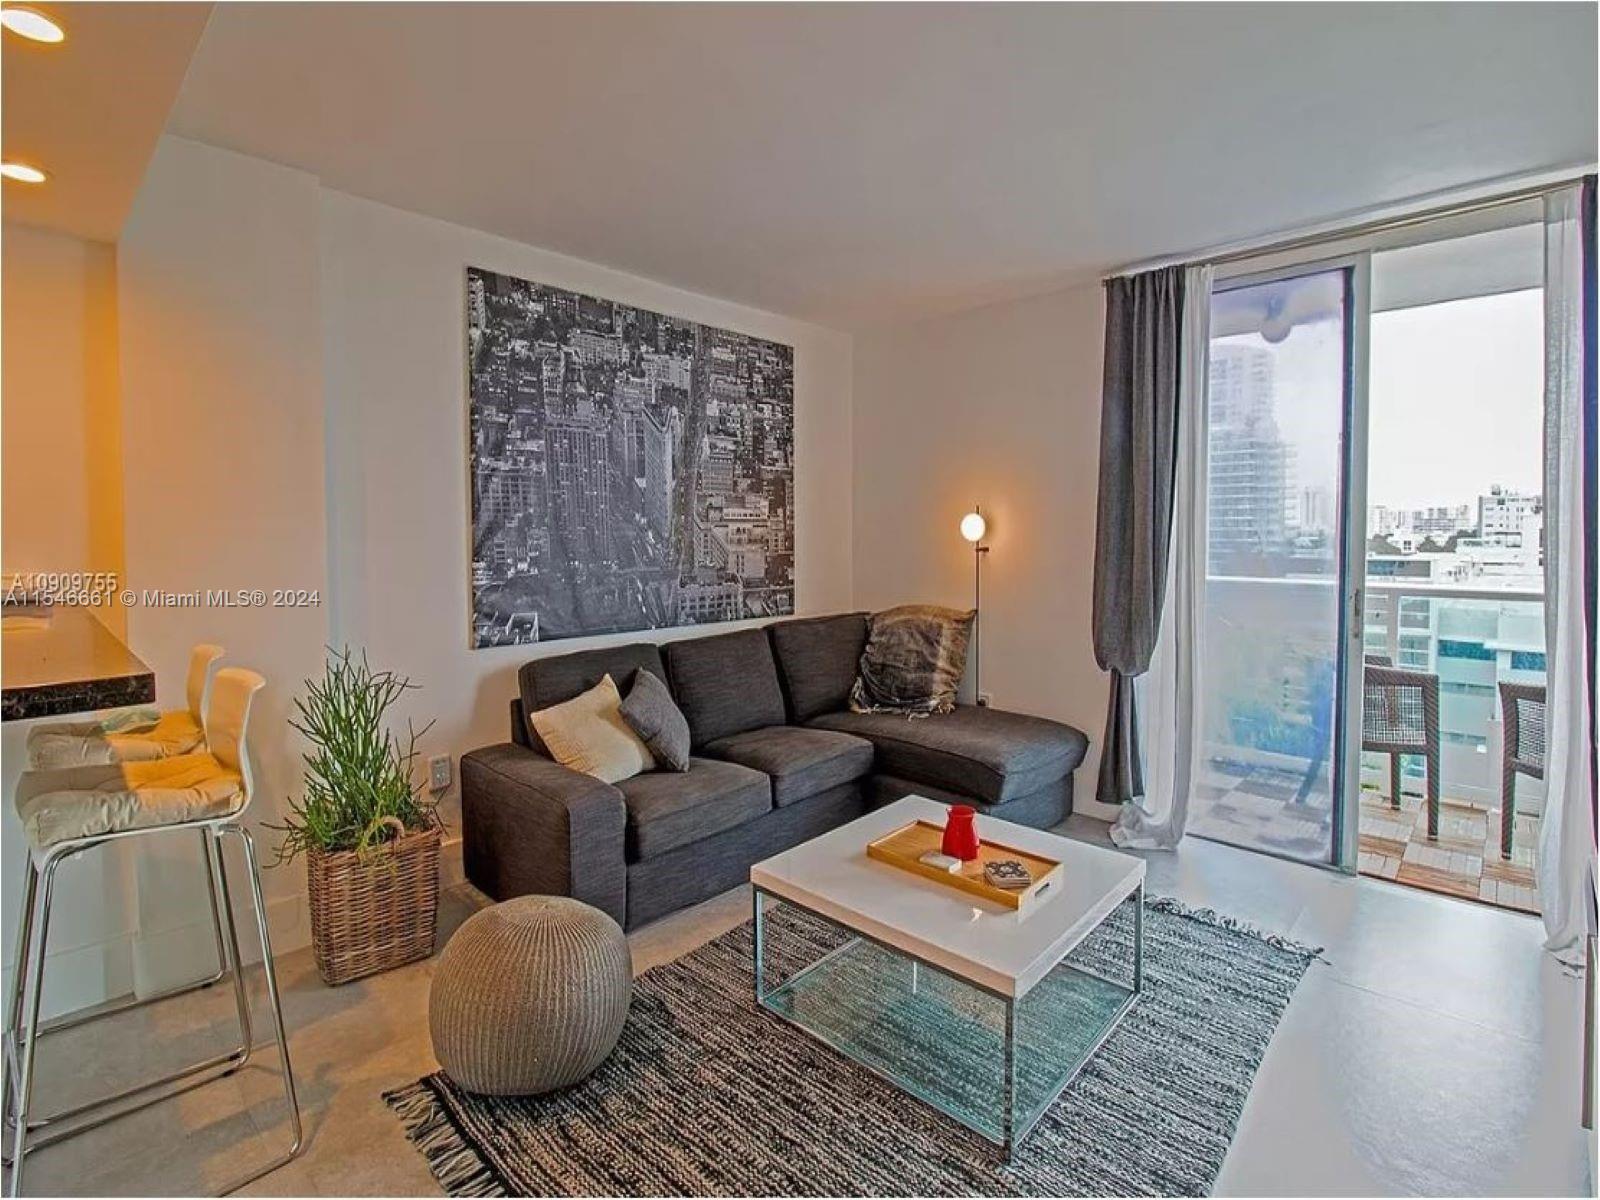
$395,000
1
bds
|
1
ba
|
576
sqft
|
built
1979
1035 West Ave, Miami Beach, FL 33139
$-1,149
Cash flow
-15.2%
Cash-on-Cash Return
2.8%
Cap rate
0.6%
Rent to Value Ratio
Active
$18,950,000
8
bds
|
8
ba
|
5,804
sqft
|
built
1991
401 E Rivo Alto Dr, Miami Beach, FL 33139
$-108,681
Cash flow
-29.9%
Cash-on-Cash Return
-0.6%
Cap rate
0.0%
Rent to Value Ratio
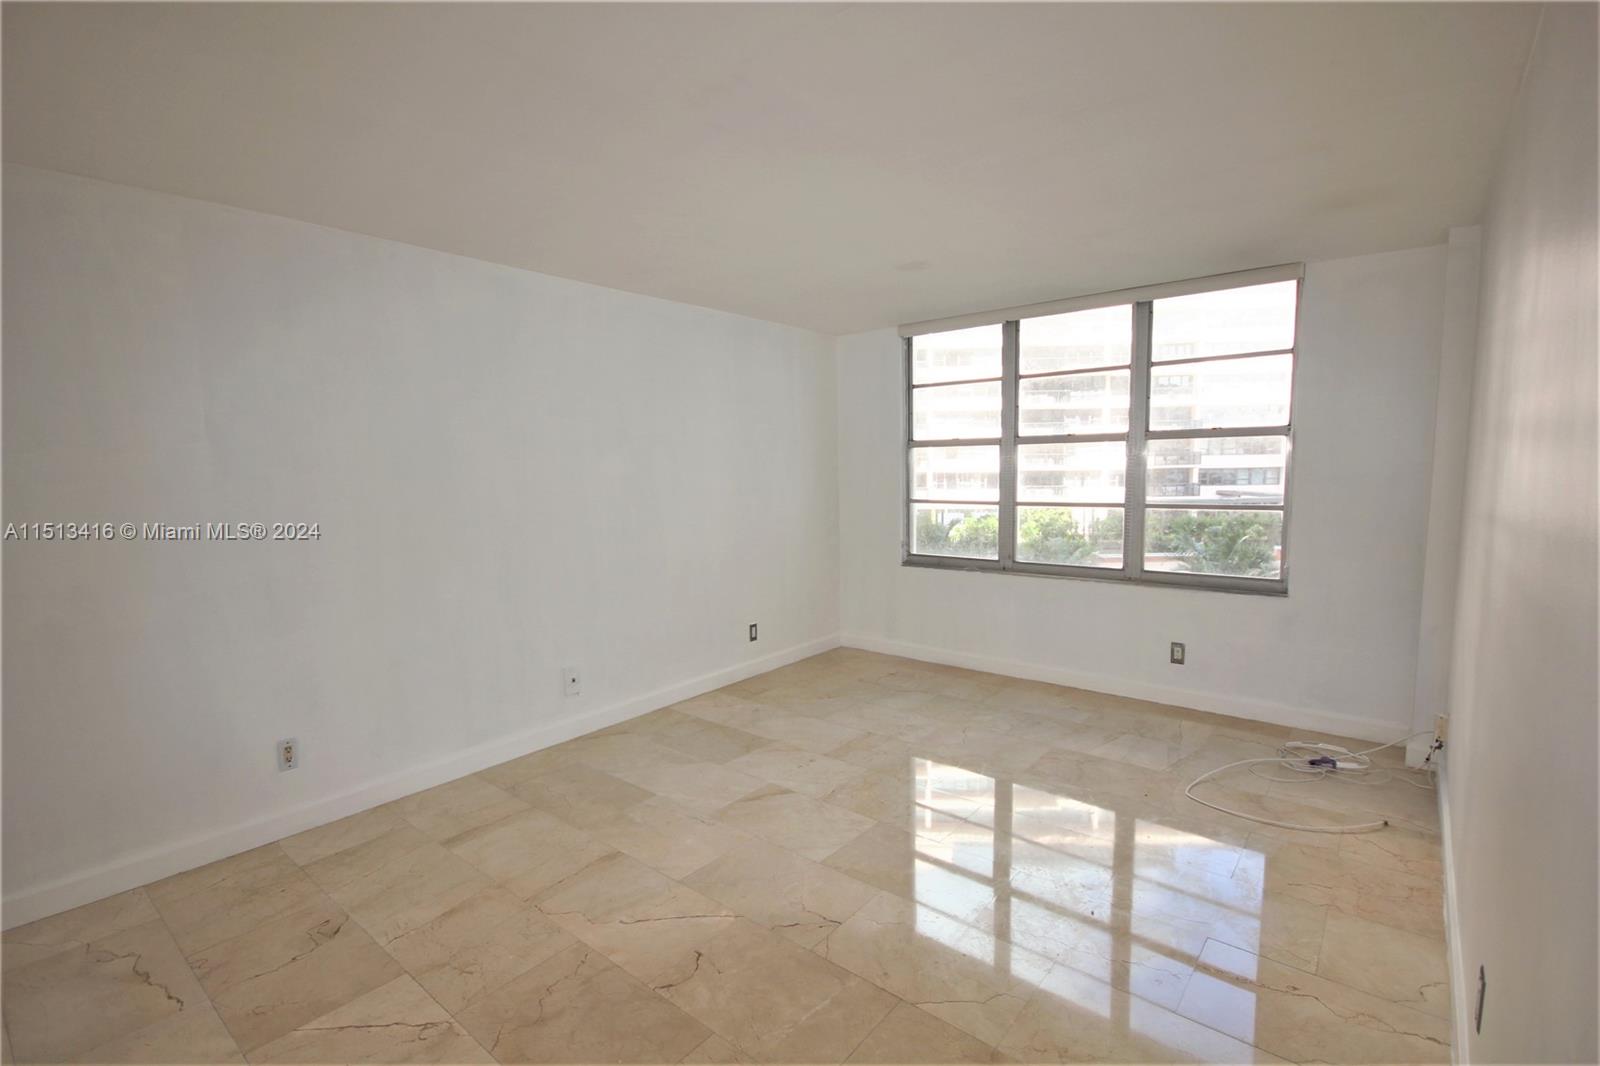
Active
$320,000
1
bds
|
1
ba
|
480
sqft
|
built
1938
550 15th St, Miami Beach, FL 33139
$-837
Cash flow
-13.6%
Cash-on-Cash Return
3.1%
Cap rate
0.7%
Rent to Value Ratio
Active
$273,000
2
bds
|
2
ba
|
1,031
sqft
|
built
1964
7441 Wayne Ave, Miami Beach, FL 33141
$-796
Cash flow
-15.2%
Cash-on-Cash Return
2.8%
Cap rate
1.0%
Rent to Value Ratio
Active
$545,000
1
bds
|
1
ba
|
659
sqft
|
built
1970
345 Ocean Dr, Miami Beach, FL 33139
$-1,755
Cash flow
-16.8%
Cash-on-Cash Return
2.4%
Cap rate
0.6%
Rent to Value Ratio
Active
$619,000
3
bds
|
2
ba
|
1,560
sqft
|
built
1963
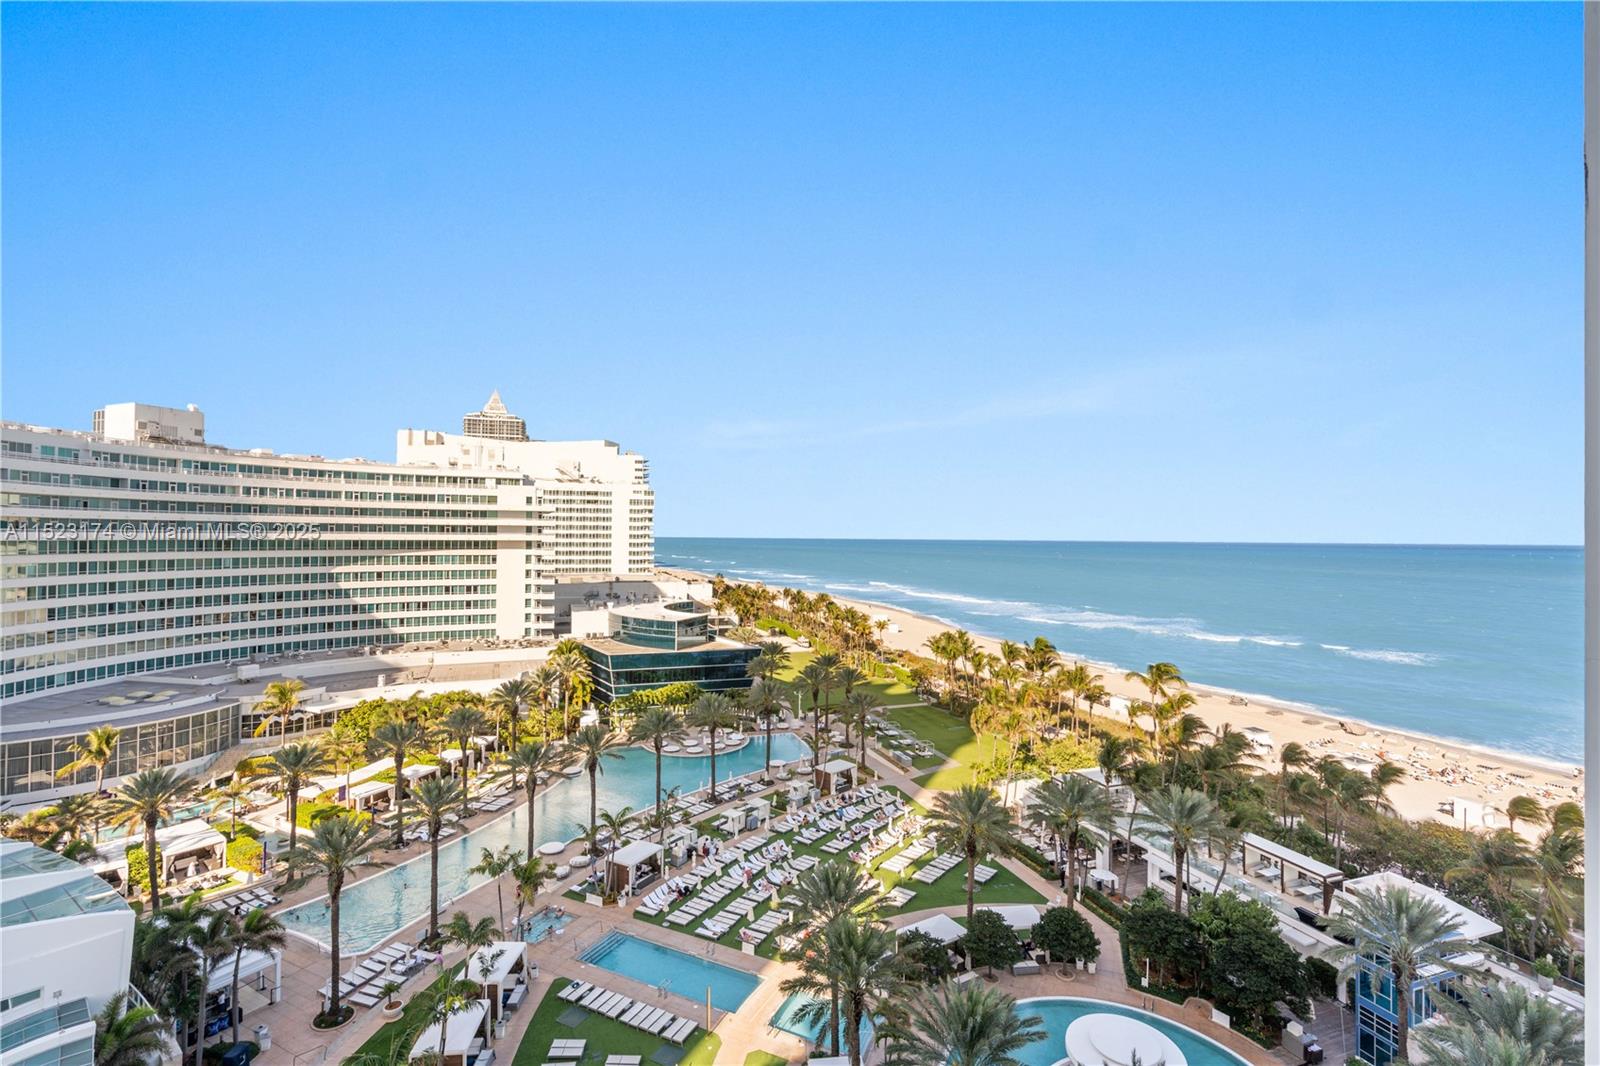
5255 Collins Ave, Miami Beach, FL 33140
$-3,174
Cash flow
-26.8%
Cash-on-Cash Return
0.1%
Cap rate
0.6%
Rent to Value Ratio
Active
$1,449,000
4
bds
|
3
ba
|
1,800
sqft
|
built
1962
5225 Collins Ave, Miami Beach, FL 33140
$-4,746
Cash flow
-17.1%
Cash-on-Cash Return
2.4%
Cap rate
0.7%
Rent to Value Ratio
Active
$1,945,000
2
bds
|
4
ba
|
1,864
sqft
|
built
2003
400 Alton Rd, Miami Beach, FL 33139
$-9,017
Cash flow
-24.2%
Cash-on-Cash Return
0.7%
Cap rate
0.4%
Rent to Value Ratio
Active
$1,700,000
2
bds
|
3
ba
|
2,057
sqft
|
built
2005
2001 Meridian Ave, Miami Beach, FL 33139
$-7,748
Cash flow
-23.8%
Cash-on-Cash Return
0.8%
Cap rate
0.5%
Rent to Value Ratio
Active
$450,000
1
bds
|
1
ba
|
861
sqft
|
built
1962
3 Island Ave, Miami Beach, FL 33139
$-81
Cash flow
-0.9%
Cash-on-Cash Return
6.1%
Cap rate
0.9%
Rent to Value Ratio
Active
$409,999
1
bds
|
1
ba
|
790
sqft
|
built
1934
1620 Pennsylvania Ave, Miami Beach, FL 33139
$-1,429
Cash flow
-18.2%
Cash-on-Cash Return
2.1%
Cap rate
0.6%
Rent to Value Ratio
Active
$875,000
2
bds
|
2
ba
|
1,660
sqft
|
built
1967
5600 Collins Ave, Miami Beach, FL 33140
$-2,688
Cash flow
-16.0%
Cash-on-Cash Return
2.6%
Cap rate
0.7%
Rent to Value Ratio
Active
$245,000
1
bds
|
1
ba
|
440
sqft
|
built
1935
605 Euclid Ave, Miami Beach, FL 33139
$-566
Cash flow
-12.1%
Cash-on-Cash Return
3.5%
Cap rate
0.8%
Rent to Value Ratio
Active
$889,000
3
bds
|
3
ba
|
1,230
sqft
|
built
2013
6700 Indian Creek Dr, Miami Beach, FL 33141
$-4,908
Cash flow
-28.8%
Cash-on-Cash Return
-0.3%
Cap rate
0.6%
Rent to Value Ratio
Active
$10,900,000
4
bds
|
4
ba
|
3,398
sqft
|
built
1932
527 E Dilido Dr, Miami Beach, FL 33139
$-63,731
Cash flow
-30.5%
Cash-on-Cash Return
-0.7%
Cap rate
0.1%
Rent to Value Ratio
Active
$1,749,000
1
bds
|
2
ba
|
958
sqft
|
built
2008
4391 Collins Ave, Miami Beach, FL 33140
$-8,189
Cash flow
-24.4%
Cash-on-Cash Return
0.7%
Cap rate
0.4%
Rent to Value Ratio
Active
$1,300,000
1
bds
|
1
ba
|
1,011
sqft
|
built
2010
6000 Collins Ave, Miami Beach, FL 33140
$-4,297
Cash flow
-17.2%
Cash-on-Cash Return
2.3%
Cap rate
0.5%
Rent to Value Ratio
Active
$4,495,000
4
bds
|
6
ba
|
4,599
sqft
|
built
2002
5801 Collins Ave, Miami Beach, FL 33140
$-31,569
Cash flow
-36.6%
Cash-on-Cash Return
-2.1%
Cap rate
0.2%
Rent to Value Ratio
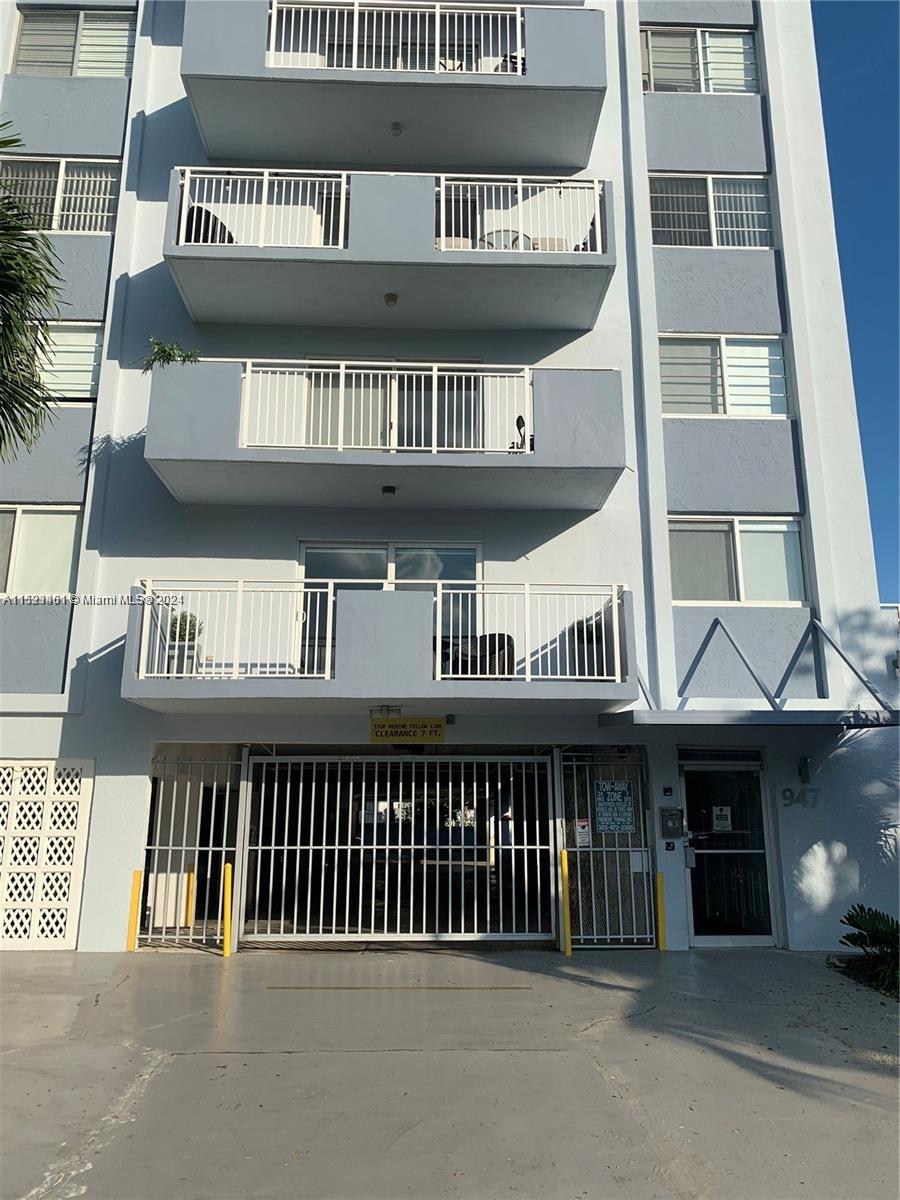
Active
$330,000
1
bds
|
1
ba
|
748
sqft
|
built
1970
947 Lenox Ave, Miami Beach, FL 33139
$-1,016
Cash flow
-16.1%
Cash-on-Cash Return
2.6%
Cap rate
0.7%
Rent to Value Ratio
Active
$2,115,000
3
bds
|
2
ba
|
1,533
sqft
|
built
1947
563 W 49th St, Miami Beach, FL 33140
$-8,557
Cash flow
-21.1%
Cash-on-Cash Return
1.4%
Cap rate
0.2%
Rent to Value Ratio
Active
$320,000
1
bds
|
1
ba
|
530
sqft
|
built
1965
100 Lincoln Rd, Miami Beach, FL 33139
$-1,001
Cash flow
-16.3%
Cash-on-Cash Return
2.5%
Cap rate
0.8%
Rent to Value Ratio
Active
$339,000
1
bds
|
2
ba
|
1,010
sqft
|
built
1970
7135 Collins Ave, Miami Beach, FL 33141
$-1,422
Cash flow
-21.9%
Cash-on-Cash Return
1.2%
Cap rate
0.7%
Rent to Value Ratio
Active
$3,000,000
4
bds
|
4
ba
|
2,815
sqft
|
built
1928
888 W 47th St, Miami Beach, FL 33140
$-9,383
Cash flow
-16.3%
Cash-on-Cash Return
2.5%
Cap rate
0.4%
Rent to Value Ratio
Active
$268,000
1
bds
|
1
ba
|
470
sqft
|
built
1925
842 Meridian Ave, Miami Beach, FL 33139
$-828
Cash flow
-16.1%
Cash-on-Cash Return
2.6%
Cap rate
0.7%
Rent to Value Ratio
Active
$2,550,000
3
bds
|
4
ba
|
2,395
sqft
|
built
2004
6101 Aqua Ave, Miami Beach, FL 33141
$-14,506
Cash flow
-29.7%
Cash-on-Cash Return
-0.5%
Cap rate
0.4%
Rent to Value Ratio

Active
$480,000
bds
|
1
ba
|
493
sqft
|
built
2008
1100 West Ave, Miami Beach, FL 33139
$-1,807
Cash flow
-19.6%
Cash-on-Cash Return
1.8%
Cap rate
0.9%
Rent to Value Ratio
Active
$375,000
1
bds
|
1
ba
|
430
sqft
|
built
1948
6345 Collins Ave, Miami Beach, FL 33141
$-1,585
Cash flow
-22.1%
Cash-on-Cash Return
1.2%
Cap rate
0.5%
Rent to Value Ratio

Active
$399,000
1
bds
|
1
ba
|
676
sqft
|
built
2008
1100 West Ave, Miami Beach, FL 33139
$-1,747
Cash flow
-22.8%
Cash-on-Cash Return
1.0%
Cap rate
0.8%
Rent to Value Ratio
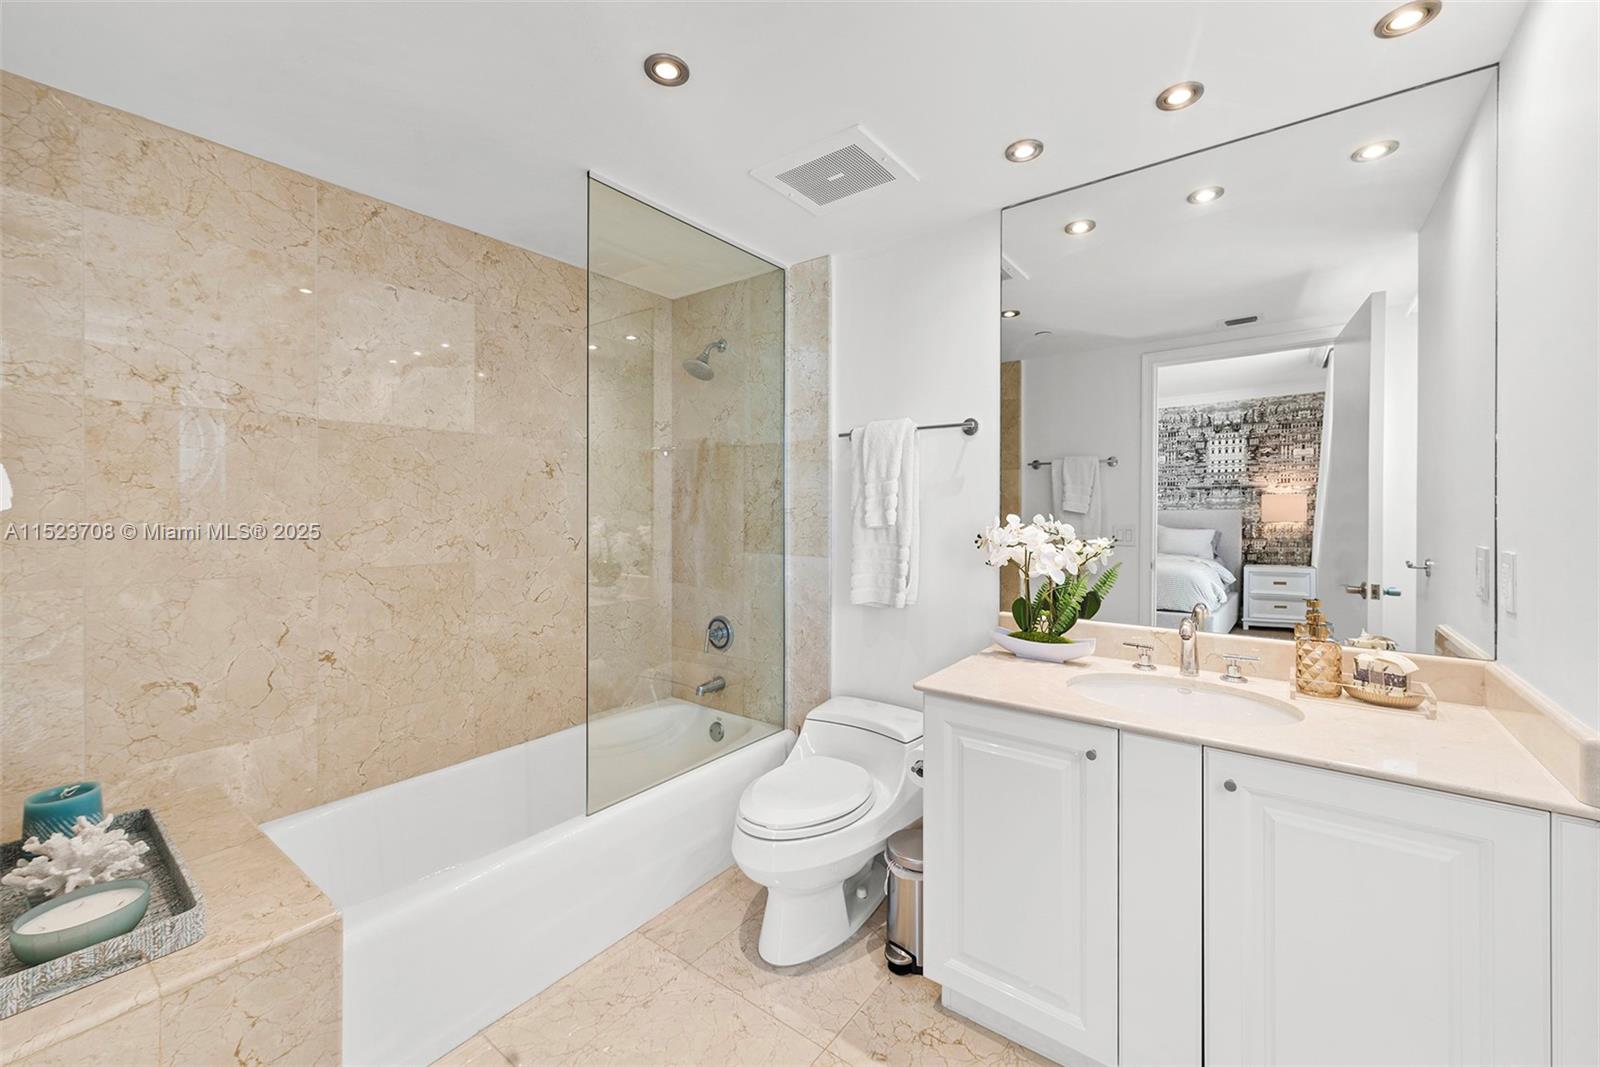
Active
$545,000
2
bds
|
2
ba
|
1,040
sqft
|
built
1966
5161 Collins Ave, Miami Beach, FL 33140
$-2,231
Cash flow
-21.4%
Cash-on-Cash Return
1.4%
Cap rate
0.7%
Rent to Value Ratio
Active
$685,000
1
bds
|
1
ba
|
700
sqft
|
built
1965
100 Lincoln Rd, Miami Beach, FL 33139
$-2,702
Cash flow
-20.6%
Cash-on-Cash Return
1.6%
Cap rate
0.5%
Rent to Value Ratio
Active
$299,000
1
bds
|
2
ba
|
676
sqft
|
built
1971
6969 Collins Ave, Miami Beach, FL 33141
$-1,016
Cash flow
-17.7%
Cash-on-Cash Return
2.2%
Cap rate
0.7%
Rent to Value Ratio
Active
$500,000
1
bds
|
1
ba
|
696
sqft
|
built
2008
1100 West Ave, Miami Beach, FL 33139
$-2,169
Cash flow
-22.6%
Cash-on-Cash Return
1.1%
Cap rate
0.9%
Rent to Value Ratio
Active
$2,390,000
2
bds
|
2
ba
|
1,230
sqft
|
built
1926
2301 Collins Ave, Miami Beach, FL 33139
$-10,861
Cash flow
-23.7%
Cash-on-Cash Return
0.8%
Cap rate
0.4%
Rent to Value Ratio
Active
$779,000
1
bds
|
1
ba
|
746
sqft
|
built
1997
650 West Ave, Miami Beach, FL 33139
$-2,801
Cash flow
-18.8%
Cash-on-Cash Return
2.0%
Cap rate
0.6%
Rent to Value Ratio
Active
$8,450,000
3
bds
|
4
ba
|
3,103
sqft
|
built
2008
800 S Pointe Dr, Miami Beach, FL 33139
$-54,199
Cash flow
-33.5%
Cash-on-Cash Return
-1.4%
Cap rate
0.1%
Rent to Value Ratio

Active
$850,000
2
bds
|
2
ba
|
1,139
sqft
|
built
1983
2457 Collins Ave, Miami Beach, FL 33140
$-1,194
Cash flow
-7.3%
Cash-on-Cash Return
4.6%
Cap rate
0.8%
Rent to Value Ratio
Active
$1,990,000
2
bds
|
2
ba
|
1,429
sqft
|
built
1989
19111 Fisher Island Dr, Miami Beach, FL 33109
$-8,641
Cash flow
-22.7%
Cash-on-Cash Return
1.1%
Cap rate
0.5%
Rent to Value Ratio
Active
$499,999
1
bds
|
2
ba
|
930
sqft
|
built
1966
5161 Collins Ave, Miami Beach, FL 33140
$-1,845
Cash flow
-19.3%
Cash-on-Cash Return
1.9%
Cap rate
0.6%
Rent to Value Ratio
Active
$300,000
bds
|
1
ba
|
400
sqft
|
built
1948
6345 Collins Ave, Miami Beach, FL 33141
$-1,009
Cash flow
-17.5%
Cash-on-Cash Return
2.2%
Cap rate
0.7%
Rent to Value Ratio