Miami Beach, FL Investment Properties for Sale
Browse homes for sale and investment properties in Miami Beach, FL. Refine your search by price, property type, or more.
Best cash flowing properties in Miami Beach, FL
Active
$96,500
bds
|
0
ba
|
112
sqft
|
built
1966
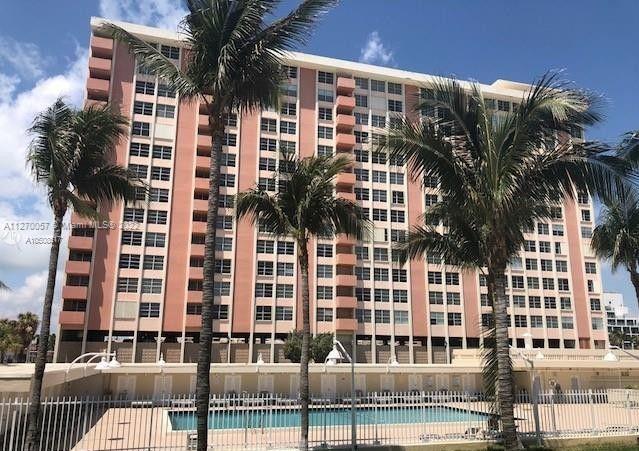
2899 Collins Ave, Miami Beach, FL 33140
$1,120
Cash flow
60.6%
Cash-on-Cash Return
20.2%
Cap rate
2.7%
Rent to Value Ratio
Active
$399,000
bds
|
1
ba
|
530
sqft
|
built
2008
1100 West Ave, Miami Beach, FL 33139
$-255
Cash flow
-3.3%
Cash-on-Cash Return
5.5%
Cap rate
0.8%
Rent to Value Ratio
1,992 out of 2,195 properties for sale in Miami Beach, FL
Limited Results Shown
Create a free account, or log in to reveal all property listings and enjoy the complete experience.

Active
$1,220,000
2
bds
|
2
ba
|
1,220
sqft
|
built
1996
6301 Collins Ave, Miami Beach, FL 33141
$-4,485
Cash flow
-19.2%
Cash-on-Cash Return
1.9%
Cap rate
0.5%
Rent to Value Ratio
Active
$1,250,000
2
bds
|
2
ba
|
1,360
sqft
|
built
1966
5151 Collins Ave, Miami Beach, FL 33140
$-4,417
Cash flow
-18.4%
Cash-on-Cash Return
2.0%
Cap rate
0.4%
Rent to Value Ratio
Active
$389,000
bds
|
1
ba
|
550
sqft
|
built
1965
100 Lincoln Rd, Miami Beach, FL 33139
$-1,289
Cash flow
-17.3%
Cash-on-Cash Return
2.3%
Cap rate
0.6%
Rent to Value Ratio
Active
$385,000
1
bds
|
1
ba
|
584
sqft
|
built
1960
1500 Bay Rd, Miami Beach, FL 33139
$-1,622
Cash flow
-22.0%
Cash-on-Cash Return
1.2%
Cap rate
0.6%
Rent to Value Ratio
Active
$315,000
bds
|
2
ba
|
500
sqft
|
built
2006
1437 Collins Ave, Miami Beach, FL 33139
$-2,254
Cash flow
-37.3%
Cash-on-Cash Return
-2.3%
Cap rate
0.8%
Rent to Value Ratio

Active
$1,149,000
2
bds
|
2
ba
|
1,322
sqft
|
built
2004
6365 Collins Ave, Miami Beach, FL 33141
$-5,093
Cash flow
-23.1%
Cash-on-Cash Return
1.0%
Cap rate
0.5%
Rent to Value Ratio
Active
$760,000
1
bds
|
2
ba
|
808
sqft
|
built
2004
6365 Collins Ave, Miami Beach, FL 33141
$-3,166
Cash flow
-21.7%
Cash-on-Cash Return
1.3%
Cap rate
0.5%
Rent to Value Ratio
Active
$990,000
3
bds
|
3
ba
|
1,430
sqft
|
built
1967
5401 Collins Ave, Miami Beach, FL 33140
$-4,153
Cash flow
-21.9%
Cash-on-Cash Return
1.2%
Cap rate
0.5%
Rent to Value Ratio
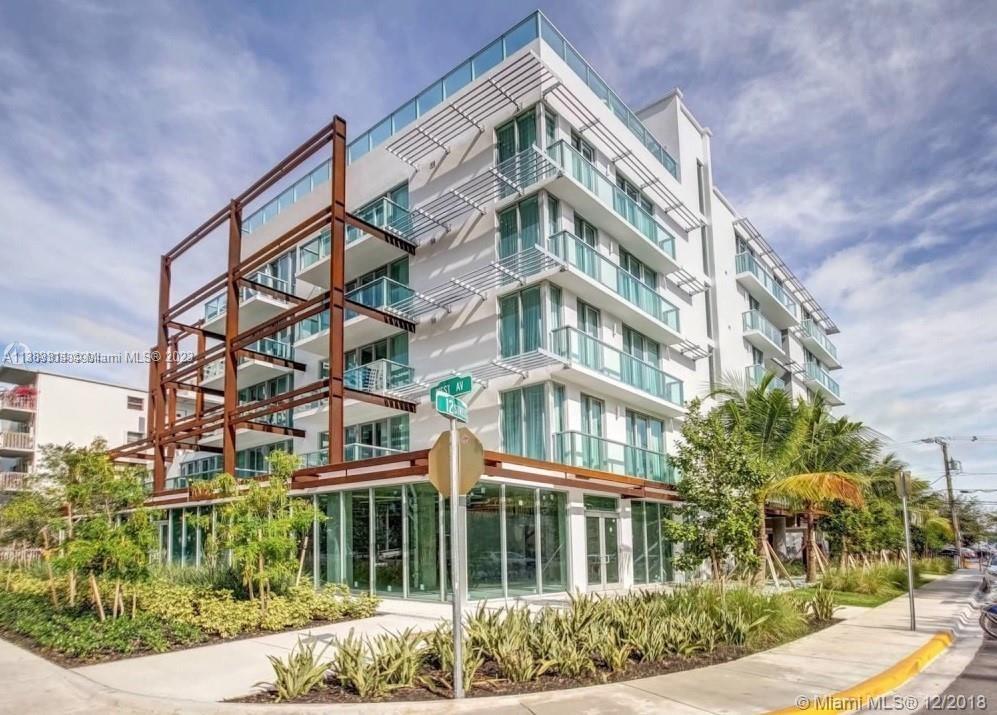
Active
$350,000
1
bds
|
1
ba
|
450
sqft
|
built
2016
1215 West Ave, Miami Beach, FL 33139
$-1,058
Cash flow
-15.8%
Cash-on-Cash Return
2.7%
Cap rate
0.8%
Rent to Value Ratio
Active
$2,200,000
2
bds
|
2
ba
|
1,180
sqft
|
built
1926
2301 Collins Ave, Miami Beach, FL 33139
$-6,892
Cash flow
-16.3%
Cash-on-Cash Return
2.5%
Cap rate
0.5%
Rent to Value Ratio
Active
$365,000
1
bds
|
1
ba
|
550
sqft
|
built
1965
100 Lincoln Rd, Miami Beach, FL 33139
$-1,098
Cash flow
-15.7%
Cash-on-Cash Return
2.7%
Cap rate
0.8%
Rent to Value Ratio
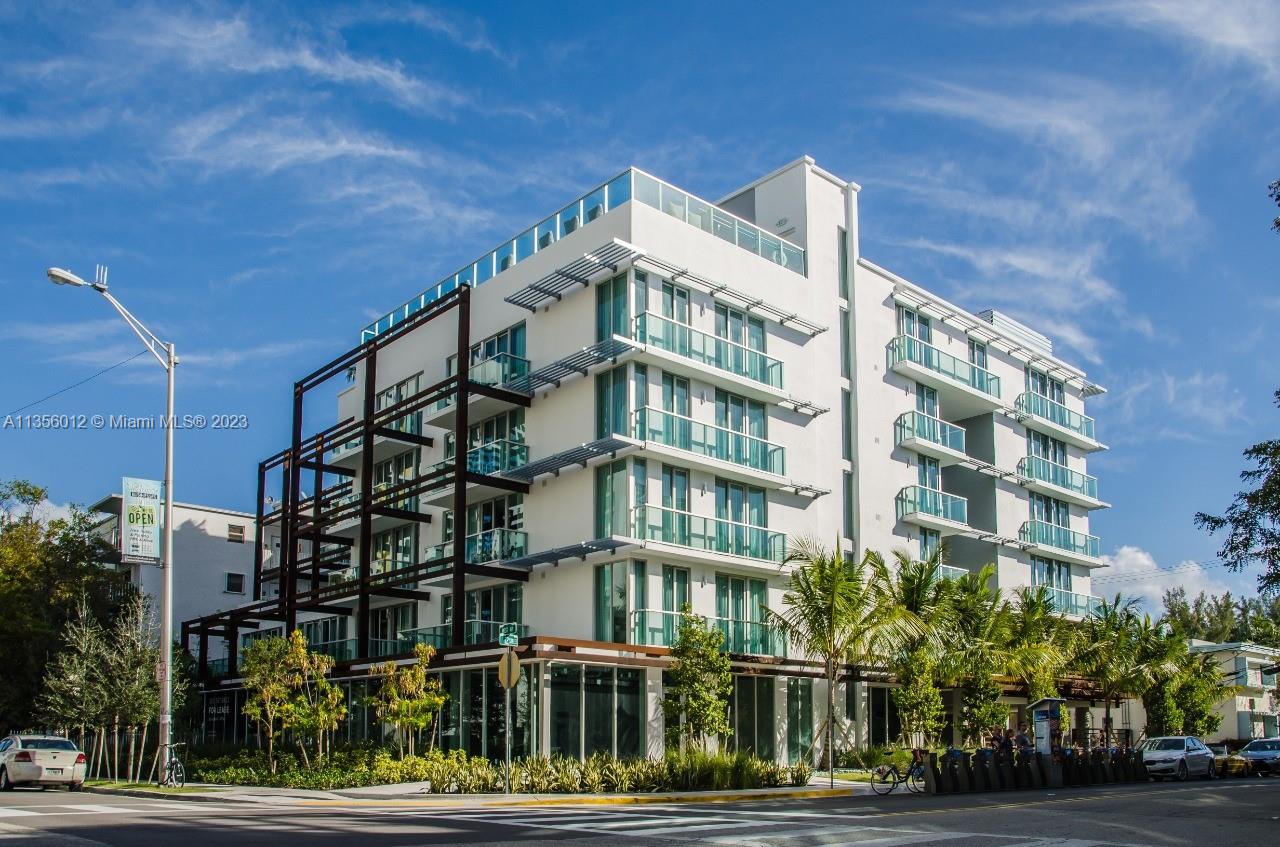
Active
$395,000
1
bds
|
1
ba
|
442
sqft
|
built
2016
1215 West Ave, Miami Beach, FL 33139
$-911
Cash flow
-12.0%
Cash-on-Cash Return
3.5%
Cap rate
0.8%
Rent to Value Ratio
Active
$7,599,000
4
bds
|
6
ba
|
4,135
sqft
|
built
2006
5959 Collins Ave, Miami Beach, FL 33140
$-46,288
Cash flow
-31.8%
Cash-on-Cash Return
-1.0%
Cap rate
0.1%
Rent to Value Ratio
Active
$1,025,000
2
bds
|
2
ba
|
1,030
sqft
|
built
1966
5151 Collins Ave, Miami Beach, FL 33140
$-4,715
Cash flow
-24.0%
Cash-on-Cash Return
0.8%
Cap rate
0.4%
Rent to Value Ratio
Active
$399,000
bds
|
1
ba
|
530
sqft
|
built
2008
1100 West Ave, Miami Beach, FL 33139
$-255
Cash flow
-3.3%
Cash-on-Cash Return
5.5%
Cap rate
0.8%
Rent to Value Ratio
Active
$2,199,000
6
bds
|
5
ba
|
2,553
sqft
|
built
1932
2811 Indian Creek Dr, Miami Beach, FL 33140
$-10,775
Cash flow
-25.6%
Cash-on-Cash Return
0.4%
Cap rate
0.2%
Rent to Value Ratio
Active
$479,900
1
bds
|
1
ba
|
675
sqft
|
built
1965
100 Lincoln Rd, Miami Beach, FL 33139
$-1,672
Cash flow
-18.2%
Cash-on-Cash Return
2.1%
Cap rate
0.5%
Rent to Value Ratio
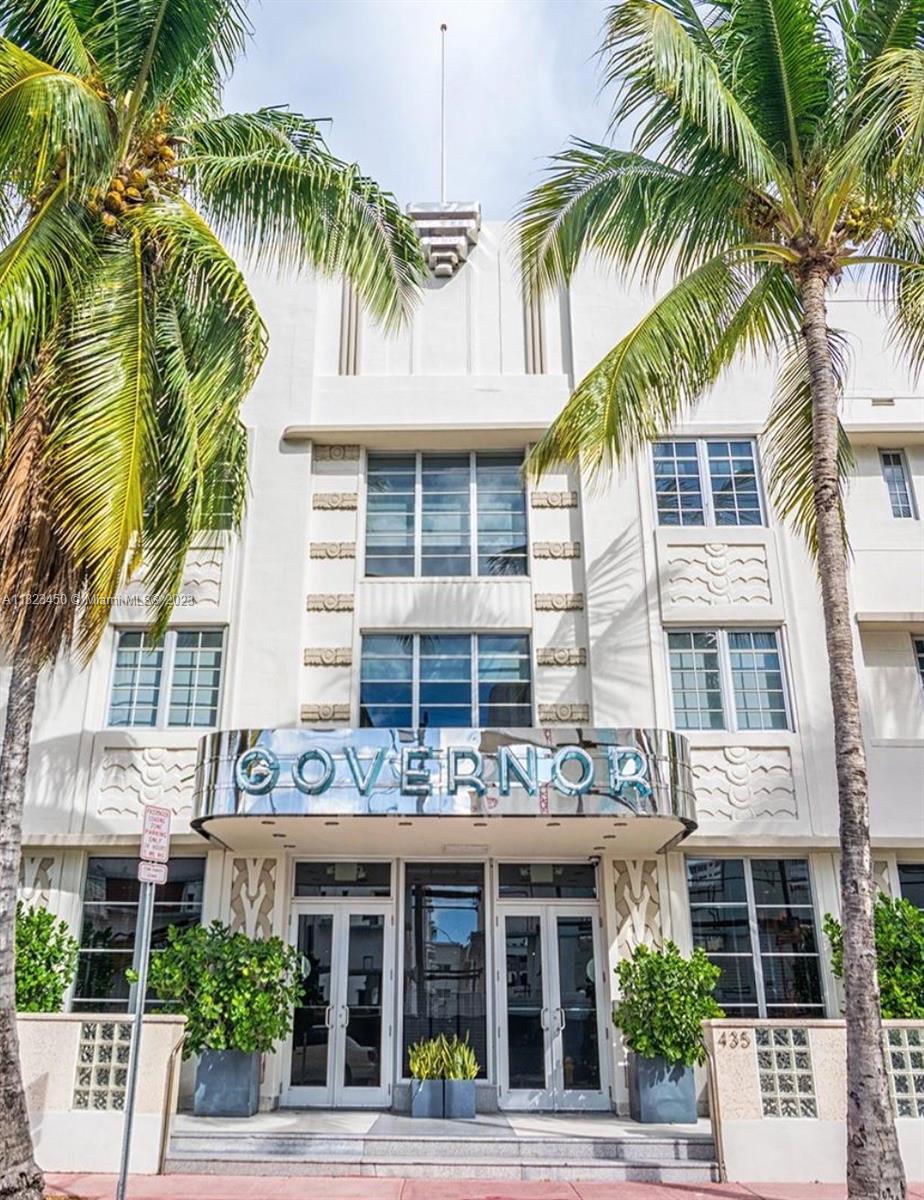
Active
$389,000
1
bds
|
1
ba
|
579
sqft
|
built
1936
435 21st St, Miami Beach, FL 33139
$-1,266
Cash flow
-17.0%
Cash-on-Cash Return
2.4%
Cap rate
0.7%
Rent to Value Ratio
Active
$340,000
bds
|
1
ba
|
682
sqft
|
built
1968
1000 West Ave, Miami Beach, FL 33139
$-1,647
Cash flow
-25.3%
Cash-on-Cash Return
0.5%
Cap rate
0.6%
Rent to Value Ratio
Active
$4,995,000
2
bds
|
3
ba
|
1,591
sqft
|
built
2002
100 S Pointe Dr, Miami Beach, FL 33139
$-27,690
Cash flow
-28.9%
Cash-on-Cash Return
-0.4%
Cap rate
0.2%
Rent to Value Ratio
Active
$825,000
2
bds
|
2
ba
|
1,000
sqft
|
built
1966
5151 Collins Ave, Miami Beach, FL 33140
$-1,718
Cash flow
-10.9%
Cash-on-Cash Return
3.8%
Cap rate
0.7%
Rent to Value Ratio
Active
$5,000,000
3
bds
|
3
ba
|
2,040
sqft
|
built
1996
300 S Pointe Dr, Miami Beach, FL 33139
$-27,742
Cash flow
-28.9%
Cash-on-Cash Return
-0.4%
Cap rate
0.2%
Rent to Value Ratio
Active
$195,000
bds
|
1
ba
|
200
sqft
|
built
1941
1455 Michigan Ave, Miami Beach, FL 33139
$-371
Cash flow
-9.9%
Cash-on-Cash Return
4.0%
Cap rate
0.7%
Rent to Value Ratio
Active
$479,000
1
bds
|
2
ba
|
1,046
sqft
|
built
1964
5005 Collins Ave, Miami Beach, FL 33140
$-1,876
Cash flow
-20.4%
Cash-on-Cash Return
1.6%
Cap rate
0.6%
Rent to Value Ratio
Active
$96,500
bds
|
0
ba
|
112
sqft
|
built
1966
2899 Collins Ave, Miami Beach, FL 33140
$1,120
Cash flow
60.6%
Cash-on-Cash Return
20.2%
Cap rate
2.7%
Rent to Value Ratio
Active
$800,000
bds
|
1
ba
|
510
sqft
|
built
1962
4747 Collins Ave, Miami Beach, FL 33140
$-3,102
Cash flow
-20.2%
Cash-on-Cash Return
1.6%
Cap rate
0.3%
Rent to Value Ratio
Active
$1,850,000
3
bds
|
2
ba
|
1,499
sqft
|
built
2006
520 West Ave, Miami Beach, FL 33139
$-8,626
Cash flow
-24.3%
Cash-on-Cash Return
0.7%
Cap rate
0.4%
Rent to Value Ratio
Active
$15,000,000
4
bds
|
5
ba
|
4,154
sqft
|
built
2008
800 S Pointe Dr, Miami Beach, FL 33139
$-95,417
Cash flow
-33.2%
Cash-on-Cash Return
-1.3%
Cap rate
0.1%
Rent to Value Ratio
Active
$1,900,000
3
bds
|
2
ba
|
1,702
sqft
|
built
1939
535 W 51st St, Miami Beach, FL 33140
$-5,843
Cash flow
-16.0%
Cash-on-Cash Return
2.6%
Cap rate
0.3%
Rent to Value Ratio
Active
$875,000
bds
|
1
ba
|
538
sqft
|
built
2008
4391 Collins Ave, Miami Beach, FL 33140
$-3,128
Cash flow
-18.7%
Cash-on-Cash Return
2.0%
Cap rate
0.5%
Rent to Value Ratio
Active
$7,995,000
2
bds
|
3
ba
|
1,757
sqft
|
built
2002
100 S Pointe Dr, Miami Beach, FL 33139
$-42,921
Cash flow
-28.0%
Cash-on-Cash Return
-0.2%
Cap rate
0.1%
Rent to Value Ratio
Active
$425,000
bds
|
1
ba
|
570
sqft
|
built
1967
5401 Collins Ave, Miami Beach, FL 33140
$-1,886
Cash flow
-23.2%
Cash-on-Cash Return
1.0%
Cap rate
0.6%
Rent to Value Ratio