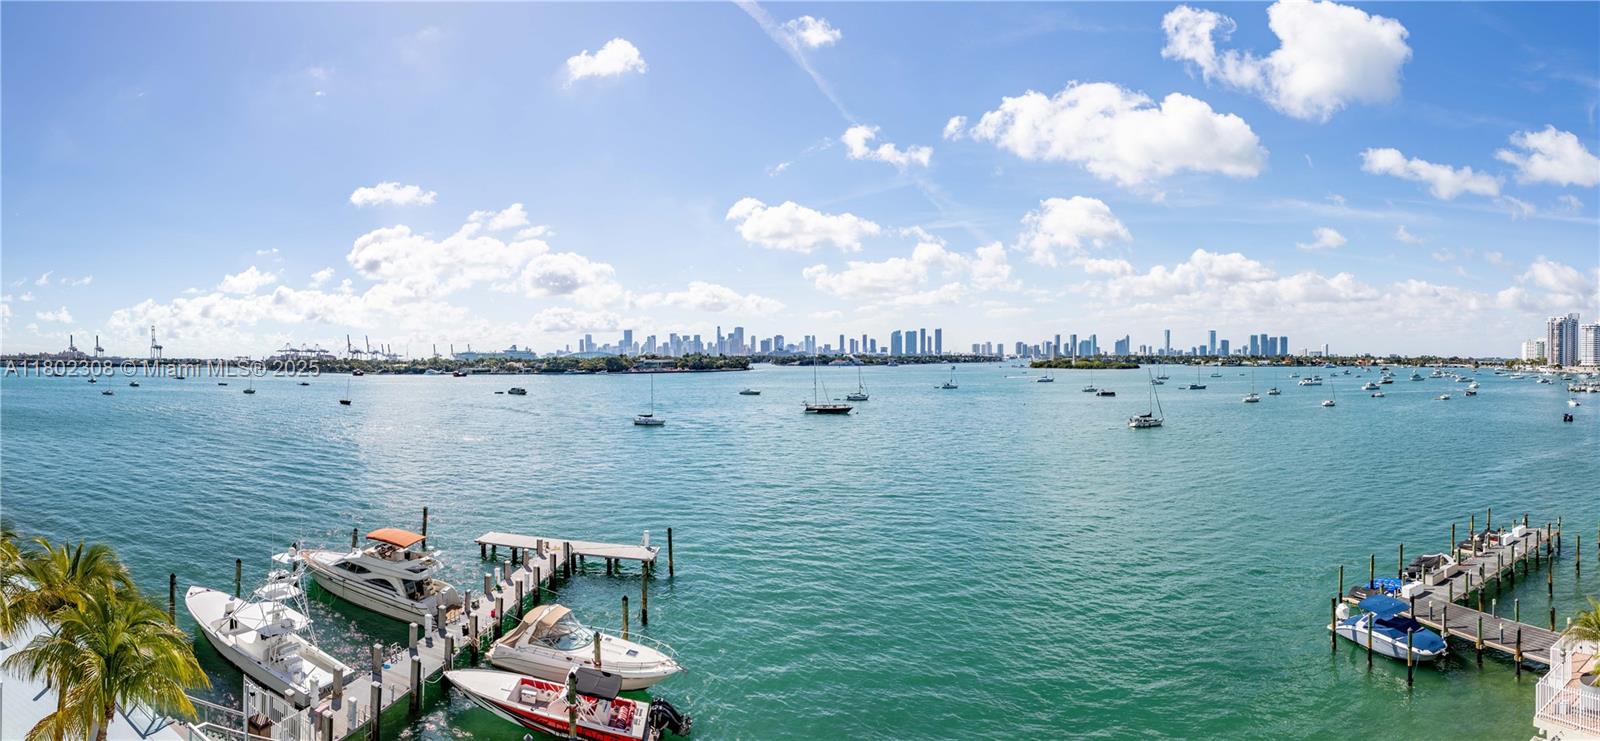
Miami Beach, FL Investment Properties for Sale
Browse homes for sale and investment properties in Miami Beach, FL. Refine your search by price, property type, or more.
Best cash flowing properties in Miami Beach, FL
Active
$315,000
2
bds
|
2
ba
|
879
sqft
|
built
1966
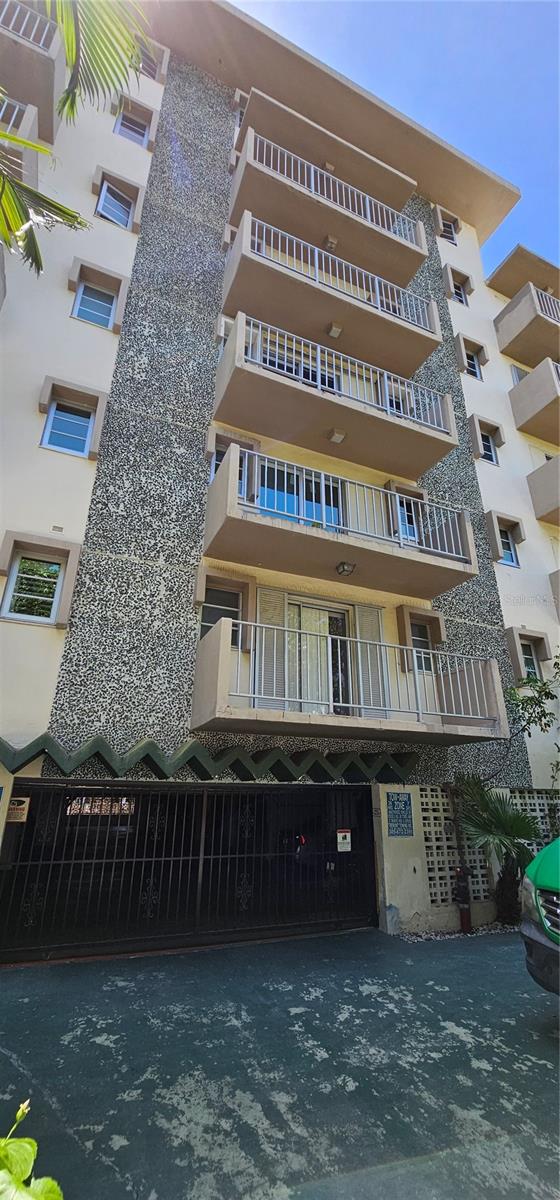
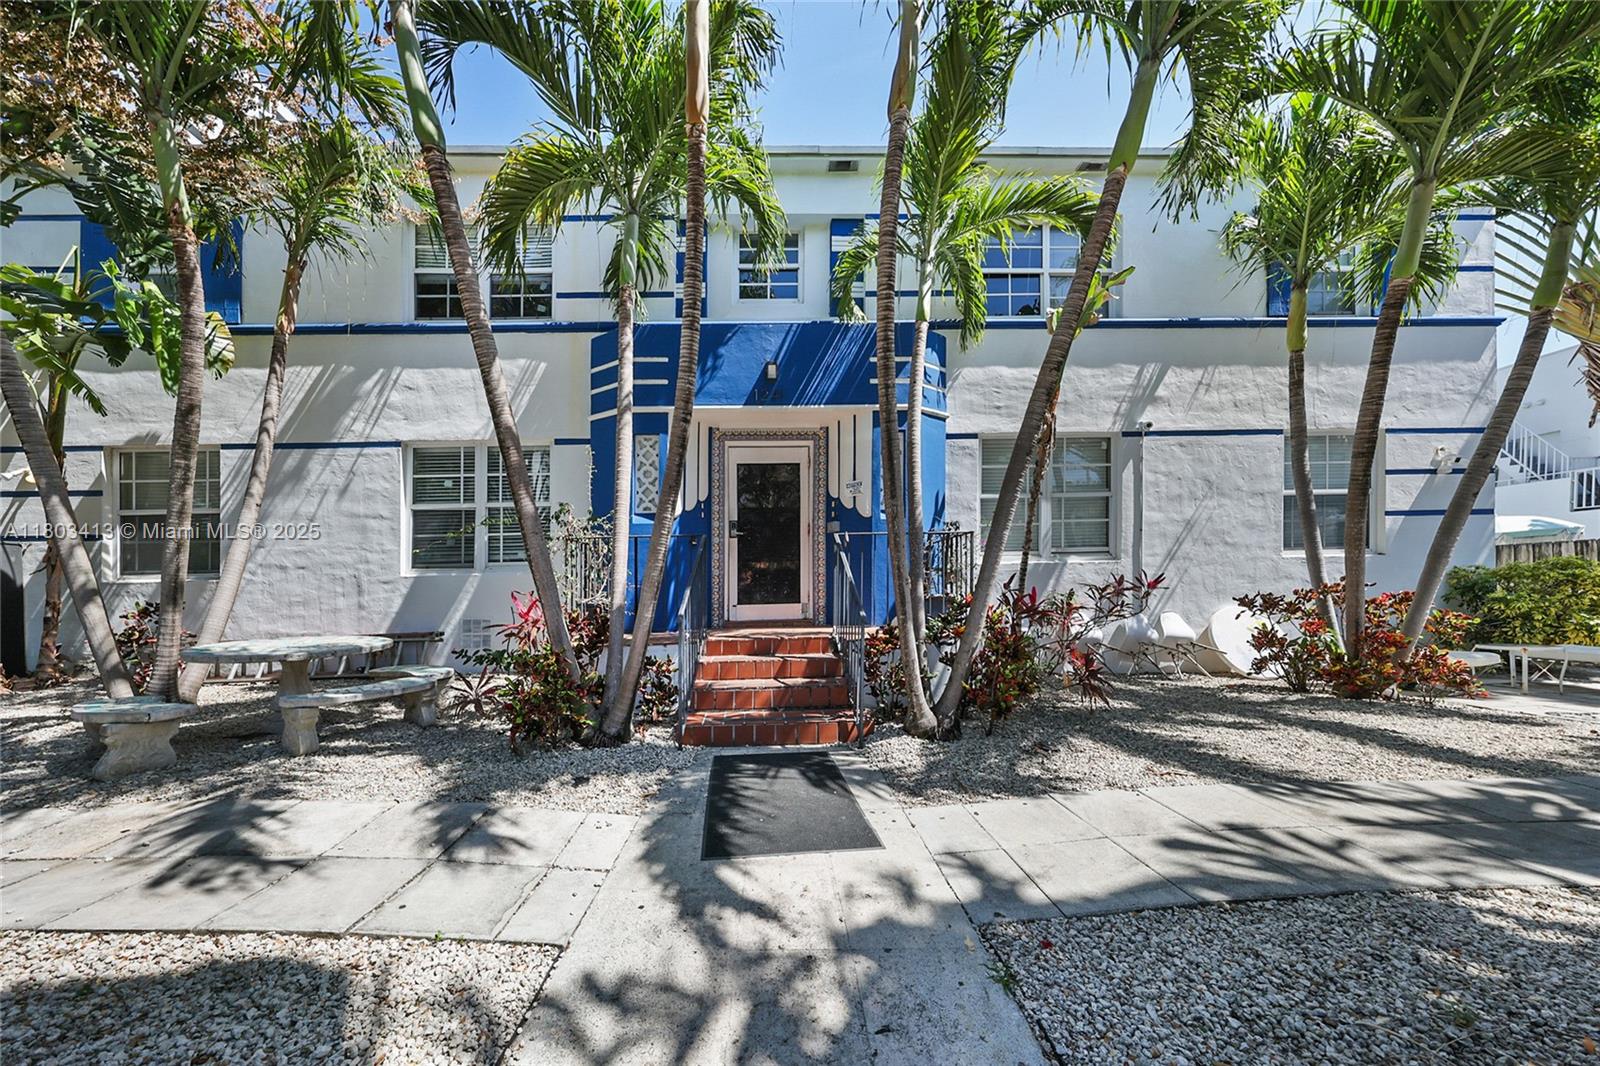
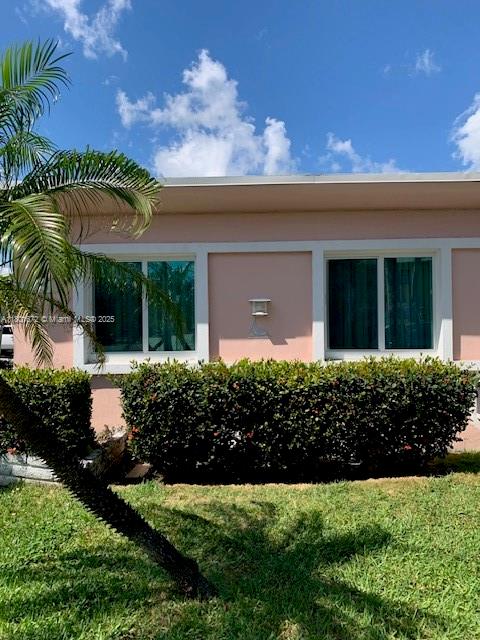
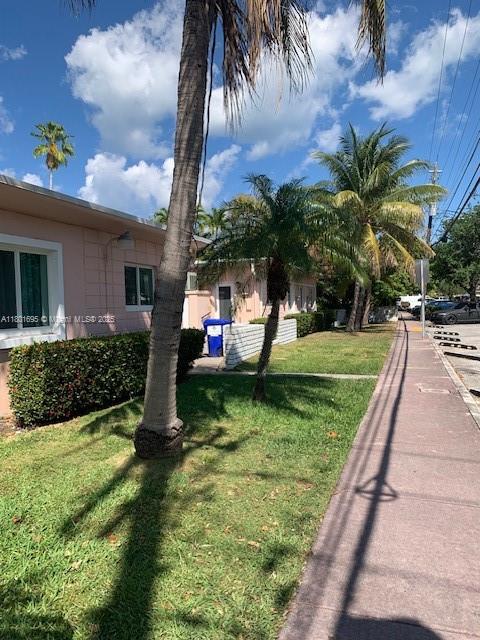
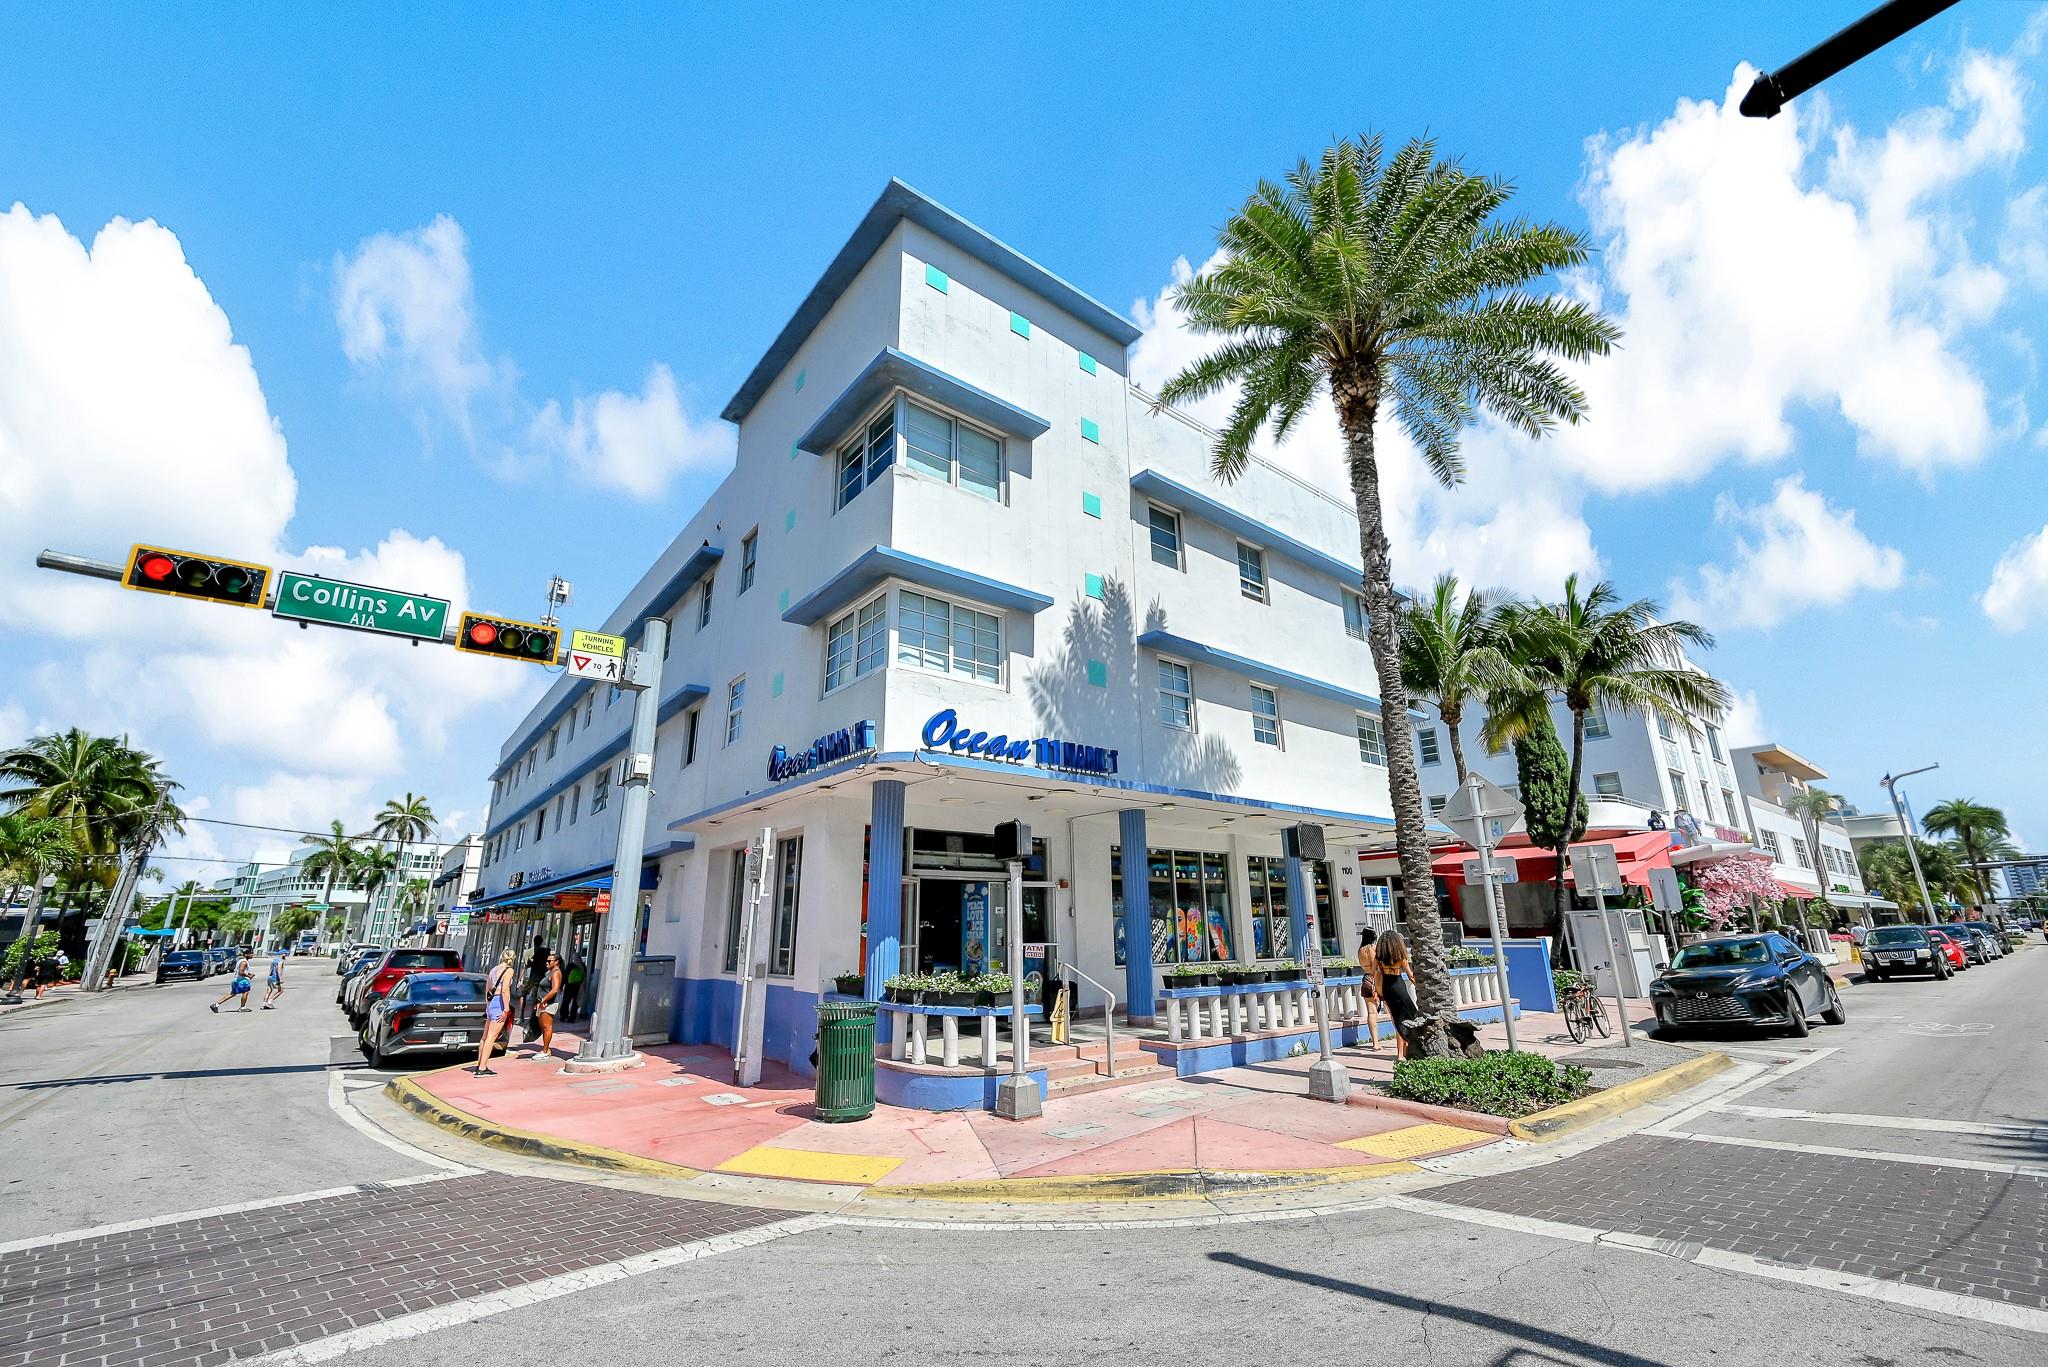
1820 James Ave, Miami Beach, FL 33139
$-499
Cash flow
-8.3%
Cash-on-Cash Return
4.4%
Cap rate
0.9%
Rent to Value Ratio

Active
$275,000
1
bds
|
2
ba
|
805
sqft
|
built
1971
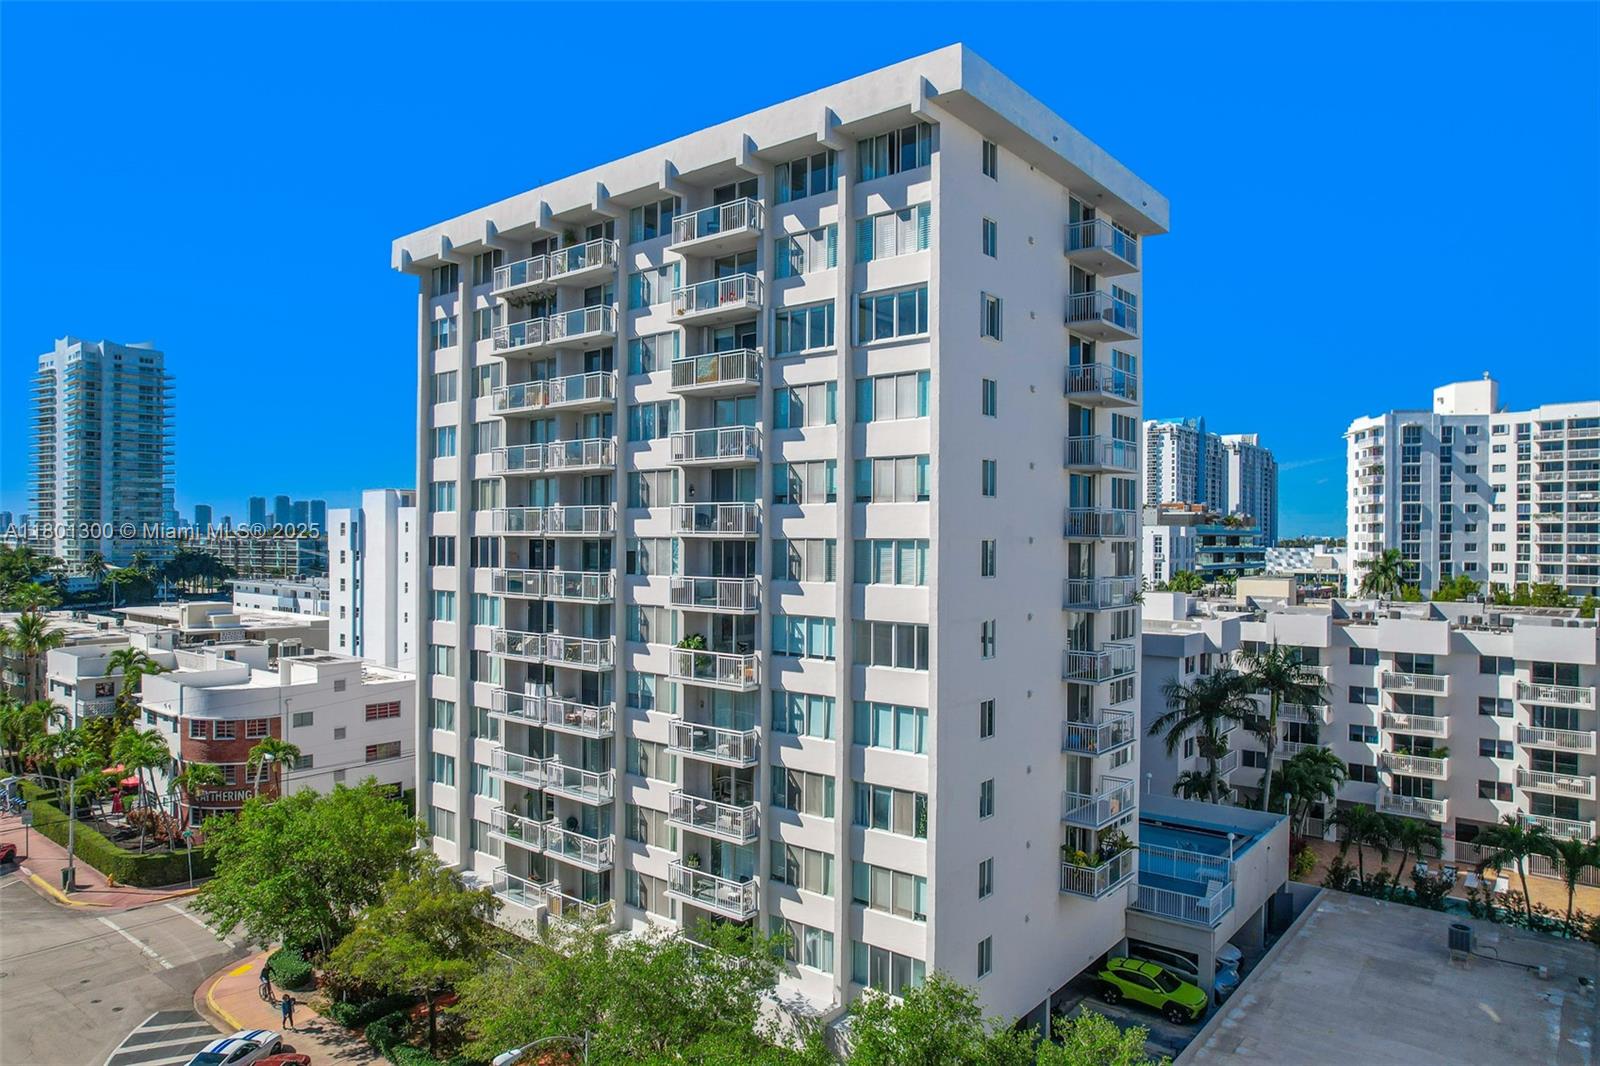
7620 Carlyle Ave, Miami Beach, FL 33141
$-728
Cash flow
-13.8%
Cash-on-Cash Return
3.1%
Cap rate
0.9%
Rent to Value Ratio
1,984 out of 2,186 properties for sale in Miami Beach, FL
Limited Results Shown
Create a free account, or log in to reveal all property listings and enjoy the complete experience.
Active
$520,000
2
bds
|
2
ba
|
1,040
sqft
|
built
1968
5700 Collins Ave, Miami Beach, FL 33140
$-2,298
Cash flow
-23.1%
Cash-on-Cash Return
1.0%
Cap rate
0.7%
Rent to Value Ratio
Active
$3,600,000
5
bds
|
5
ba
|
3,392
sqft
|
built
2015
5978 Alton Rd, Miami Beach, FL 33140
$-14,346
Cash flow
-20.8%
Cash-on-Cash Return
1.5%
Cap rate
0.3%
Rent to Value Ratio

Active
$950,000
2
bds
|
2
ba
|
1,262
sqft
|
built
2001
1330 West Ave, Miami Beach, FL 33139
$-3,992
Cash flow
-21.9%
Cash-on-Cash Return
1.2%
Cap rate
0.5%
Rent to Value Ratio
Active
$520,000
1
bds
|
1
ba
|
837
sqft
|
built
1965
1200 West Ave, Miami Beach, FL 33139
$-881
Cash flow
-8.8%
Cash-on-Cash Return
4.3%
Cap rate
0.7%
Rent to Value Ratio
Active
$629,000
1
bds
|
2
ba
|
1,190
sqft
|
built
1975
2655 Collins Ave, Miami Beach, FL 33140
$-3,091
Cash flow
-25.6%
Cash-on-Cash Return
0.4%
Cap rate
0.5%
Rent to Value Ratio
Active
$439,000
2
bds
|
2
ba
|
1,326
sqft
|
built
1968
6770 Indian Creek Dr, Miami Beach, FL 33141
$-1,960
Cash flow
-23.3%
Cash-on-Cash Return
0.9%
Cap rate
0.7%
Rent to Value Ratio
Active
$21,500,000
5
bds
|
7
ba
|
6,027
sqft
|
built
2009
125 Ocean Dr, Miami Beach, FL 33139
$-143,335
Cash flow
-34.8%
Cash-on-Cash Return
-1.7%
Cap rate
0.0%
Rent to Value Ratio
Active
$289,000
1
bds
|
1
ba
|
900
sqft
|
built
1969
7133 Bay Dr, Miami Beach, FL 33141
$-1,076
Cash flow
-19.4%
Cash-on-Cash Return
1.8%
Cap rate
0.8%
Rent to Value Ratio
Active
$1,950,000
8
bds
|
0
ba
|
4,181
sqft
|
built
1938
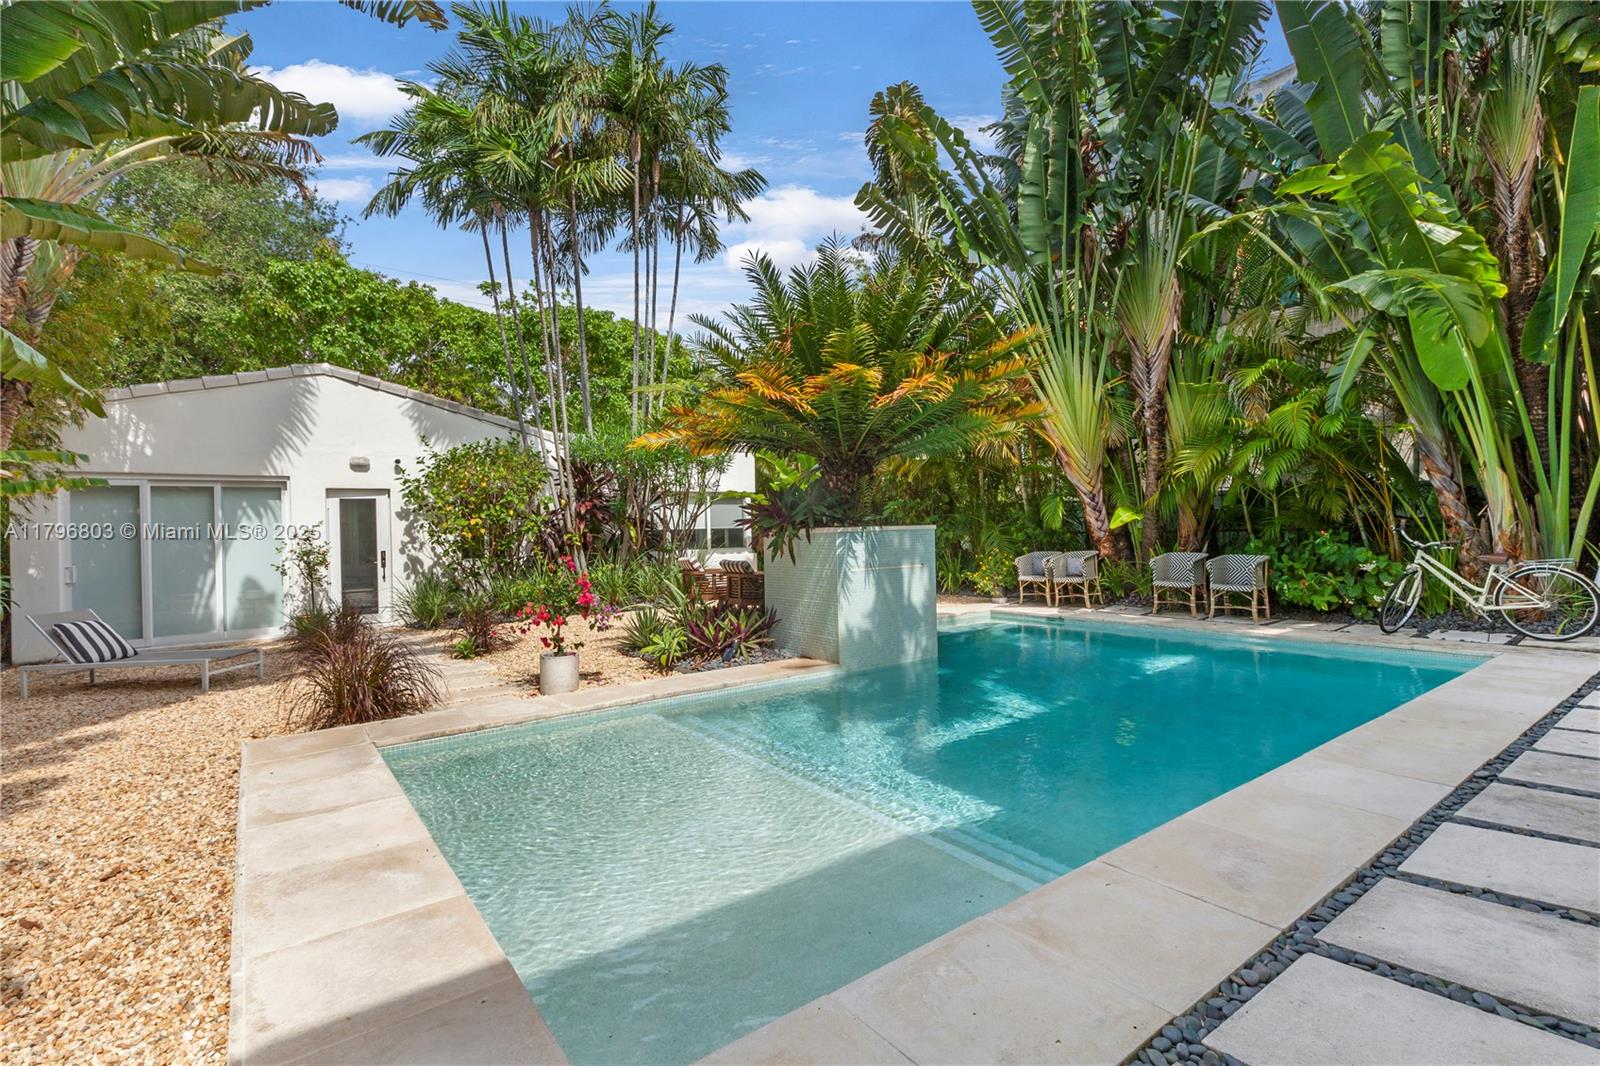
1241 13th St, Miami Beach, FL 33139
$-8,743
Cash flow
-23.4%
Cash-on-Cash Return
0.9%
Cap rate
0.4%
Rent to Value Ratio
Active
$3,749,000
3
bds
|
3
ba
|
2,165
sqft
|
built
2008
1445 16th St, Miami Beach, FL 33139
$-22,191
Cash flow
-30.9%
Cash-on-Cash Return
-0.8%
Cap rate
0.3%
Rent to Value Ratio
Active
$315,000
2
bds
|
2
ba
|
879
sqft
|
built
1966
1820 James Ave, Miami Beach, FL 33139
$-499
Cash flow
-8.3%
Cash-on-Cash Return
4.4%
Cap rate
0.9%
Rent to Value Ratio

Active
$1,125,000
2
bds
|
2
ba
|
870
sqft
|
built
1951
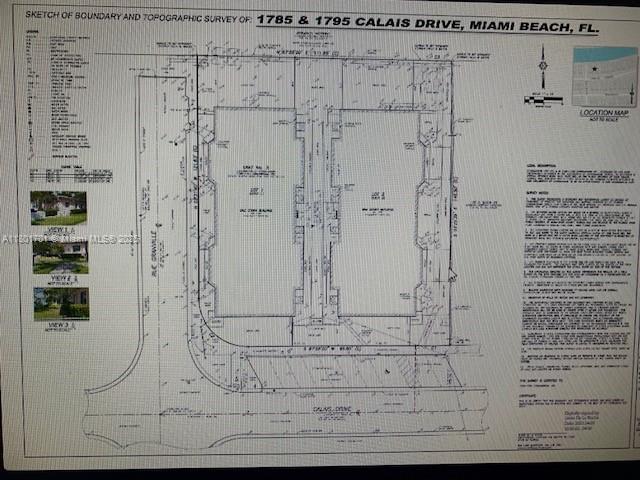
1785 Calais Dr, Miami Beach, FL 33141
$-4,635
Cash flow
-21.5%
Cash-on-Cash Return
1.3%
Cap rate
0.2%
Rent to Value Ratio
Active
$585,000
1
bds
|
2
ba
|
912
sqft
|
built
1970
7135 Collins Ave, Miami Beach, FL 33141
$-2,536
Cash flow
-22.6%
Cash-on-Cash Return
1.1%
Cap rate
0.5%
Rent to Value Ratio
Active
$1,125,000
2
bds
|
2
ba
|
890
sqft
|
built
1951
1795 Calais Dr, Miami Beach, FL 33141
$-3,530
Cash flow
-16.4%
Cash-on-Cash Return
2.5%
Cap rate
0.4%
Rent to Value Ratio
Active
$1,125,000
2
bds
|
2
ba
|
890
sqft
|
built
1951
1795 Calais Dr, Miami Beach, FL 33141
$-4,644
Cash flow
-21.5%
Cash-on-Cash Return
1.3%
Cap rate
0.2%
Rent to Value Ratio
Active
$1,125,000
2
bds
|
2
ba
|
870
sqft
|
built
1951
1795 Calais Dr, Miami Beach, FL 33141
$-4,383
Cash flow
-20.3%
Cash-on-Cash Return
1.6%
Cap rate
0.2%
Rent to Value Ratio
Active
$1,125,000
2
bds
|
2
ba
|
870
sqft
|
built
1951
1795 Calais Dr, Miami Beach, FL 33141
$-4,602
Cash flow
-21.3%
Cash-on-Cash Return
1.4%
Cap rate
0.2%
Rent to Value Ratio
Active
$1,125,000
2
bds
|
2
ba
|
870
sqft
|
built
1951
1785 Calais Dr, Miami Beach, FL 33141
$-4,629
Cash flow
-21.5%
Cash-on-Cash Return
1.3%
Cap rate
0.2%
Rent to Value Ratio
Active
$1,045,000
2
bds
|
2
ba
|
1,226
sqft
|
built
1965
1200 West Ave, Miami Beach, FL 33139
$-2,312
Cash flow
-11.5%
Cash-on-Cash Return
3.6%
Cap rate
0.6%
Rent to Value Ratio
Active
$1,125,000
2
bds
|
2
ba
|
890
sqft
|
built
1951
1785 Calais Dr, Miami Beach, FL 33141
$-4,348
Cash flow
-20.2%
Cash-on-Cash Return
1.6%
Cap rate
0.3%
Rent to Value Ratio
Active
$355,000
bds
|
1
ba
|
400
sqft
|
built
1948
6345 Collins Ave, Miami Beach, FL 33141
$-1,400
Cash flow
-20.6%
Cash-on-Cash Return
1.6%
Cap rate
0.6%
Rent to Value Ratio
Active
$275,000
1
bds
|
2
ba
|
805
sqft
|
built
1971
7620 Carlyle Ave, Miami Beach, FL 33141
$-728
Cash flow
-13.8%
Cash-on-Cash Return
3.1%
Cap rate
0.9%
Rent to Value Ratio
Active
$429,000
2
bds
|
2
ba
|
689
sqft
|
built
1948
8335 Crespi Blvd, Miami Beach, FL 33141
$-1,467
Cash flow
-17.8%
Cash-on-Cash Return
2.2%
Cap rate
0.6%
Rent to Value Ratio
Active under contract
$340,000
1
bds
|
1
ba
|
400
sqft
|
built
1950
1100 Collins Ave, Miami Beach, FL 33139
$-1,283
Cash flow
-19.7%
Cash-on-Cash Return
1.8%
Cap rate
0.7%
Rent to Value Ratio
Active
$340,000
1
bds
|
2
ba
|
718
sqft
|
built
1972
1345 Lincoln Rd, Miami Beach, FL 33139
$-1,099
Cash flow
-16.9%
Cash-on-Cash Return
2.4%
Cap rate
0.7%
Rent to Value Ratio
Active
$3,495,000
4
bds
|
4
ba
|
2,969
sqft
|
built
1939
4532 Sheridan Ave, Miami Beach, FL 33140
$-14,749
Cash flow
-22.0%
Cash-on-Cash Return
1.2%
Cap rate
0.3%
Rent to Value Ratio

Active
$2,395,000
0
bds
|
1
ba
|
449
sqft
|
built
1936
928 Jefferson Ave, Miami Beach, FL 33139
$-11,985
Cash flow
-26.1%
Cash-on-Cash Return
0.3%
Cap rate
0.1%
Rent to Value Ratio

Active
$2,395,000
bds
|
1
ba
|
454
sqft
|
built
1936
928 Jefferson Ave, Miami Beach, FL 33139
$-12,151
Cash flow
-26.5%
Cash-on-Cash Return
0.2%
Cap rate
0.1%
Rent to Value Ratio

Active
$1,395,000
1
bds
|
1
ba
|
818
sqft
|
built
2016
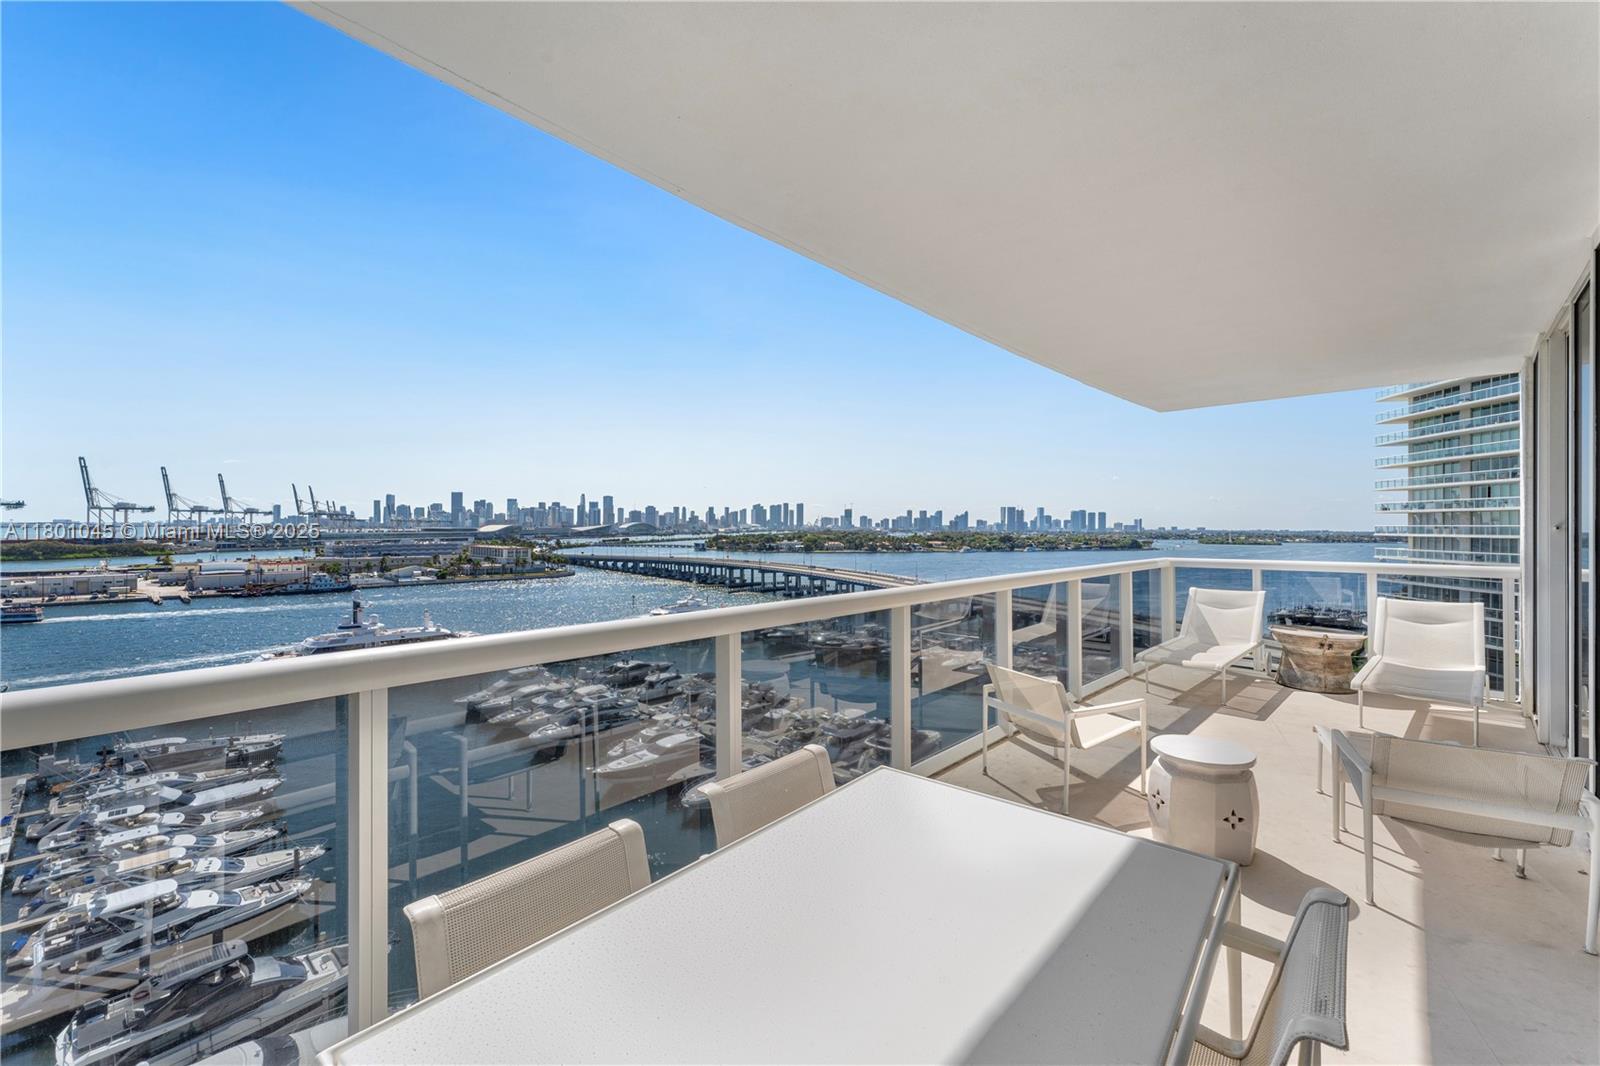
1 Collins Ave, Miami Beach, FL 33139
$-5,631
Cash flow
-21.1%
Cash-on-Cash Return
1.4%
Cap rate
0.6%
Rent to Value Ratio
Active
$2,900,000
2
bds
|
3
ba
|
2,003
sqft
|
built
2003
400 Alton Rd, Miami Beach, FL 33139
$-14,086
Cash flow
-25.3%
Cash-on-Cash Return
0.5%
Cap rate
0.3%
Rent to Value Ratio
Active
$11,550,000
6
bds
|
5
ba
|
4,535
sqft
|
built
1931
5215 Pine Tree Dr, Miami Beach, FL 33140
$-65,840
Cash flow
-29.7%
Cash-on-Cash Return
-0.6%
Cap rate
0.1%
Rent to Value Ratio

Active
$2,395,000
0
bds
|
1
ba
|
439
sqft
|
built
1936
928 Jefferson Ave, Miami Beach, FL 33139
$-12,147
Cash flow
-26.5%
Cash-on-Cash Return
0.2%
Cap rate
0.1%
Rent to Value Ratio
Active
$659,000
1
bds
|
1
ba
|
852
sqft
|
built
1968
1000 West Ave, Miami Beach, FL 33139
$-2,676
Cash flow
-21.2%
Cash-on-Cash Return
1.4%
Cap rate
0.5%
Rent to Value Ratio
Active
$6,800,000
4
bds
|
0
ba
|
3,008
sqft
|
built
1937
560 Michigan Ave, Miami Beach, FL 33139
$-33,472
Cash flow
-25.7%
Cash-on-Cash Return
0.4%
Cap rate
0.1%
Rent to Value Ratio
Active
$239,000
1
bds
|
1
ba
|
428
sqft
|
built
1947
1555 Pennsylvania Ave, Miami Beach, FL 33139
$-860
Cash flow
-18.8%
Cash-on-Cash Return
2.0%
Cap rate
0.8%
Rent to Value Ratio
Active
$2,395,000
bds
|
1
ba
|
456
sqft
|
built
1936
928 Jefferson Ave, Miami Beach, FL 33139
$-12,151
Cash flow
-26.5%
Cash-on-Cash Return
0.2%
Cap rate
0.1%
Rent to Value Ratio
Active
$2,395,000
bds
|
1
ba
|
526
sqft
|
built
1936
928 Jefferson Ave, Miami Beach, FL 33139
$-12,035
Cash flow
-26.2%
Cash-on-Cash Return
0.3%
Cap rate
0.1%
Rent to Value Ratio
Active
$2,395,000
bds
|
1
ba
|
443
sqft
|
built
1936
928 Jefferson Ave, Miami Beach, FL 33139
$-12,082
Cash flow
-26.3%
Cash-on-Cash Return
0.2%
Cap rate
0.1%
Rent to Value Ratio

Active
$459,000
3
bds
|
2
ba
|
1,251
sqft
|
built
1971
8305 Crespi Blvd, Miami Beach, FL 33141
$-733
Cash flow
-8.3%
Cash-on-Cash Return
4.4%
Cap rate
0.8%
Rent to Value Ratio
Active
$960,000
2
bds
|
3
ba
|
1,440
sqft
|
built
1981
801 N Venetian Dr, Miami Beach, FL 33139
$-4,216
Cash flow
-22.9%
Cash-on-Cash Return
1.0%
Cap rate
0.6%
Rent to Value Ratio