Miami Beach, FL Investment Properties for Sale
Browse homes for sale and investment properties in Miami Beach, FL. Refine your search by price, property type, or more.
Best cash flowing properties in Miami Beach, FL
Active
$1,650,000
4
bds
|
0
ba
|
2,315
sqft
|
built
1949
820 86th St, Miami Beach, FL 33141
$-6,593
Cash flow
-20.8%
Cash-on-Cash Return
1.4%
Cap rate
0.2%
Rent to Value Ratio
Active
$1,575,000
8
bds
|
0
ba
|
4,439
sqft
|
built
1944
1797 Marseille Dr, Miami Beach, FL 33141
$-6,610
Cash flow
-21.9%
Cash-on-Cash Return
1.1%
Cap rate
0.2%
Rent to Value Ratio
22 out of 33 properties for sale in Miami Beach, FL
Limited Results Shown
Create a free account, or log in to reveal all property listings and enjoy the complete experience.
Active
$2,750,000
bds
|
0
ba
|
4,460
sqft
|
built
1955
1420 16th St, Miami Beach, FL 33139
$-13,909
Cash flow
-26.4%
Cash-on-Cash Return
0.1%
Cap rate
0.1%
Rent to Value Ratio
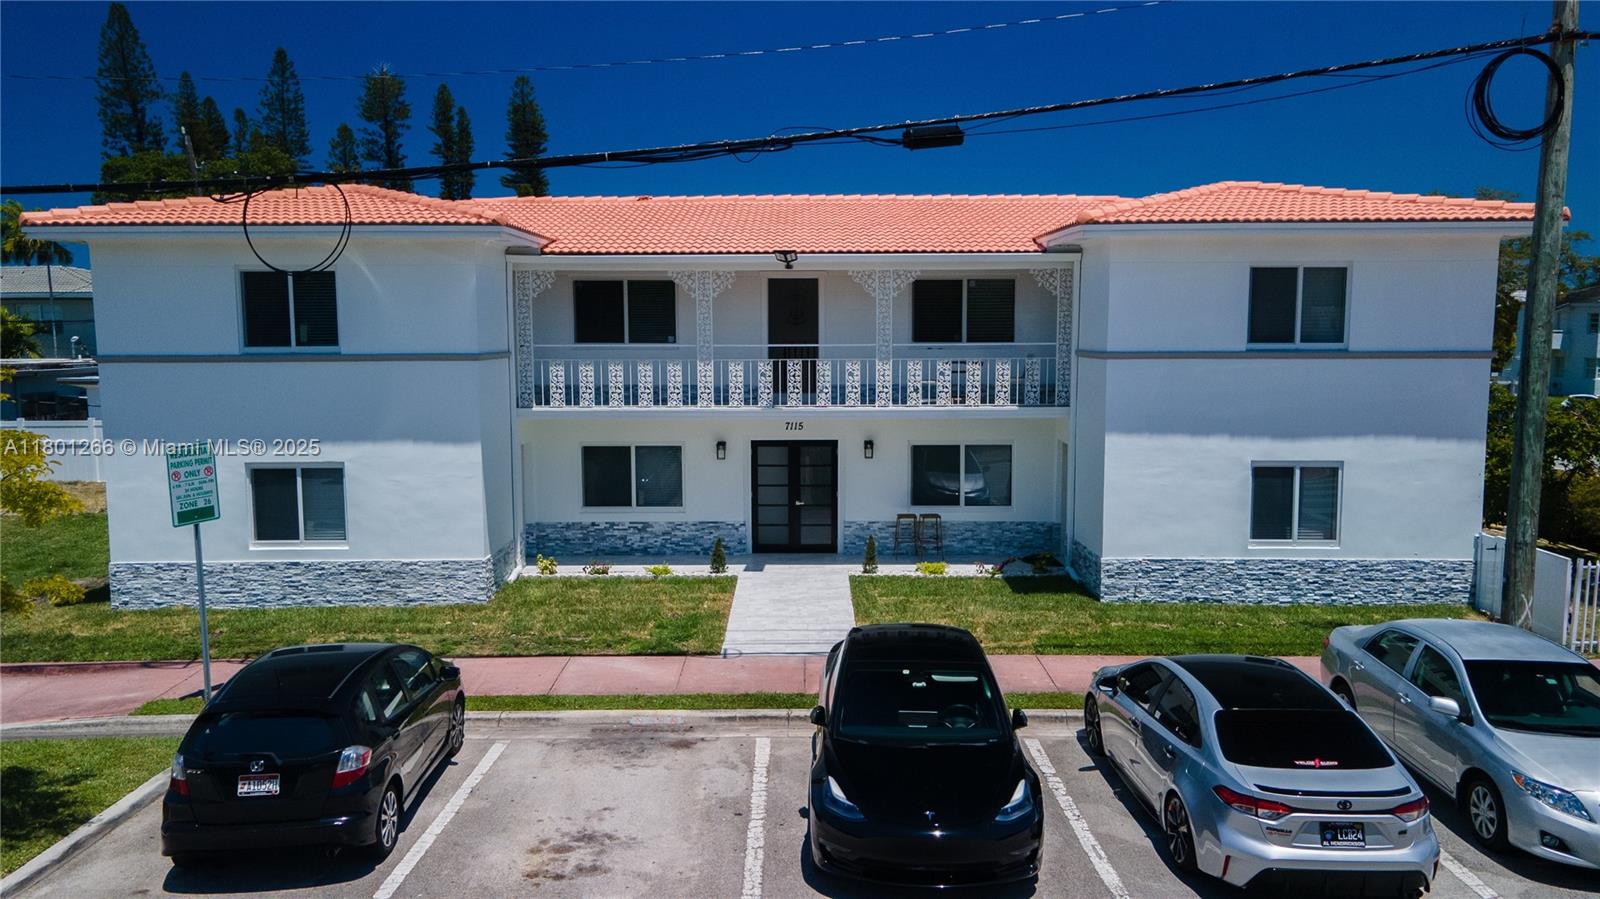
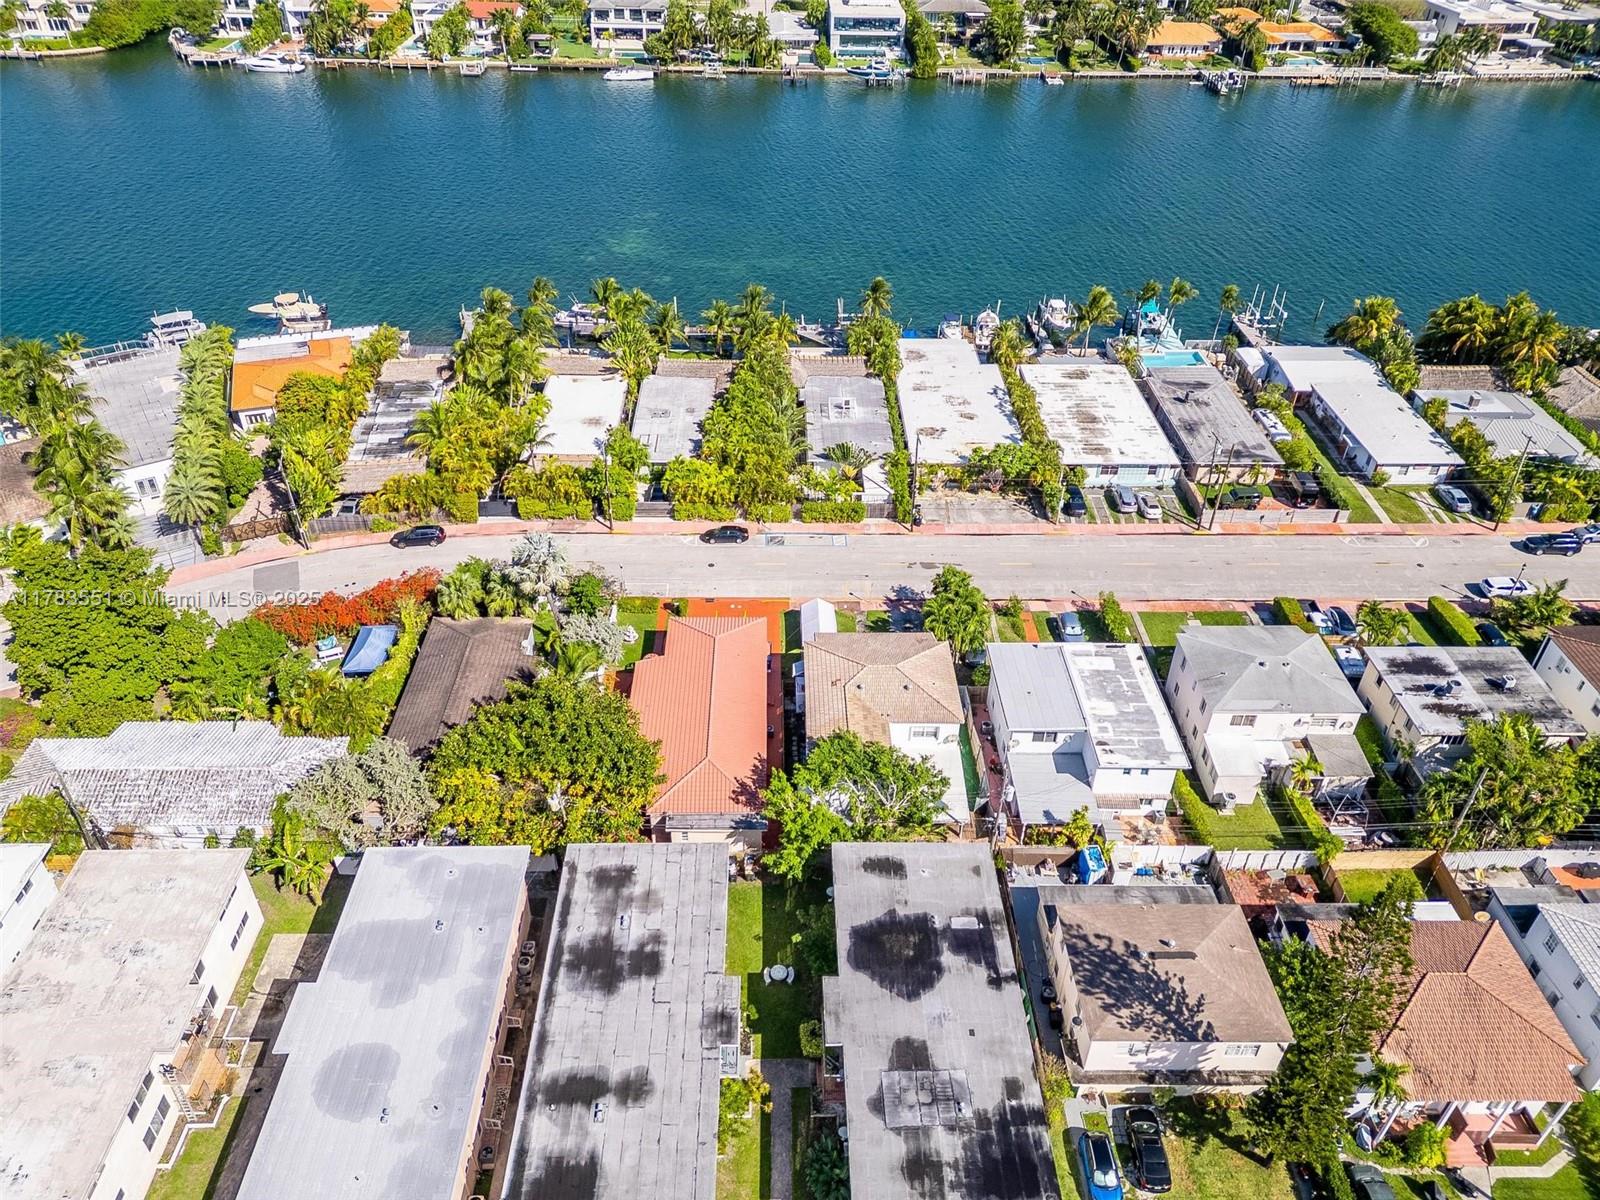
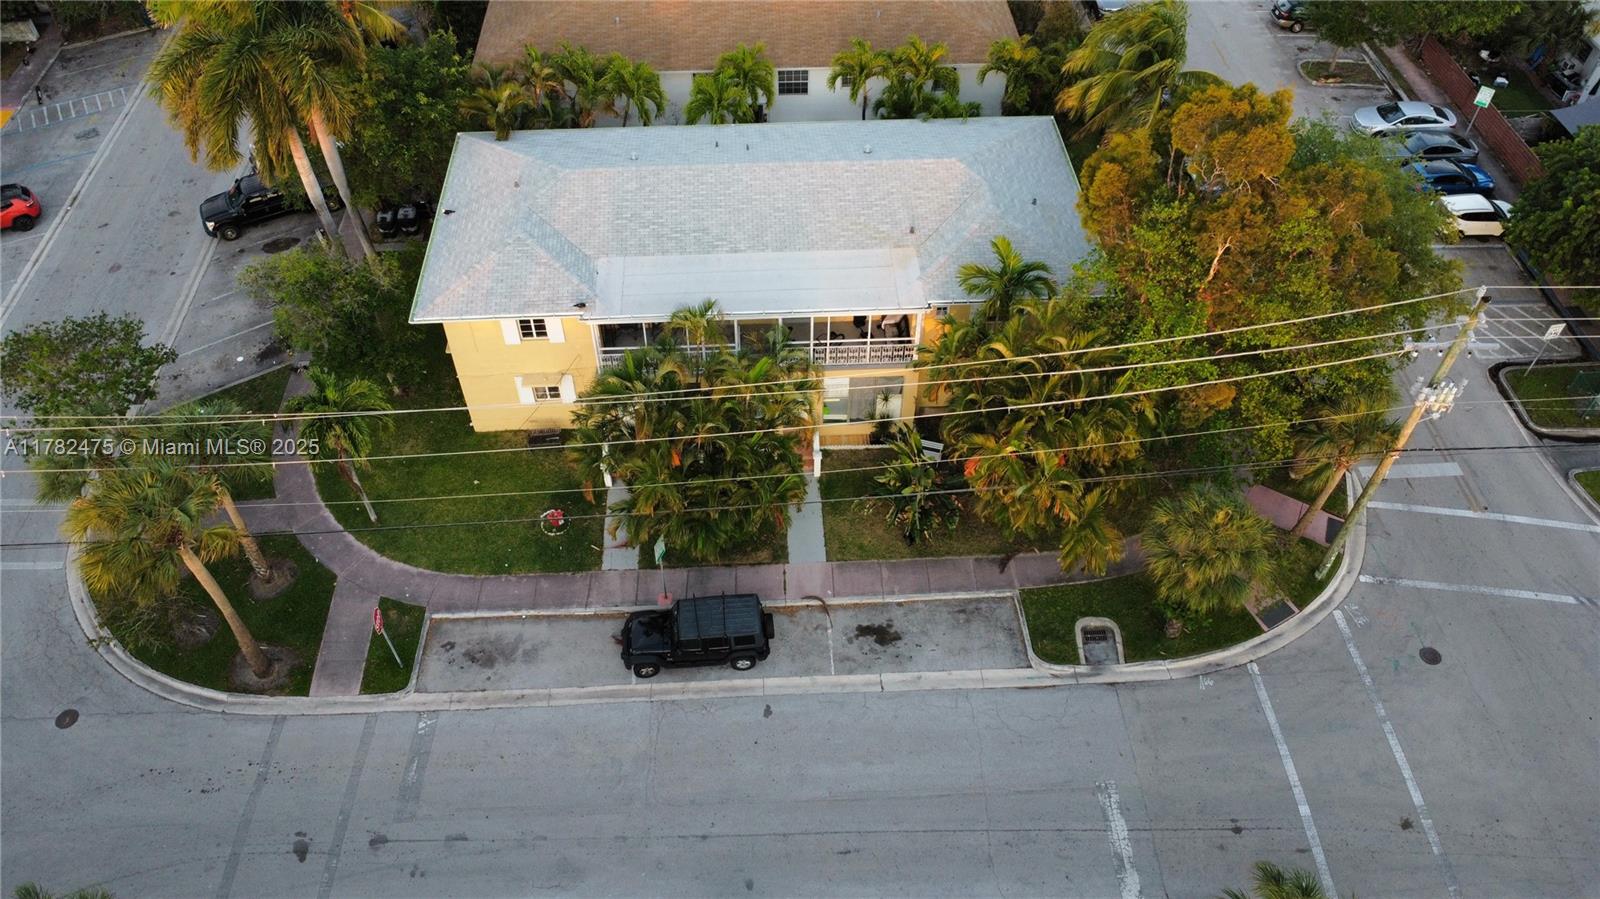
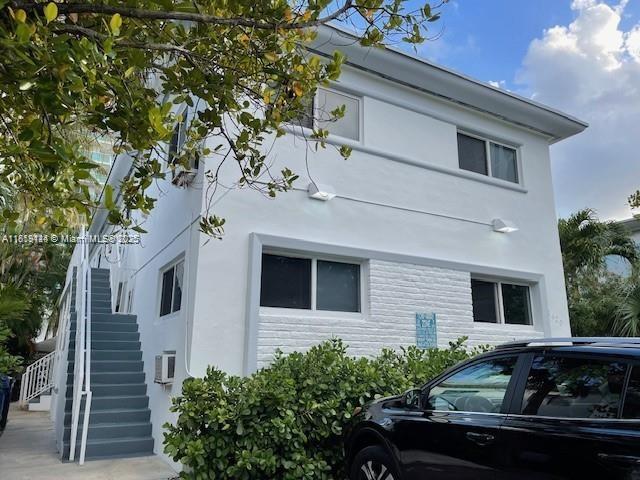
Active
$2,550,000
8
bds
|
0
ba
|
4,524
sqft
|
built
1947
7115 Rue Granville, Miami Beach, FL 33141
$-12,602
Cash flow
-25.8%
Cash-on-Cash Return
0.2%
Cap rate
0.1%
Rent to Value Ratio
Active
$1,900,000
8
bds
|
0
ba
|
4,905
sqft
|
built
1956
865 80th St, Miami Beach, FL 33141
$-9,180
Cash flow
-25.2%
Cash-on-Cash Return
0.3%
Cap rate
0.1%
Rent to Value Ratio
Active
$2,100,000
1
bds
|
0
ba
|
0
sqft
|
built
1948
847 81st St, Miami Beach, FL 33141
$-12,037
Cash flow
-29.9%
Cash-on-Cash Return
-0.7%
Cap rate
0.1%
Rent to Value Ratio

Active
$1,849,900
6
bds
|
0
ba
|
2,668
sqft
|
built
1946
7411 Carlyle Ave, Miami Beach, FL 33141
$-9,602
Cash flow
-27.1%
Cash-on-Cash Return
-0.1%
Cap rate
0.1%
Rent to Value Ratio
Active
$1,950,000
8
bds
|
0
ba
|
4,181
sqft
|
built
1938
1241 13th St, Miami Beach, FL 33139
$-8,520
Cash flow
-22.8%
Cash-on-Cash Return
0.9%
Cap rate
0.4%
Rent to Value Ratio
Active
$6,800,000
4
bds
|
0
ba
|
3,008
sqft
|
built
1937
560 Michigan Ave, Miami Beach, FL 33139
$-32,695
Cash flow
-25.1%
Cash-on-Cash Return
0.4%
Cap rate
0.1%
Rent to Value Ratio
Active
$1,650,000
4
bds
|
0
ba
|
2,315
sqft
|
built
1949
820 86th St, Miami Beach, FL 33141
$-6,593
Cash flow
-20.8%
Cash-on-Cash Return
1.4%
Cap rate
0.2%
Rent to Value Ratio
Active
$1,575,000
8
bds
|
0
ba
|
4,439
sqft
|
built
1944
1797 Marseille Dr, Miami Beach, FL 33141
$-6,610
Cash flow
-21.9%
Cash-on-Cash Return
1.1%
Cap rate
0.2%
Rent to Value Ratio
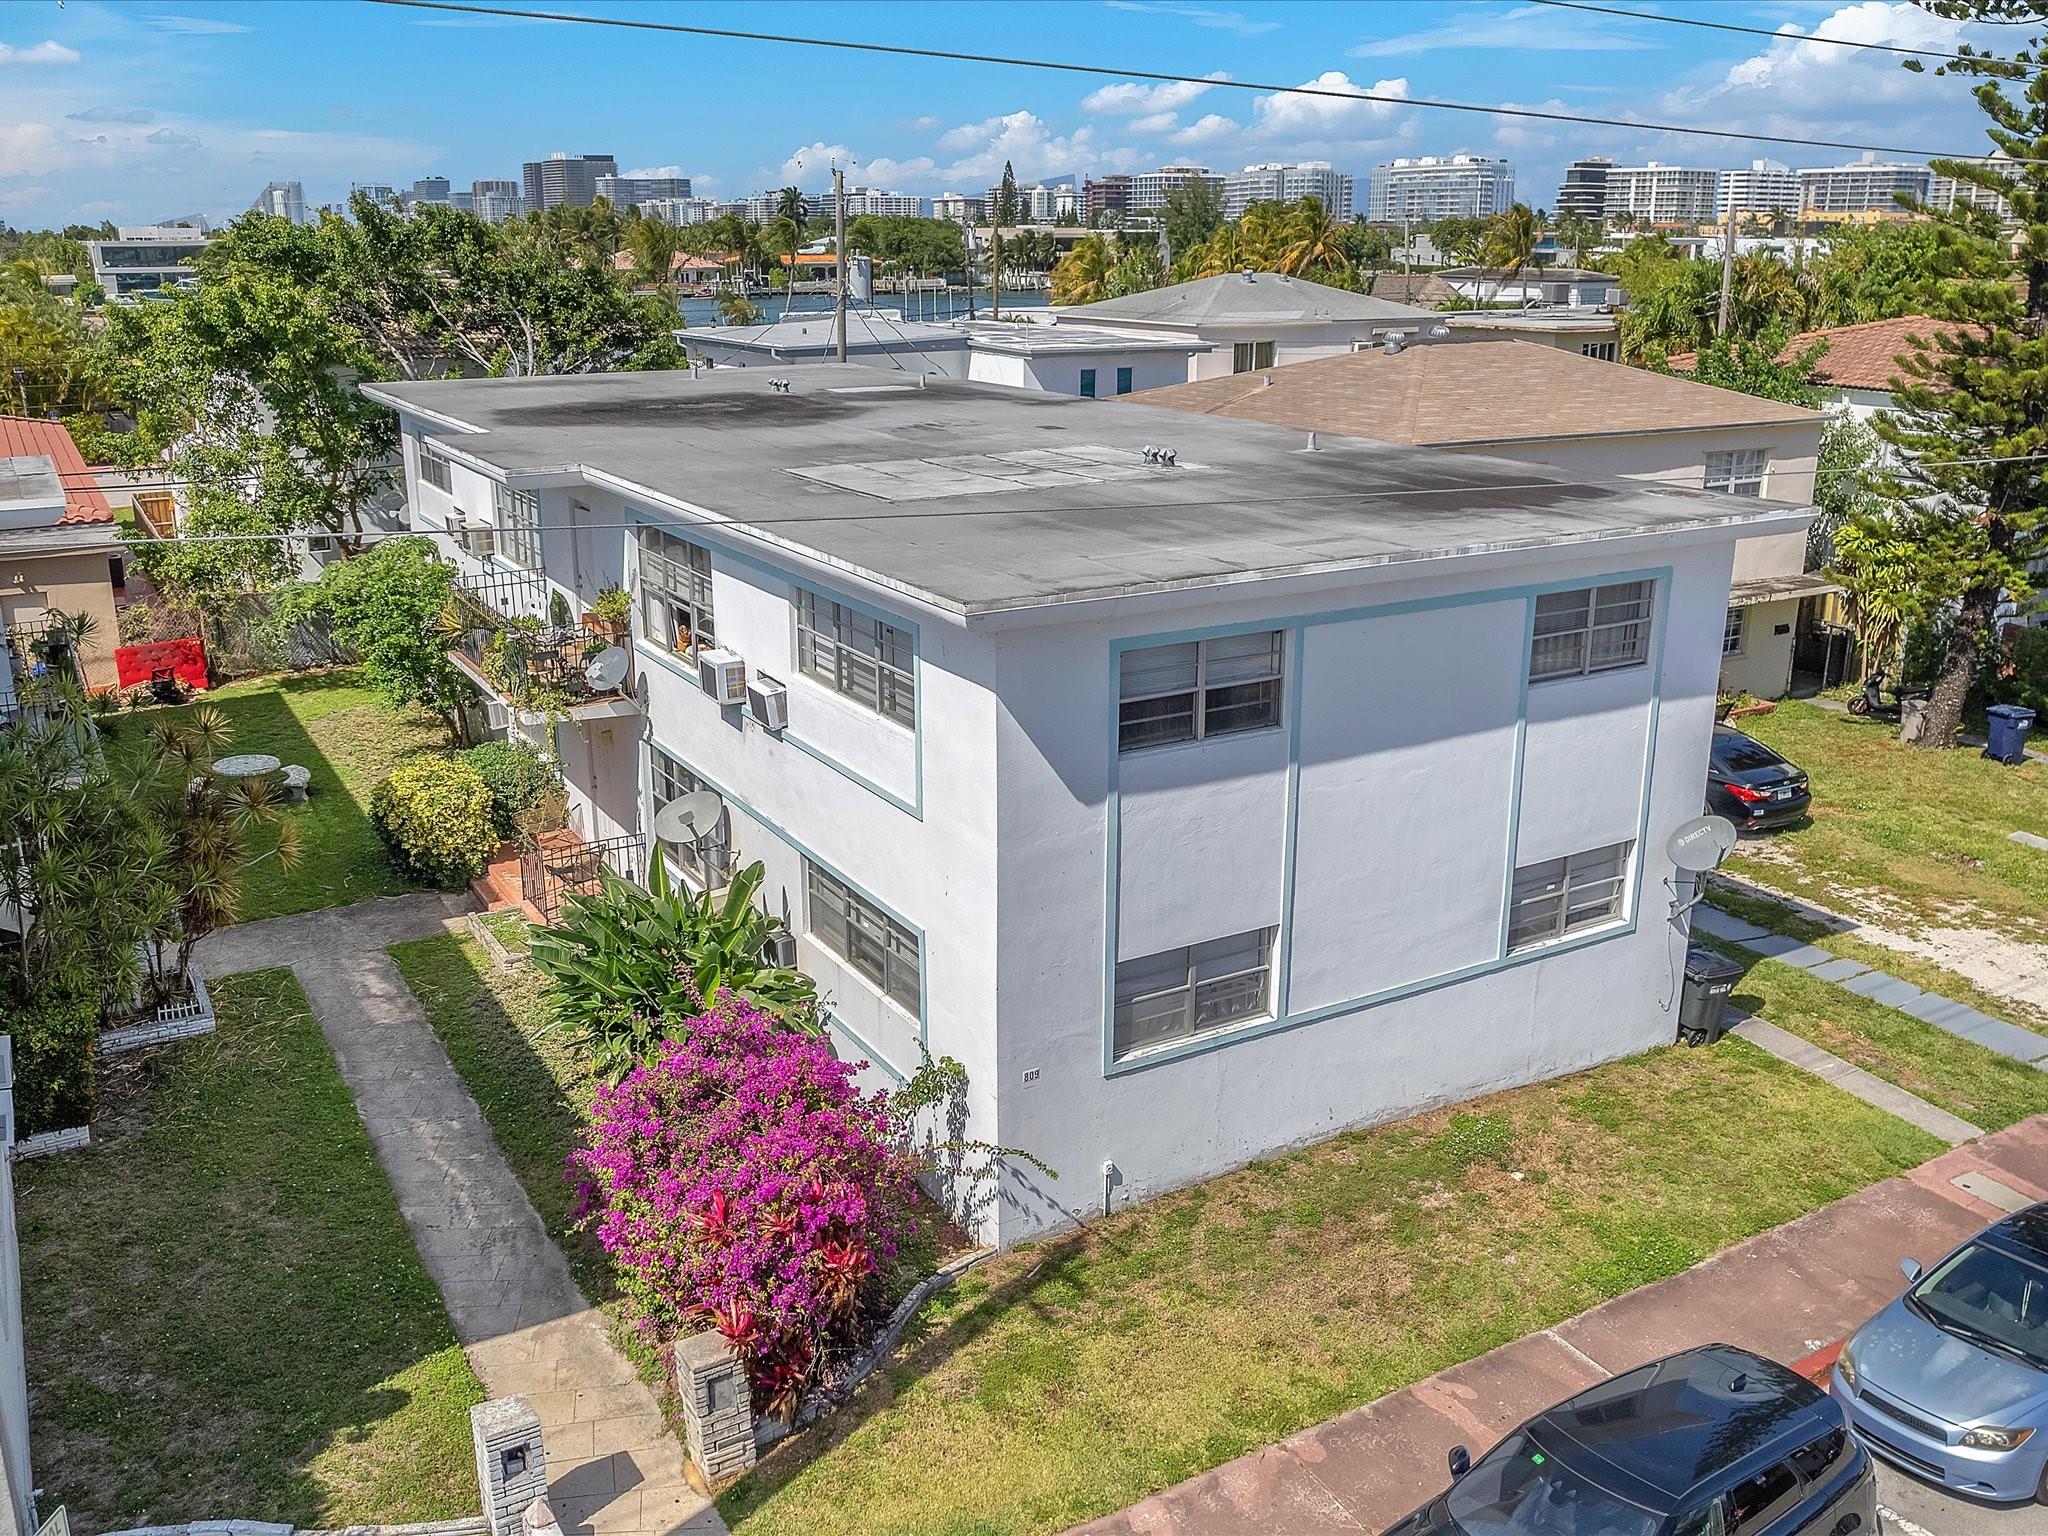
Active
$1,600,000
8
bds
|
0
ba
|
4,731
sqft
|
built
1955
809 85th St, Miami Beach, FL 33141
$-7,263
Cash flow
-23.7%
Cash-on-Cash Return
0.7%
Cap rate
0.2%
Rent to Value Ratio
Active
$1,900,000
6
bds
|
0
ba
|
3,041
sqft
|
built
1939
836 W 40th St, Miami Beach, FL 33140
$-7,435
Cash flow
-20.4%
Cash-on-Cash Return
1.5%
Cap rate
0.3%
Rent to Value Ratio
Active
$2,750,000
6
bds
|
0
ba
|
3,952
sqft
|
built
1950
1471 Lincoln Ter, Miami Beach, FL 33139
$-14,038
Cash flow
-26.6%
Cash-on-Cash Return
0.0%
Cap rate
0.1%
Rent to Value Ratio
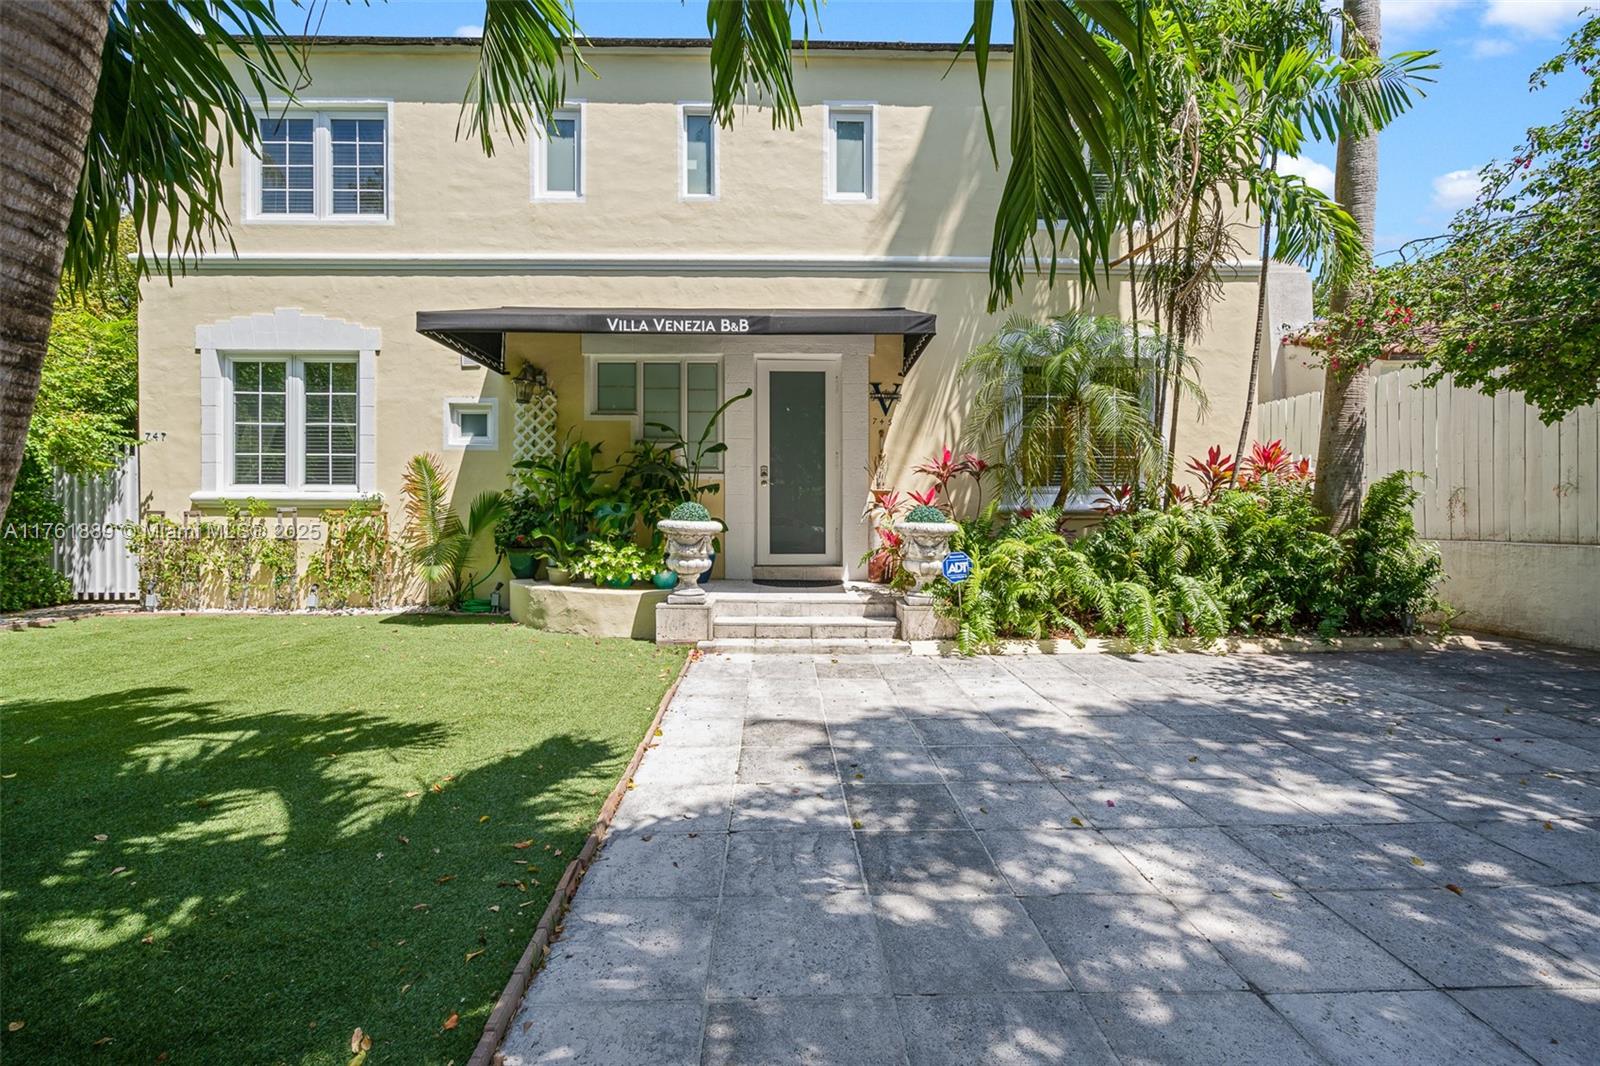
Active
$3,350,000
bds
|
0
ba
|
5,212
sqft
|
built
1952
745 Lenox Ave, Miami Beach, FL 33139
$-14,334
Cash flow
-22.3%
Cash-on-Cash Return
1.0%
Cap rate
0.2%
Rent to Value Ratio
Active
$2,200,000
7
bds
|
0
ba
|
3,581
sqft
|
built
1925
1311 15th Ter, Miami Beach, FL 33139
$-10,438
Cash flow
-24.8%
Cash-on-Cash Return
0.5%
Cap rate
0.2%
Rent to Value Ratio
Active
$4,199,000
6
bds
|
0
ba
|
3,930
sqft
|
built
1949
1995 Calais Dr, Miami Beach, FL 33141
$-21,014
Cash flow
-26.1%
Cash-on-Cash Return
0.1%
Cap rate
0.1%
Rent to Value Ratio
Active
$1,650,000
4
bds
|
0
ba
|
3,785
sqft
|
built
1949
7345 Dickens Ave, Miami Beach, FL 33141
$-7,878
Cash flow
-24.9%
Cash-on-Cash Return
0.4%
Cap rate
0.2%
Rent to Value Ratio

Active
$2,895,000
3
bds
|
0
ba
|
4,042
sqft
|
built
1950
1622 Bay Rd, Miami Beach, FL 33139
$-12,573
Cash flow
-22.7%
Cash-on-Cash Return
0.9%
Cap rate
0.2%
Rent to Value Ratio

Active
$3,040,000
2
bds
|
0
ba
|
2,809
sqft
|
built
2006
734 Michigan Ave, Miami Beach, FL 33139
$-15,303
Cash flow
-26.3%
Cash-on-Cash Return
0.1%
Cap rate
0.1%
Rent to Value Ratio
Active
$9,790,000
8
bds
|
0
ba
|
5,366
sqft
|
built
1956
3921 N Meridian Ave, Miami Beach, FL 33140
$-49,624
Cash flow
-26.4%
Cash-on-Cash Return
0.1%
Cap rate
0.0%
Rent to Value Ratio
Active
$2,390,000
1
bds
|
0
ba
|
1,784
sqft
|
built
1940
8109 Harding Ave, Miami Beach, FL 33141
$-10,509
Cash flow
-22.9%
Cash-on-Cash Return
0.9%
Cap rate
0.2%
Rent to Value Ratio

Active
$2,820,000
10
bds
|
0
ba
|
5,426
sqft
|
built
1948
1150 8th St, Miami Beach, FL 33139
$-15,123
Cash flow
-28.0%
Cash-on-Cash Return
-0.3%
Cap rate
0.1%
Rent to Value Ratio
Active
$2,100,000
2
bds
|
0
ba
|
4,278
sqft
|
built
1947
1310 15th St, Miami Beach, FL 33139
$-8,349
Cash flow
-20.7%
Cash-on-Cash Return
1.4%
Cap rate
0.3%
Rent to Value Ratio