Miami Beach, FL Investment Properties for Sale
Browse homes for sale and investment properties in Miami Beach, FL. Refine your search by price, property type, or more.
Best cash flowing properties in Miami Beach, FL
Active
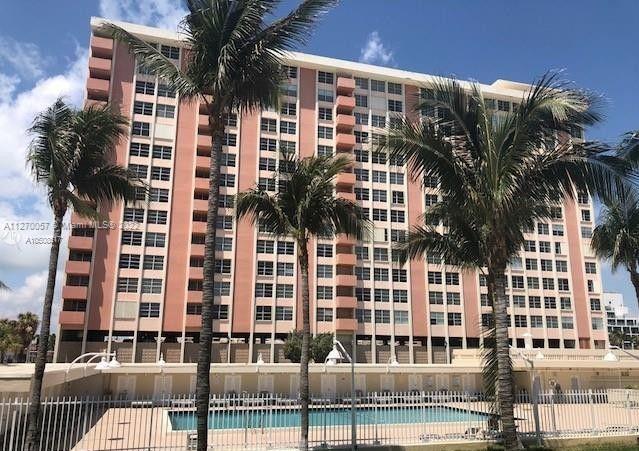
$96,500
bds
|
0
ba
|
112
sqft
|
built
1966
2899 Collins Ave, Miami Beach, FL 33140
$1,120
Cash flow
60.6%
Cash-on-Cash Return
20.2%
Cap rate
2.7%
Rent to Value Ratio
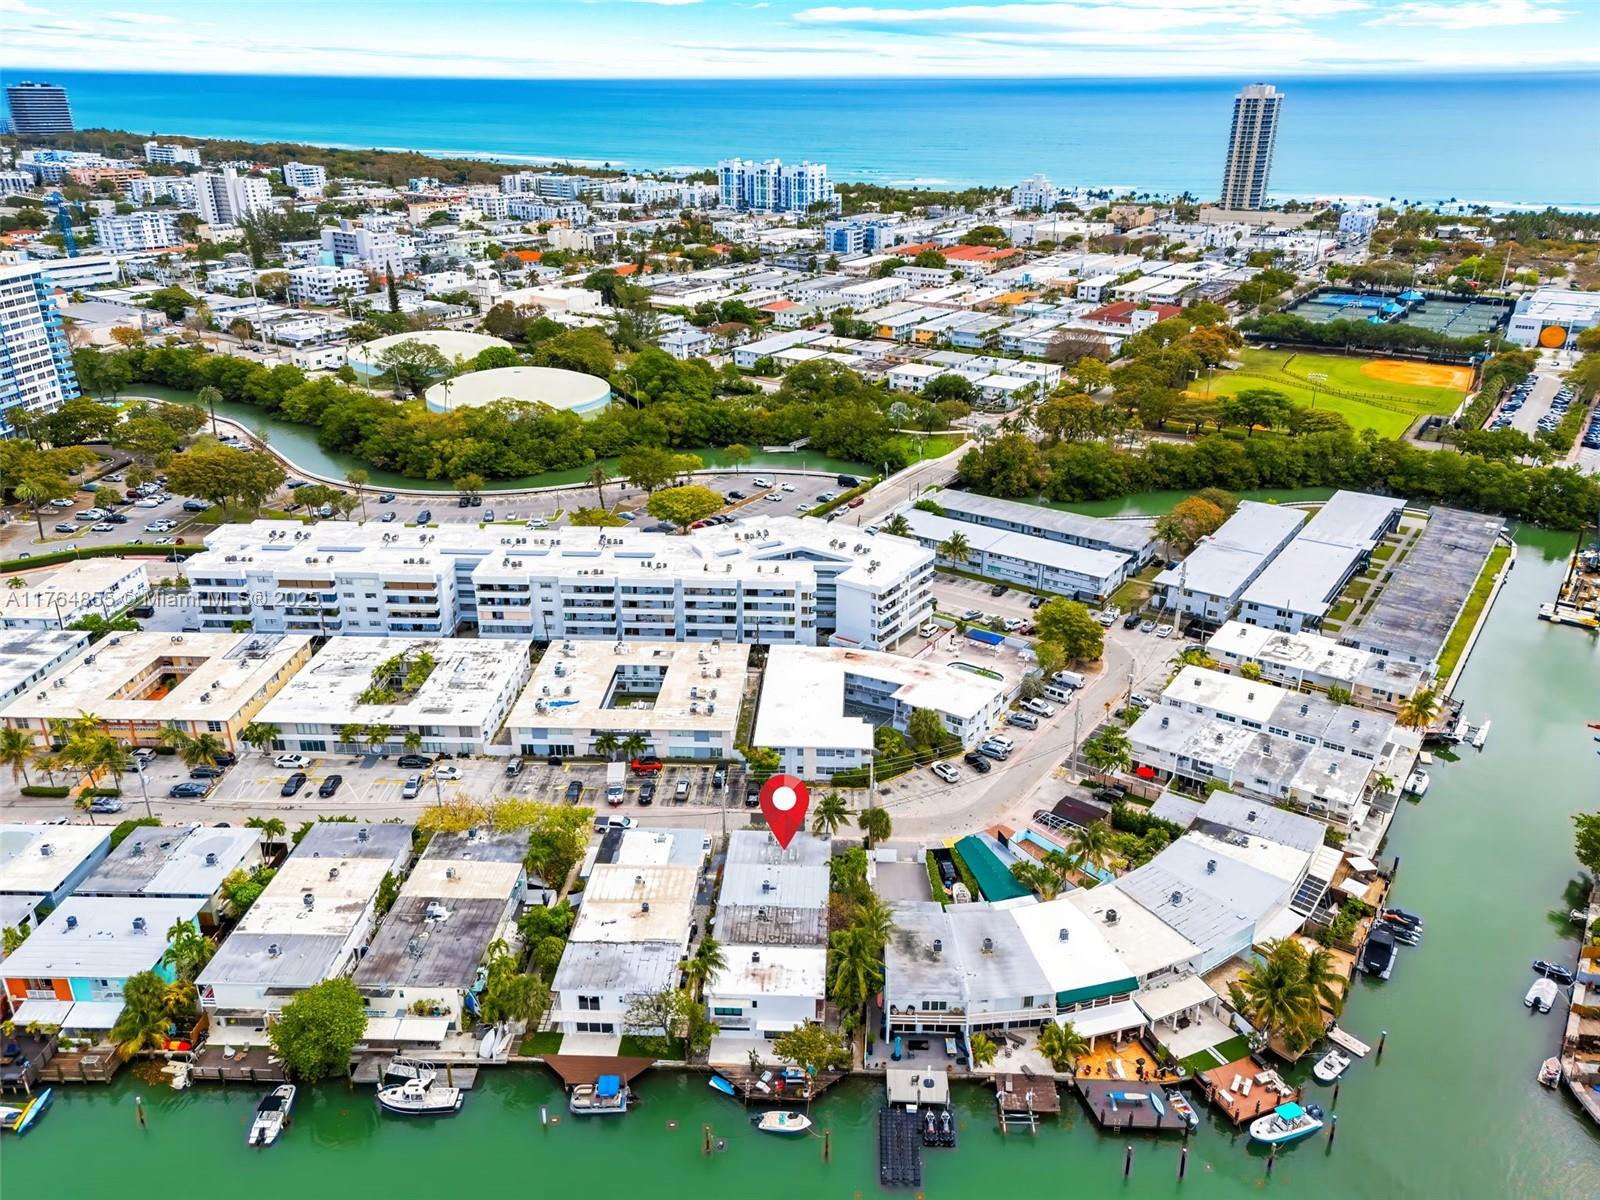
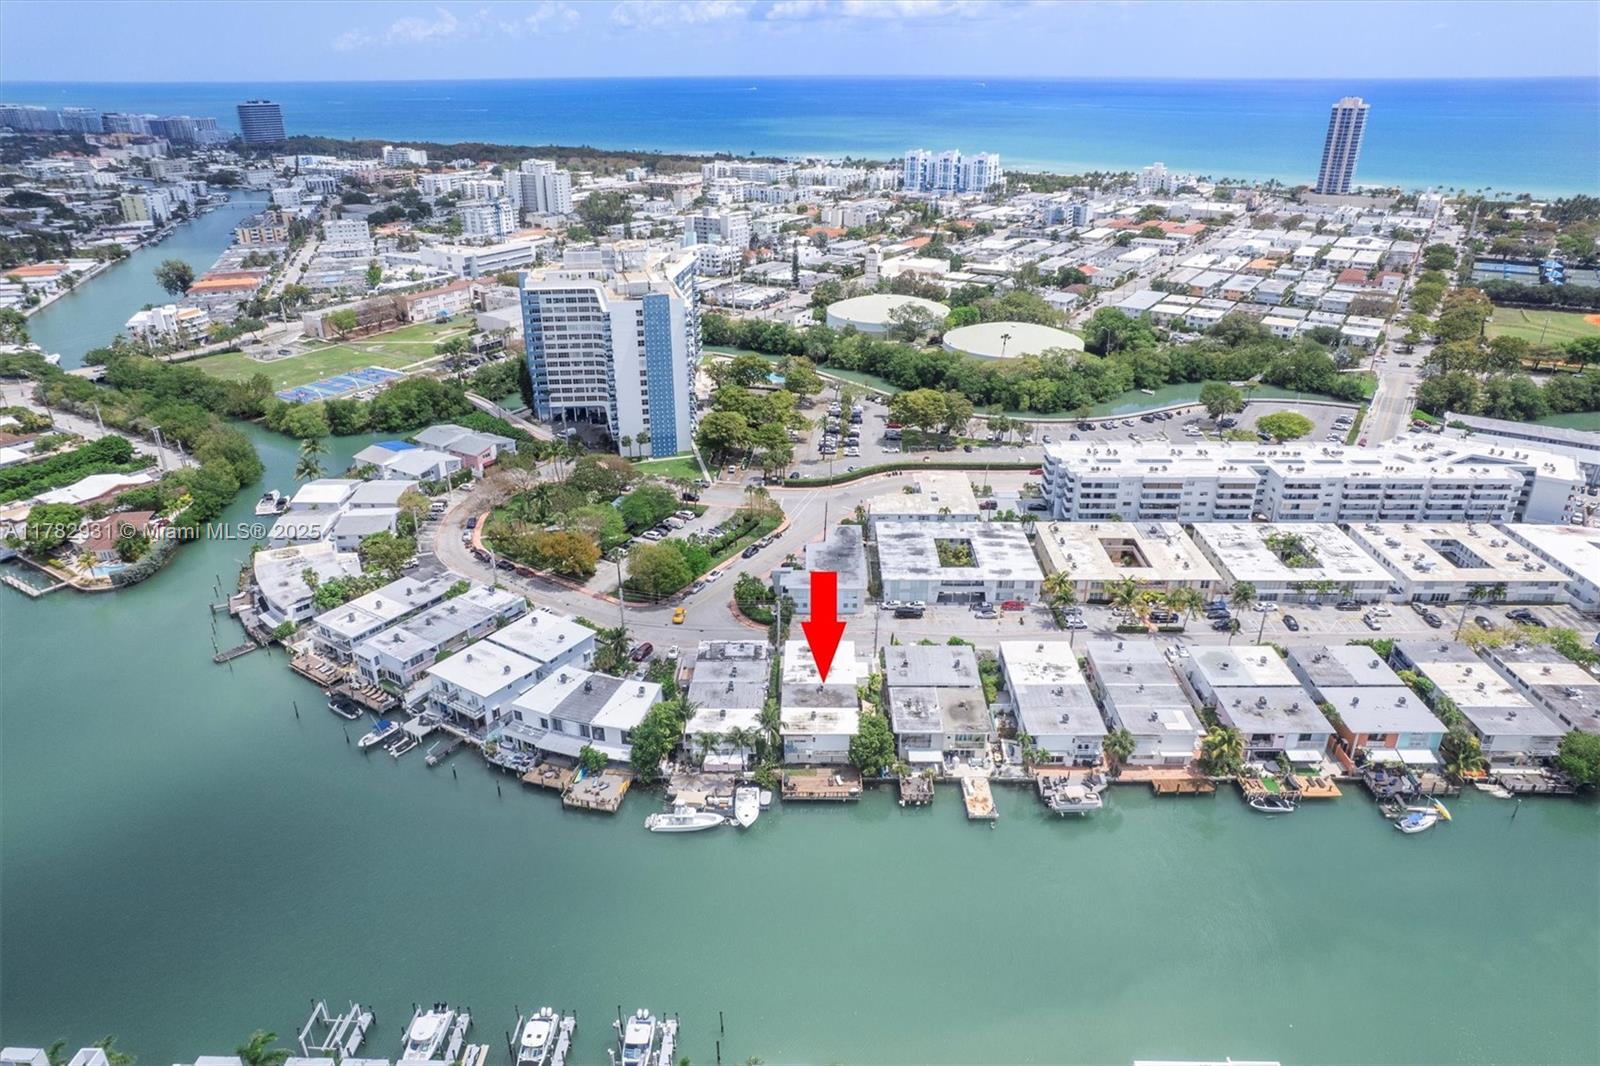
Active
$639,500
3
bds
|
2
ba
|
1,632
sqft
|
built
1956
7270 Gary Ave, Miami Beach, FL 33141
$-735
Cash flow
-6.0%
Cash-on-Cash Return
4.9%
Cap rate
0.8%
Rent to Value Ratio
15 out of 22 properties for sale in Miami Beach, FL
Limited Results Shown
Create a free account, or log in to reveal all property listings and enjoy the complete experience.
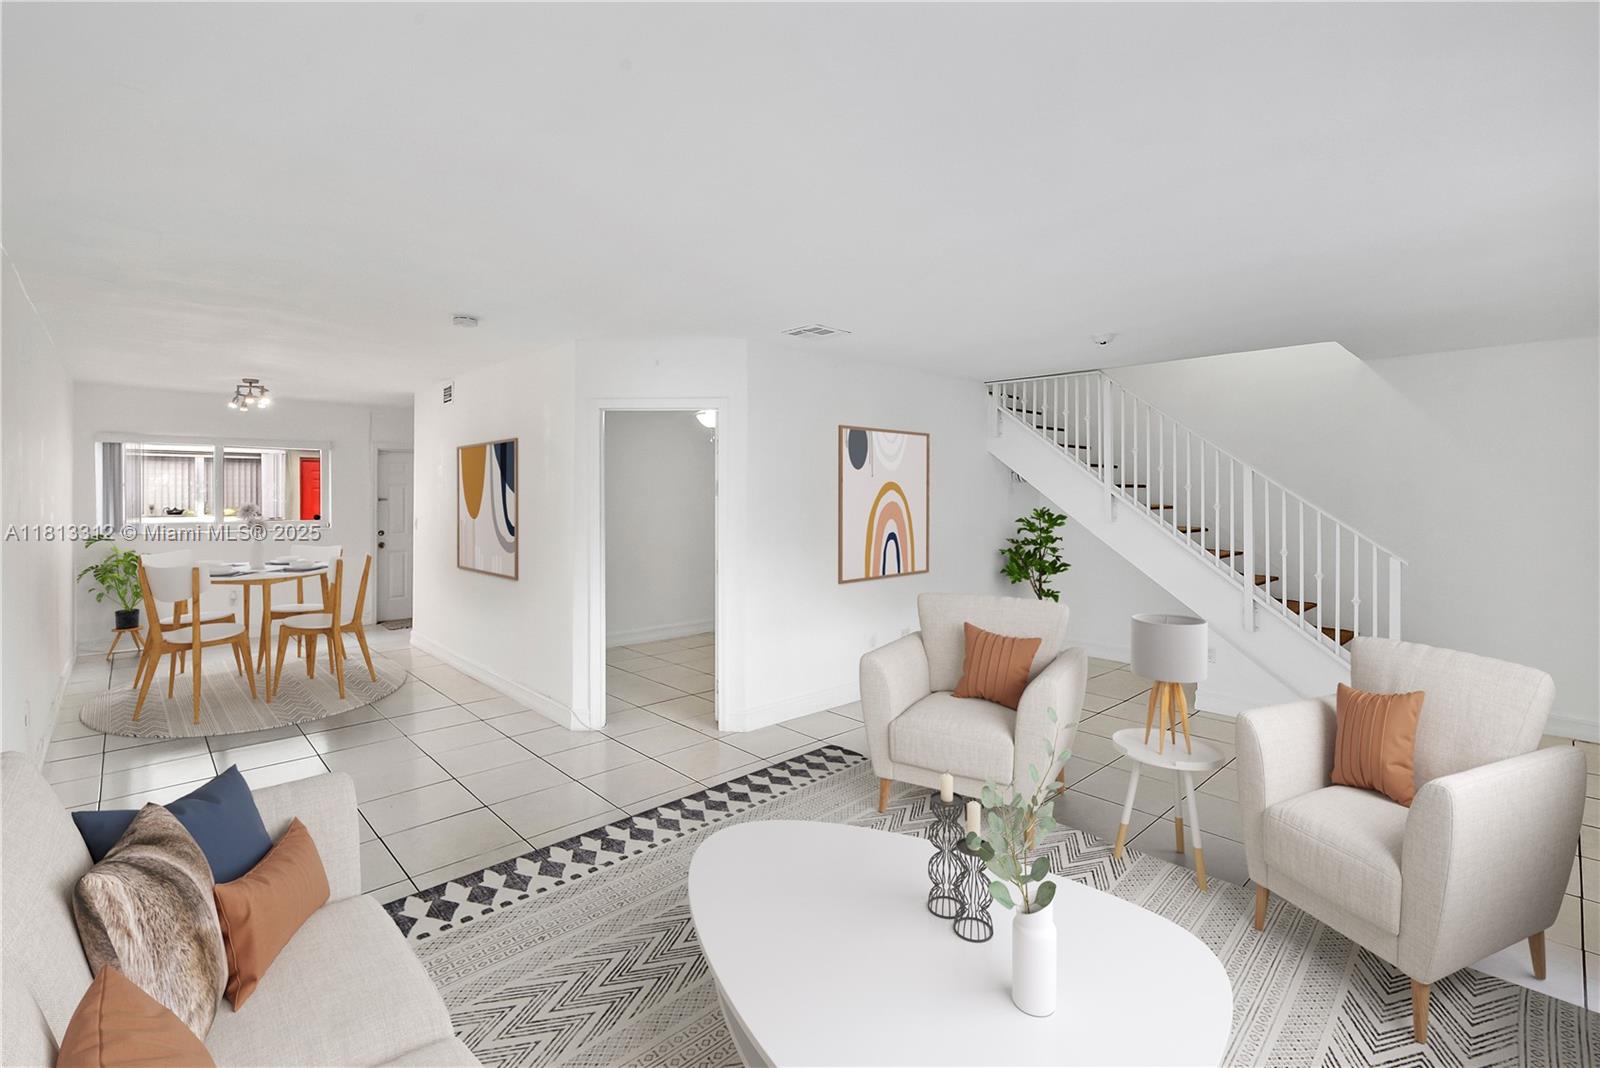
Active
$598,900
4
bds
|
3
ba
|
1,632
sqft
|
built
1956
7342 Gary Ave, Miami Beach, FL 33141
$-1,139
Cash flow
-9.9%
Cash-on-Cash Return
4.0%
Cap rate
0.7%
Rent to Value Ratio
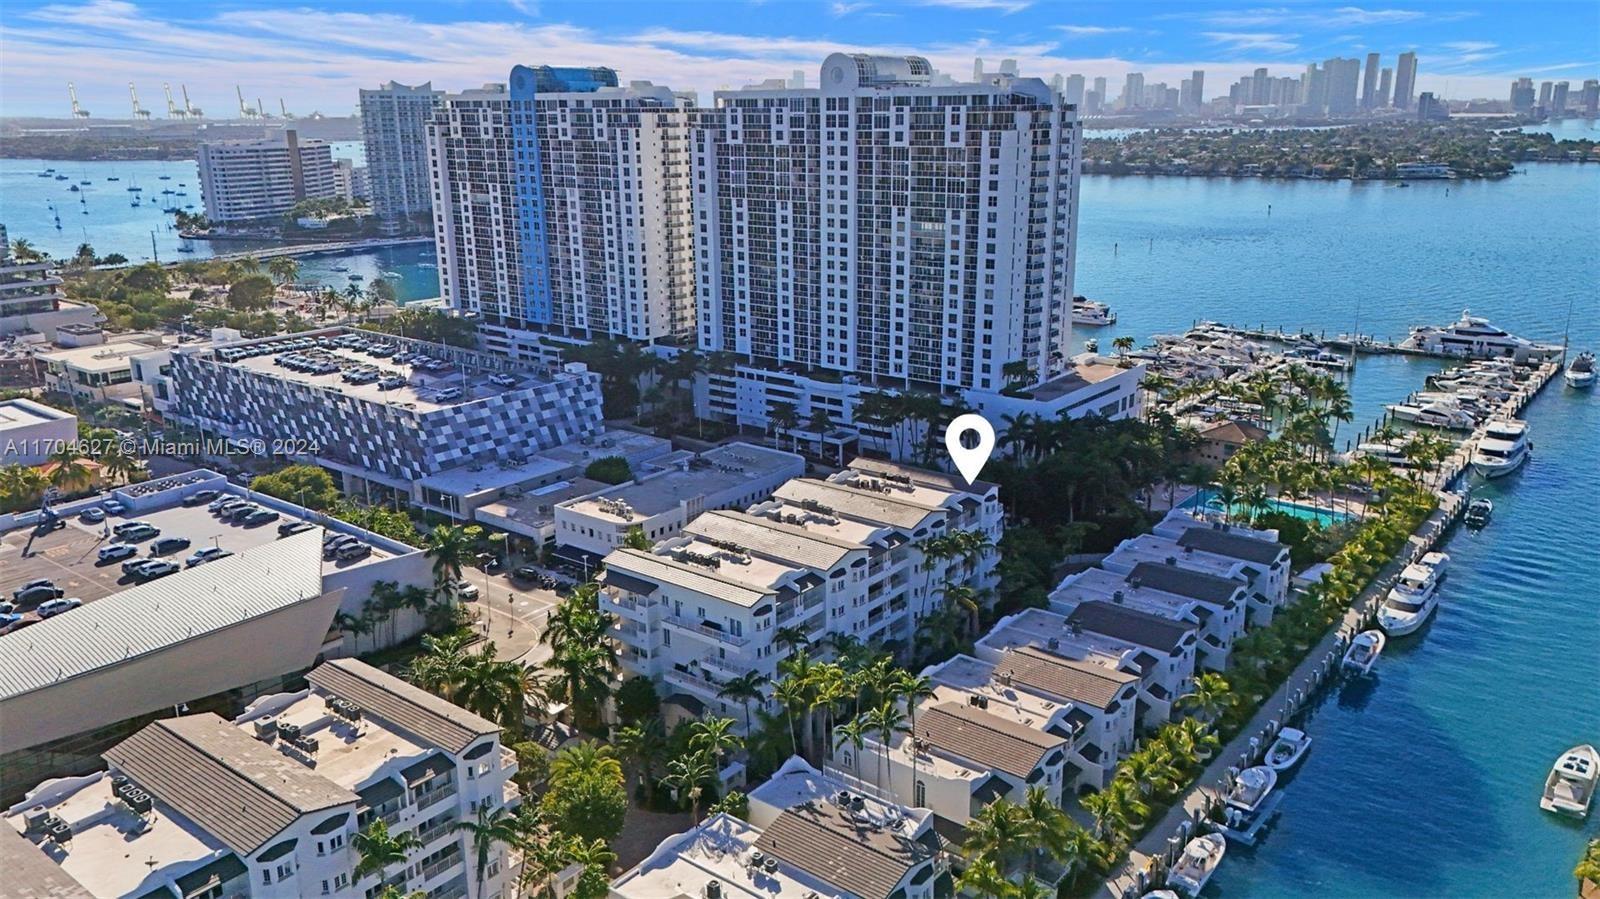
Active
$2,300,000
3
bds
|
3
ba
|
2,640
sqft
|
built
1997
1415 20th St, Miami Beach, FL 33139
$-8,359
Cash flow
-19.0%
Cash-on-Cash Return
1.9%
Cap rate
0.4%
Rent to Value Ratio
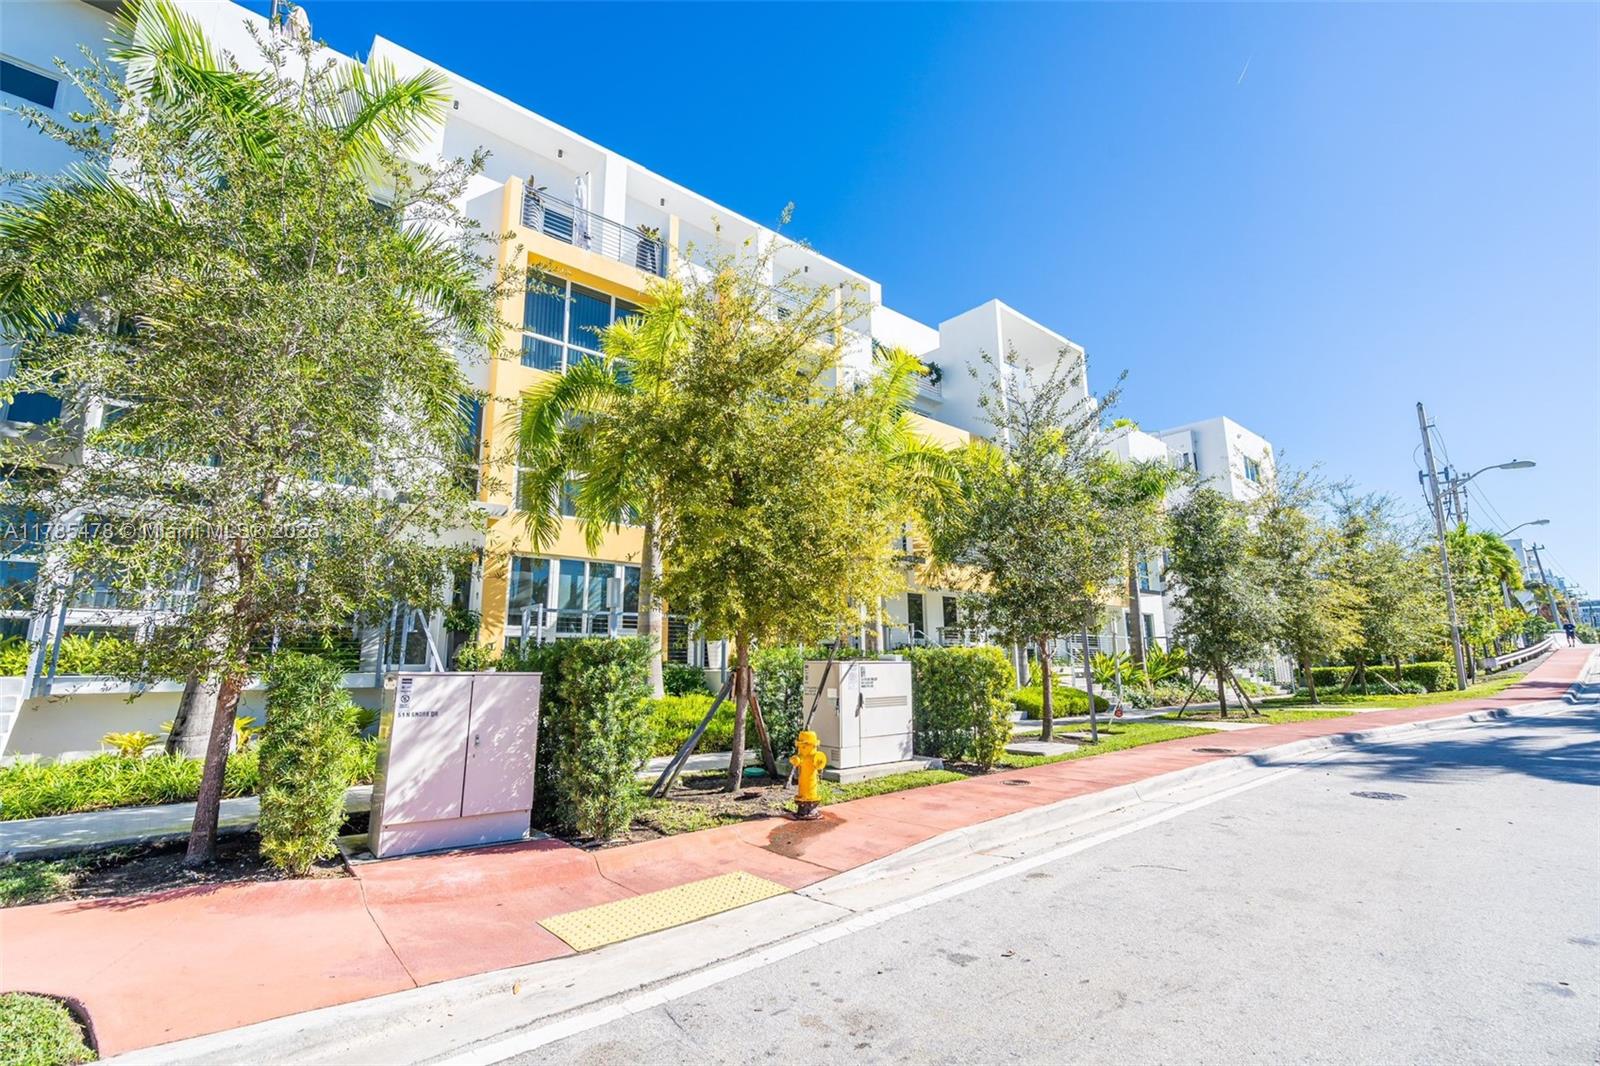
Active
$1,849,000
3
bds
|
4
ba
|
2,367
sqft
|
built
2006
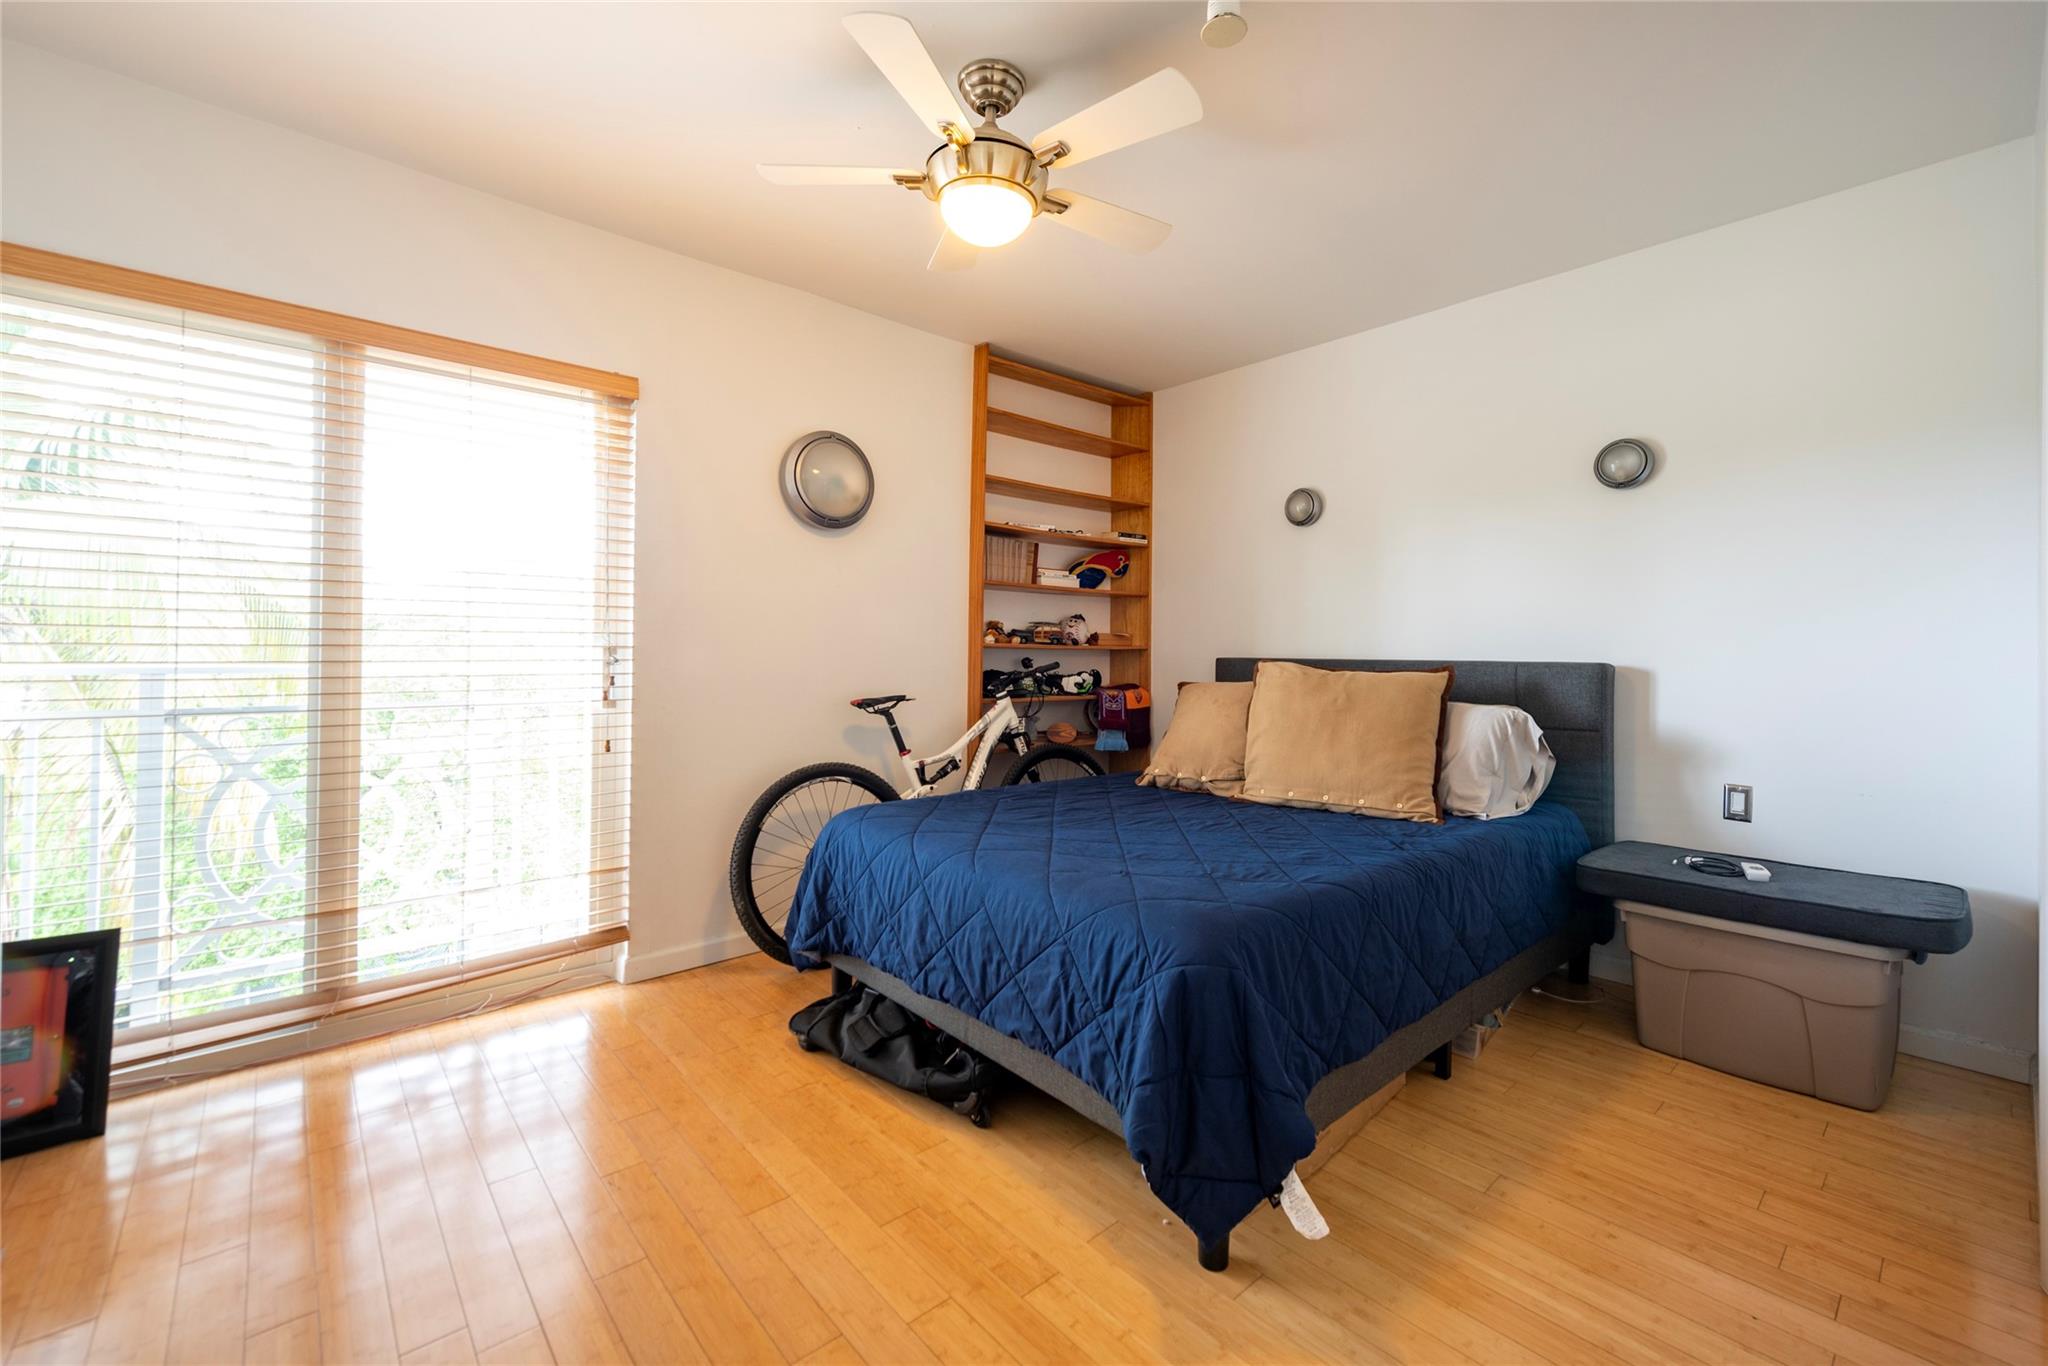
171 N Shore Dr, Miami Beach, FL 33141
$-7,085
Cash flow
-20.0%
Cash-on-Cash Return
1.7%
Cap rate
0.4%
Rent to Value Ratio
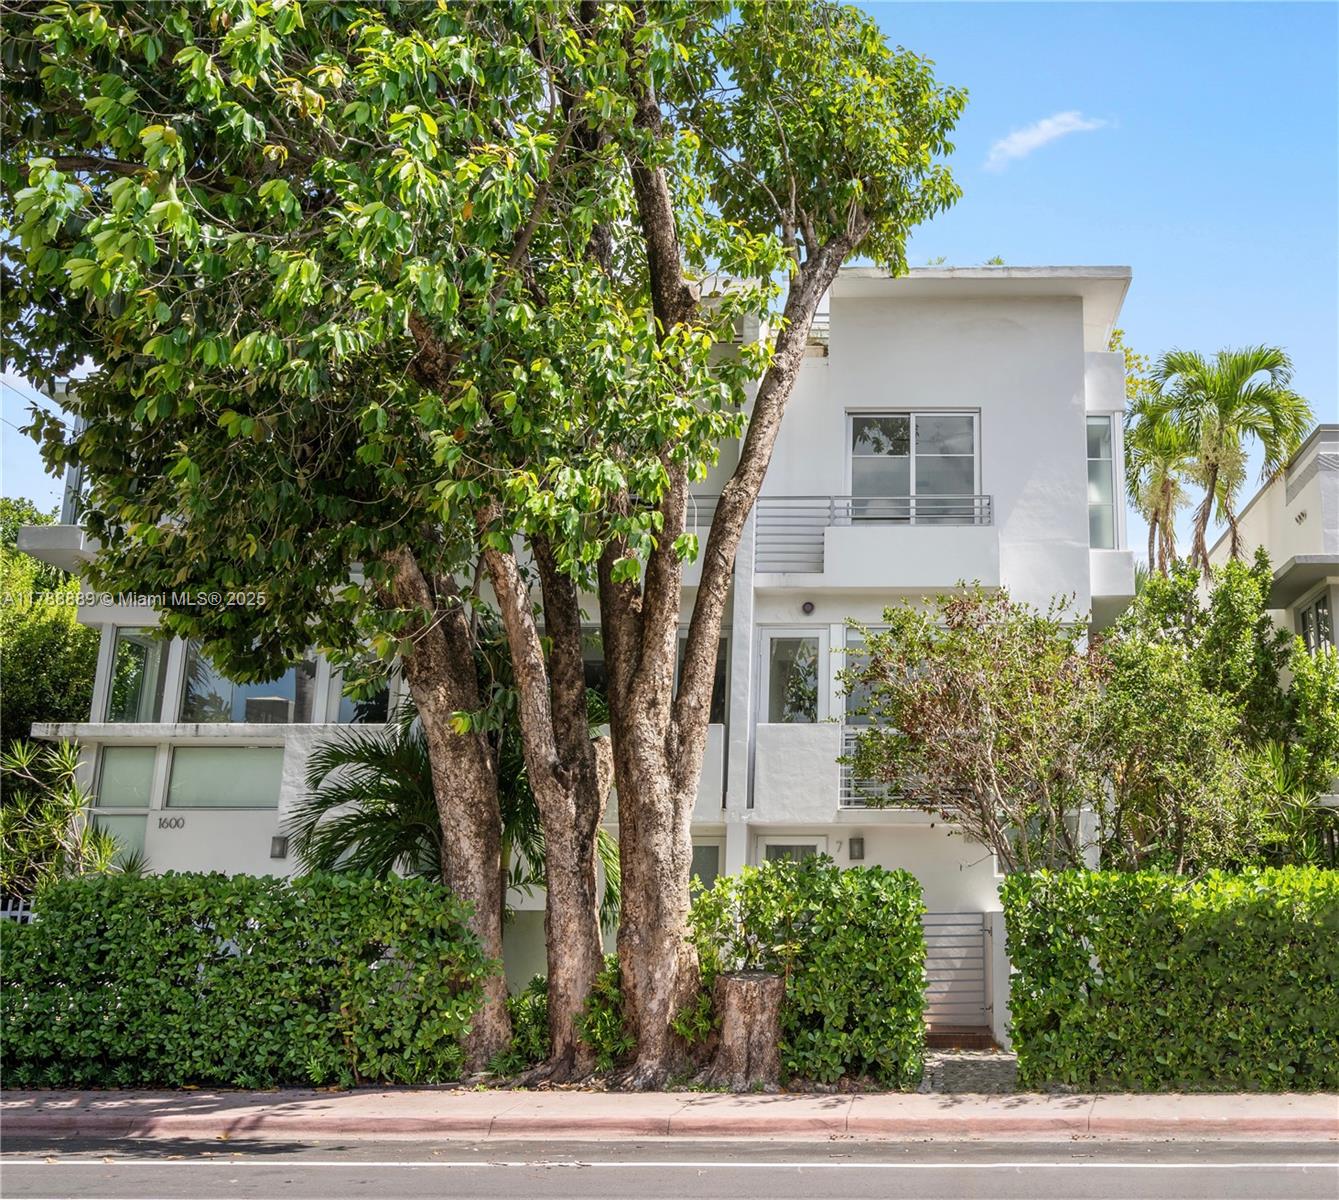
Active
$1,485,000
2
bds
|
2
ba
|
1,128
sqft
|
built
2011
1600 Michigan Ave, Miami Beach, FL 33139
$-5,325
Cash flow
-18.7%
Cash-on-Cash Return
2.0%
Cap rate
0.4%
Rent to Value Ratio
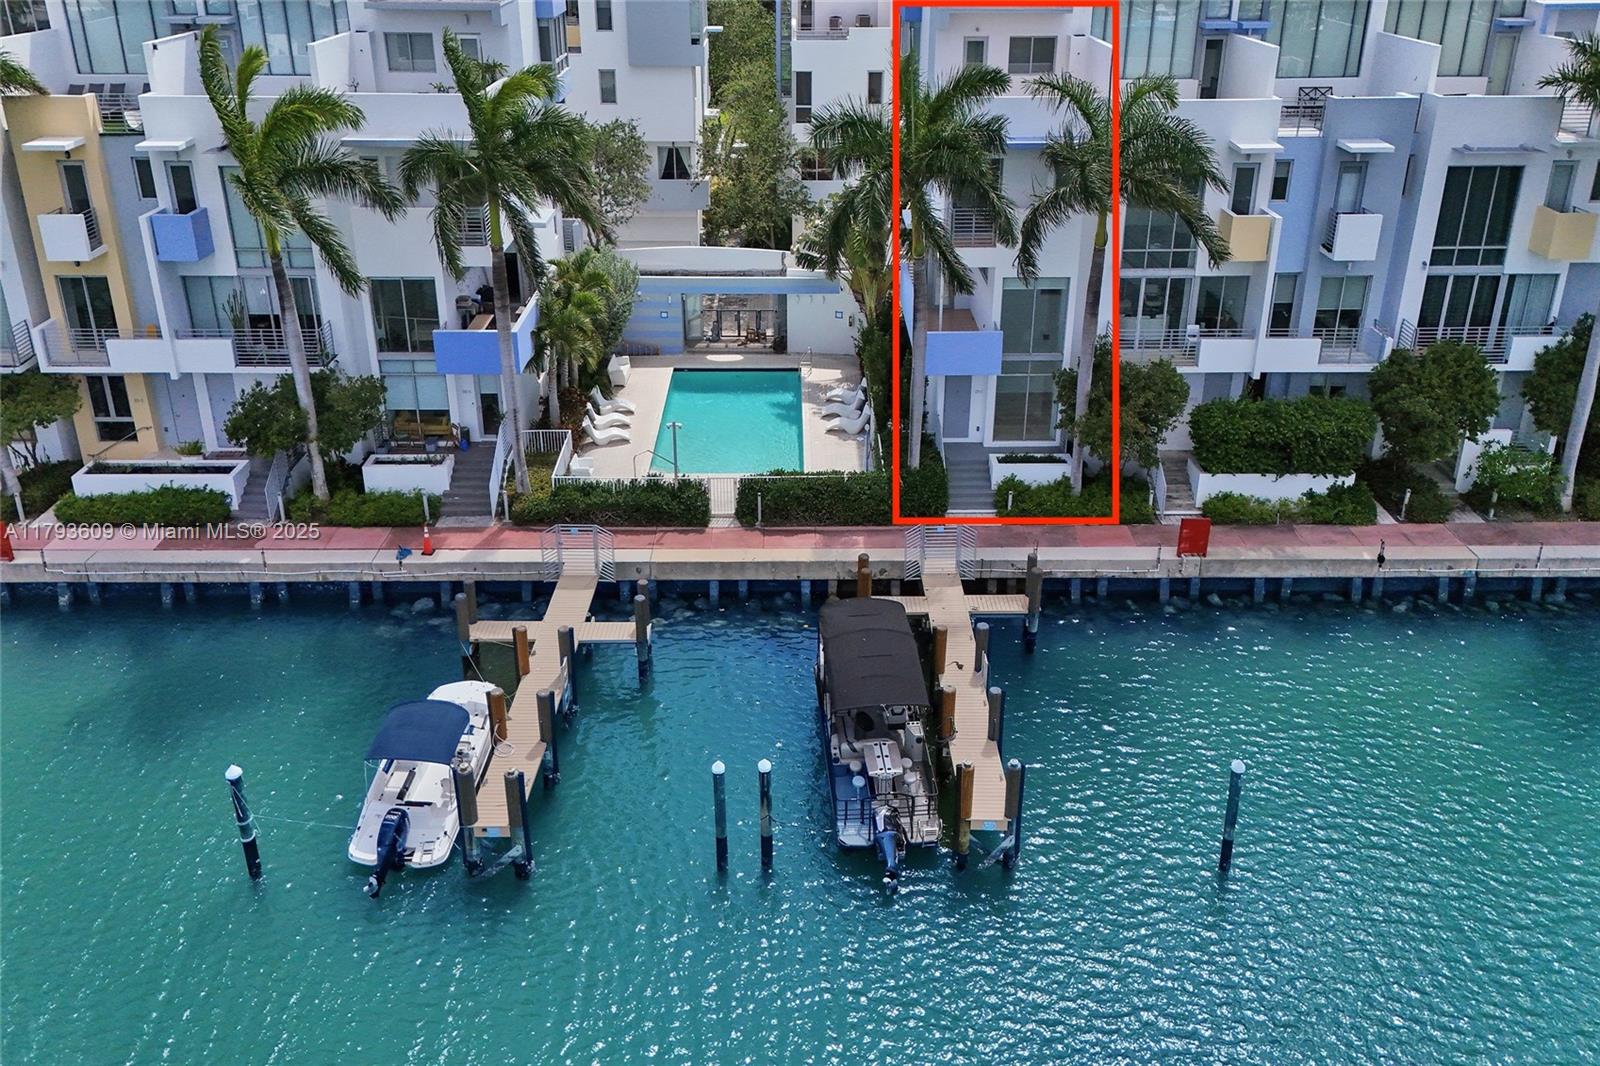
Active
$1,975,000
3
bds
|
4
ba
|
2,508
sqft
|
built
2020
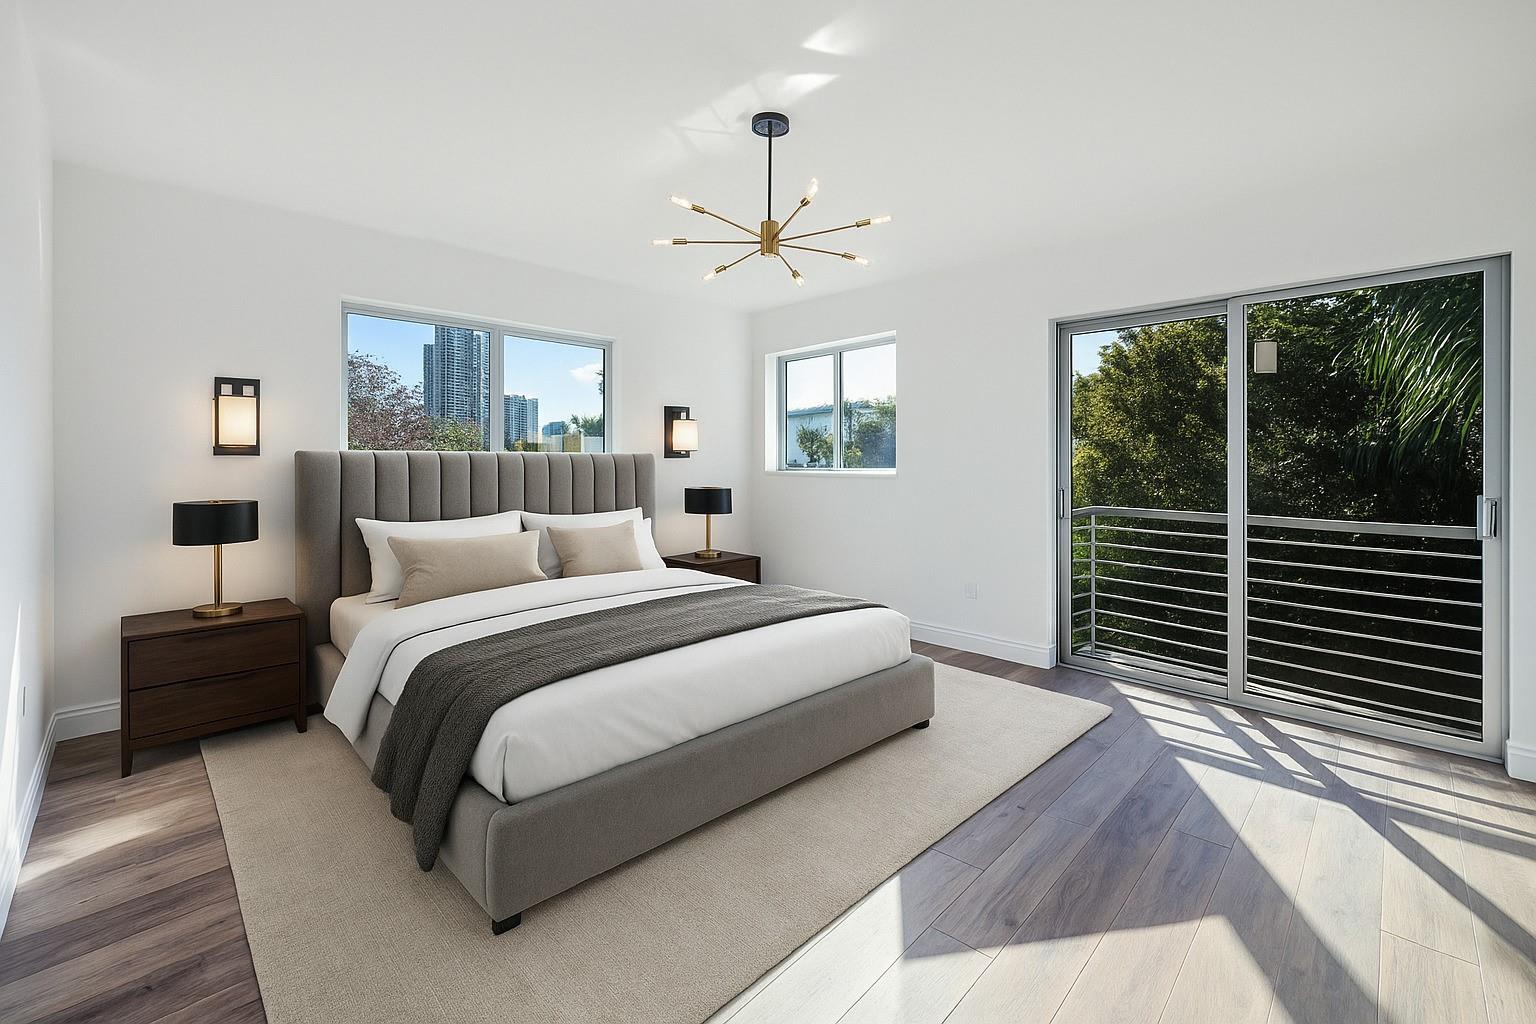
65 N Shore Dr, Miami Beach, FL 33141
$-6,030
Cash flow
-15.9%
Cash-on-Cash Return
2.6%
Cap rate
0.5%
Rent to Value Ratio
Active
$648,900
4
bds
|
3
ba
|
1,632
sqft
|
built
1956
7360 Gary Ave, Miami Beach, FL 33141
$-845
Cash flow
-6.8%
Cash-on-Cash Return
4.7%
Cap rate
0.7%
Rent to Value Ratio

Active
$1,699,000
3
bds
|
4
ba
|
1,597
sqft
|
built
2018
645 Michigan Ave, Miami Beach, FL 33139
$-6,238
Cash flow
-19.2%
Cash-on-Cash Return
1.9%
Cap rate
0.5%
Rent to Value Ratio
Active
$639,500
3
bds
|
2
ba
|
1,632
sqft
|
built
1956
7270 Gary Ave, Miami Beach, FL 33141
$-735
Cash flow
-6.0%
Cash-on-Cash Return
4.9%
Cap rate
0.8%
Rent to Value Ratio
Active
$749,999
2
bds
|
3
ba
|
1,270
sqft
|
built
1996
635 Euclid Ave, Miami Beach, FL 33139
$-2,115
Cash flow
-14.7%
Cash-on-Cash Return
2.9%
Cap rate
0.7%
Rent to Value Ratio
Active
$1,800,000
3
bds
|
4
ba
|
1,590
sqft
|
built
2002
361 Jefferson Ave, Miami Beach, FL 33139
$-7,862
Cash flow
-22.8%
Cash-on-Cash Return
1.0%
Cap rate
0.4%
Rent to Value Ratio
Active
$549,000
2
bds
|
3
ba
|
1,068
sqft
|
built
2005
8041 Harding Ave, Miami Beach, FL 33141
$-2,055
Cash flow
-19.5%
Cash-on-Cash Return
1.8%
Cap rate
0.6%
Rent to Value Ratio
Active
$2,849,000
5
bds
|
6
ba
|
3,741
sqft
|
built
2005
230 Water Way, Miami Beach, FL 33141
$-13,823
Cash flow
-25.3%
Cash-on-Cash Return
0.5%
Cap rate
0.3%
Rent to Value Ratio
Active
$3,650,000
3
bds
|
3
ba
|
2,240
sqft
|
built
2019
234 Washington Ave, Miami Beach, FL 33139
$-18,234
Cash flow
-26.1%
Cash-on-Cash Return
0.3%
Cap rate
0.3%
Rent to Value Ratio
Active
$1,945,000
2
bds
|
4
ba
|
1,864
sqft
|
built
2003
400 Alton Rd, Miami Beach, FL 33139
$-9,017
Cash flow
-24.2%
Cash-on-Cash Return
0.7%
Cap rate
0.4%
Rent to Value Ratio
Active
$96,500
bds
|
0
ba
|
112
sqft
|
built
1966
2899 Collins Ave, Miami Beach, FL 33140
$1,120
Cash flow
60.6%
Cash-on-Cash Return
20.2%
Cap rate
2.7%
Rent to Value Ratio