Miami Beach, FL Investment Properties for Sale
Browse homes for sale and investment properties in Miami Beach, FL. Refine your search by price, property type, or more.
Best cash flowing properties in Miami Beach, FL

Active
$265,000
1
bds
|
2
ba
|
785
sqft
|
built
1968
8024 Tatum Waterway Dr, Miami Beach, FL 33141
$-487
Cash flow
-9.6%
Cash-on-Cash Return
4.1%
Cap rate
0.9%
Rent to Value Ratio

Active
$248,500
1
bds
|
2
ba
|
780
sqft
|
built
1978
8250 Byron Ave, Miami Beach, FL 33141
$-674
Cash flow
-14.2%
Cash-on-Cash Return
3.0%
Cap rate
0.8%
Rent to Value Ratio
1,965 out of 2,167 properties for sale in Miami Beach, FL
Limited Results Shown
Create a free account, or log in to reveal all property listings and enjoy the complete experience.
Active
$1,050,000
2
bds
|
2
ba
|
1,130
sqft
|
built
1998
1800 Purdy Ave, Miami Beach, FL 33139
$-4,874
Cash flow
-24.2%
Cash-on-Cash Return
0.7%
Cap rate
0.5%
Rent to Value Ratio

Active
$850,000
2
bds
|
2
ba
|
1,262
sqft
|
built
2001
1330 West Ave, Miami Beach, FL 33139
$-4,036
Cash flow
-24.8%
Cash-on-Cash Return
0.6%
Cap rate
0.5%
Rent to Value Ratio
Active
$335,000
1
bds
|
1
ba
|
837
sqft
|
built
1965
1200 West Ave, Miami Beach, FL 33139
$-1,436
Cash flow
-22.4%
Cash-on-Cash Return
1.1%
Cap rate
0.8%
Rent to Value Ratio
Active
$289,000
1
bds
|
1
ba
|
540
sqft
|
built
1968
533 Meridian Ave, Miami Beach, FL 33139
$-1,142
Cash flow
-20.6%
Cash-on-Cash Return
1.5%
Cap rate
0.7%
Rent to Value Ratio

Active
$575,000
bds
|
1
ba
|
480
sqft
|
built
1925
918 Ocean Dr, Miami Beach, FL 33139
$-1,771
Cash flow
-16.1%
Cash-on-Cash Return
2.6%
Cap rate
0.5%
Rent to Value Ratio

Active
$425,000
1
bds
|
2
ba
|
1,019
sqft
|
built
1961
5055 Collins Ave, Miami Beach, FL 33140
$-1,798
Cash flow
-22.1%
Cash-on-Cash Return
1.2%
Cap rate
0.8%
Rent to Value Ratio
Active
$850,000
2
bds
|
2
ba
|
1,660
sqft
|
built
1961
5055 Collins Ave, Miami Beach, FL 33140
$-2,329
Cash flow
-14.3%
Cash-on-Cash Return
3.0%
Cap rate
0.8%
Rent to Value Ratio

Active
$650,000
1
bds
|
2
ba
|
0
sqft
|
built
1925
918 Ocean Dr, Miami Beach, FL 33139
$-2,417
Cash flow
-19.4%
Cash-on-Cash Return
1.8%
Cap rate
0.4%
Rent to Value Ratio
Active
$1,499,000
2
bds
|
2
ba
|
1,105
sqft
|
built
2011
2100 Park Ave, Miami Beach, FL 33139
$-6,902
Cash flow
-24.0%
Cash-on-Cash Return
0.8%
Cap rate
0.4%
Rent to Value Ratio
Active
$419,000
1
bds
|
2
ba
|
930
sqft
|
built
1971
1228 West Ave, Miami Beach, FL 33139
$-1,450
Cash flow
-18.1%
Cash-on-Cash Return
2.1%
Cap rate
0.7%
Rent to Value Ratio
Active
$497,500
2
bds
|
3
ba
|
1,170
sqft
|
built
1973
6900 Bay Dr, Miami Beach, FL 33141
$-2,299
Cash flow
-24.1%
Cash-on-Cash Return
0.7%
Cap rate
0.6%
Rent to Value Ratio
Active
$234,900
1
bds
|
1
ba
|
601
sqft
|
built
1936
1300 Pennsylvania Ave, Miami Beach, FL 33139
$-679
Cash flow
-15.1%
Cash-on-Cash Return
2.8%
Cap rate
0.9%
Rent to Value Ratio
Active
$265,000
1
bds
|
2
ba
|
785
sqft
|
built
1968
8024 Tatum Waterway Dr, Miami Beach, FL 33141
$-487
Cash flow
-9.6%
Cash-on-Cash Return
4.1%
Cap rate
0.9%
Rent to Value Ratio
Active
$2,790,000
3
bds
|
3
ba
|
2,599
sqft
|
built
1925
5832 Alton Rd, Miami Beach, FL 33140
$-8,212
Cash flow
-15.4%
Cash-on-Cash Return
2.8%
Cap rate
0.4%
Rent to Value Ratio
Active
$485,000
1
bds
|
1
ba
|
950
sqft
|
built
1966
800 West Ave, Miami Beach, FL 33139
$-1,397
Cash flow
-15.0%
Cash-on-Cash Return
2.8%
Cap rate
0.8%
Rent to Value Ratio
Active
$330,344
1
bds
|
1
ba
|
905
sqft
|
built
1970
401 69th St, Miami Beach, FL 33141
$-1,392
Cash flow
-22.0%
Cash-on-Cash Return
1.2%
Cap rate
0.7%
Rent to Value Ratio
Active
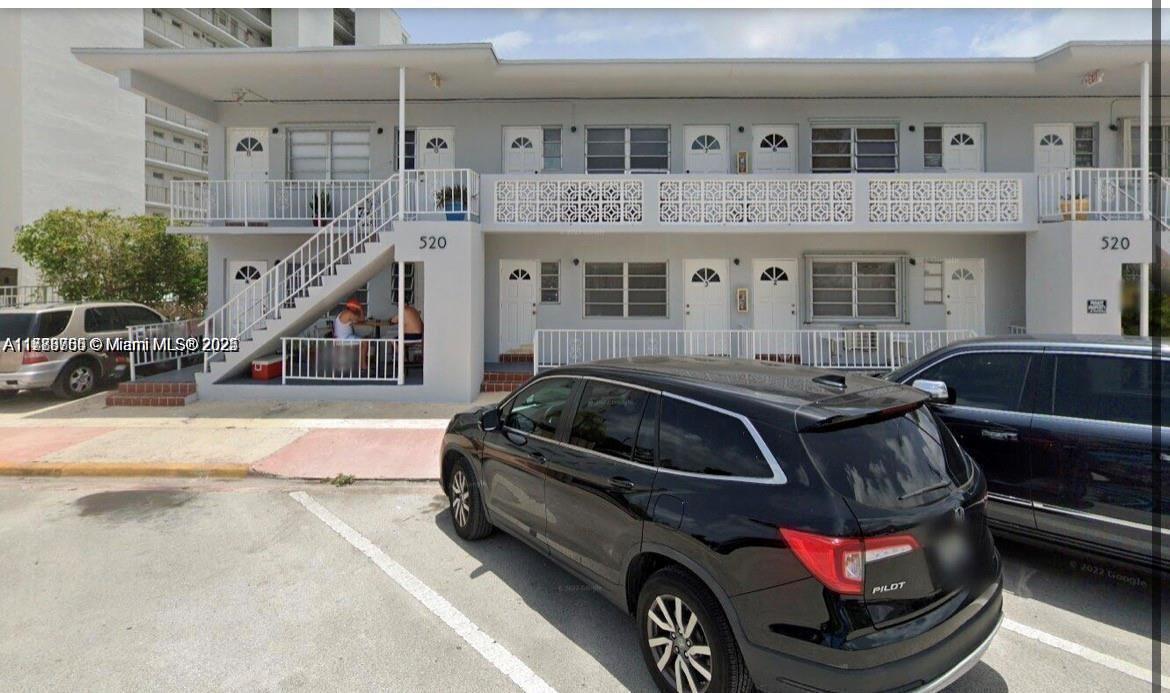
$295,000
1
bds
|
1
ba
|
635
sqft
|
built
1965
520 79th St, Miami Beach, FL 33141
$-1,053
Cash flow
-18.6%
Cash-on-Cash Return
2.0%
Cap rate
0.7%
Rent to Value Ratio
Active
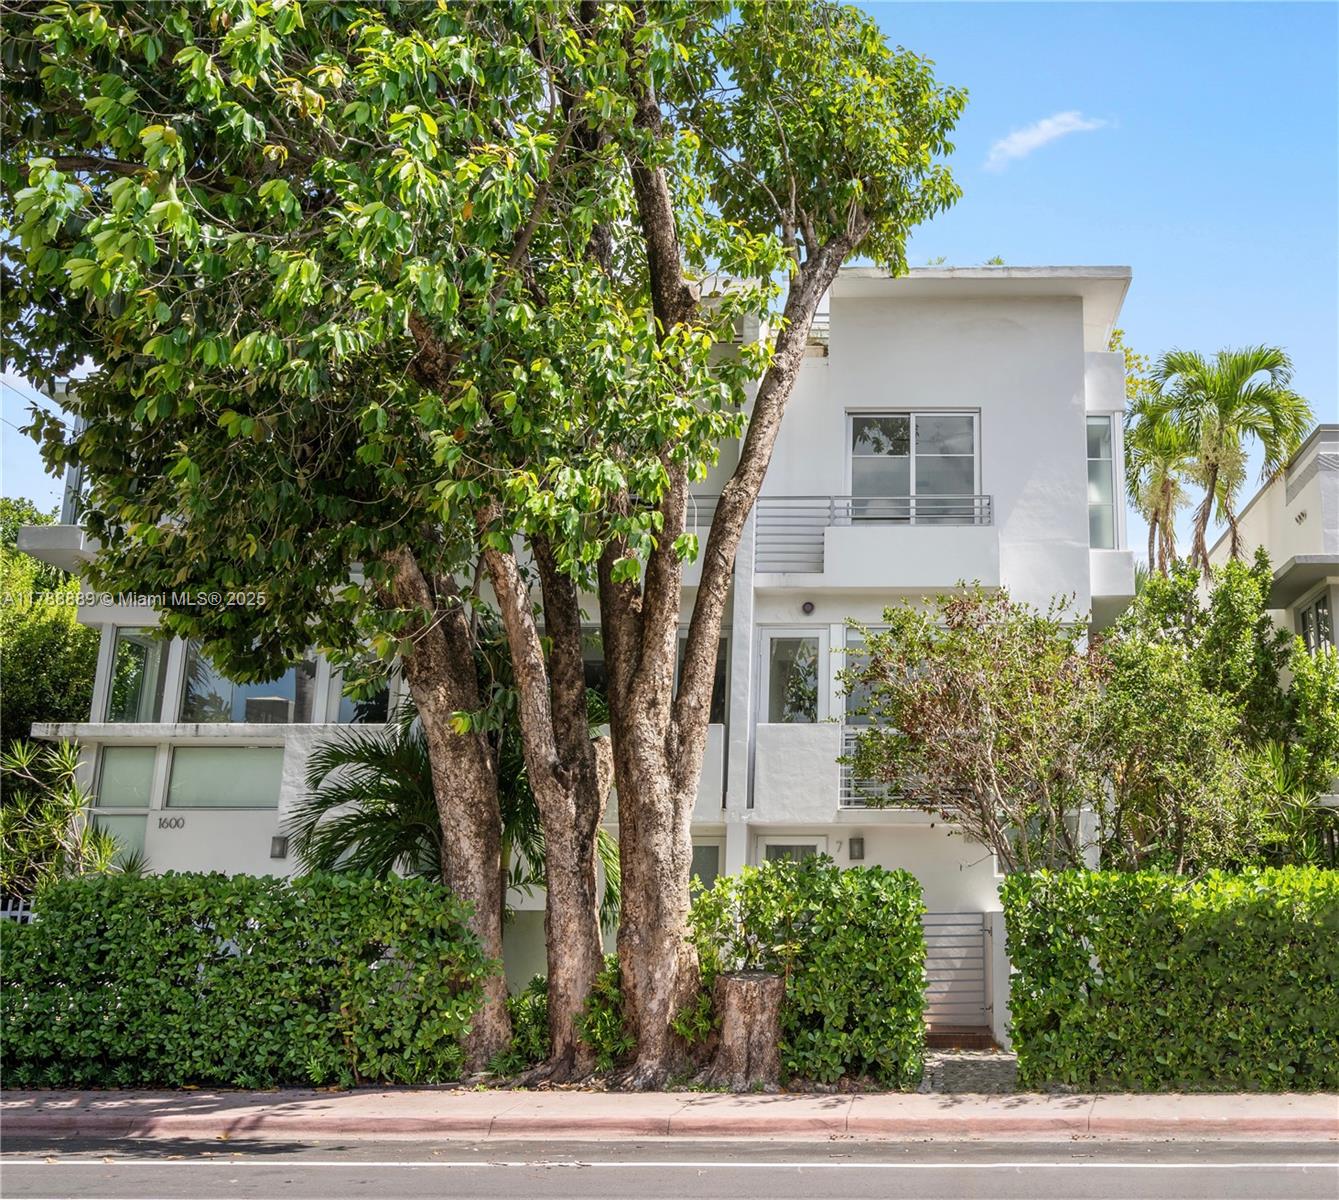
$1,485,000
2
bds
|
2
ba
|
1,128
sqft
|
built
2011
1600 Michigan Ave, Miami Beach, FL 33139
$-5,325
Cash flow
-18.7%
Cash-on-Cash Return
2.0%
Cap rate
0.4%
Rent to Value Ratio
Active
$469,000
2
bds
|
2
ba
|
820
sqft
|
built
1935
1410 Euclid Ave, Miami Beach, FL 33139
$-1,489
Cash flow
-16.6%
Cash-on-Cash Return
2.5%
Cap rate
0.7%
Rent to Value Ratio

Active
$2,300,000
2
bds
|
2
ba
|
1,536
sqft
|
built
2005
450 Alton Rd, Miami Beach, FL 33139
$-9,248
Cash flow
-21.0%
Cash-on-Cash Return
1.5%
Cap rate
0.5%
Rent to Value Ratio

Active
$3,477,000
5
bds
|
5
ba
|
2,190
sqft
|
built
1949
1020 6th St, Miami Beach, FL 33139
$-14,974
Cash flow
-22.5%
Cash-on-Cash Return
1.1%
Cap rate
0.3%
Rent to Value Ratio
Active
$799,000
2
bds
|
2
ba
|
1,014
sqft
|
built
2005
1700 Meridian Ave, Miami Beach, FL 33139
$-3,260
Cash flow
-21.3%
Cash-on-Cash Return
1.4%
Cap rate
0.6%
Rent to Value Ratio
Active
$1,040,000
2
bds
|
2
ba
|
1,234
sqft
|
built
2011
2155 Washington Ct, Miami Beach, FL 33139
$-4,033
Cash flow
-20.2%
Cash-on-Cash Return
1.6%
Cap rate
0.6%
Rent to Value Ratio
Active
$875,000
2
bds
|
3
ba
|
1,020
sqft
|
built
1923
760 Meridian Ave, Miami Beach, FL 33139
$-3,126
Cash flow
-18.6%
Cash-on-Cash Return
2.0%
Cap rate
0.5%
Rent to Value Ratio
Active
$219,000
bds
|
1
ba
|
300
sqft
|
built
1941
255 W 24th St, Miami Beach, FL 33140
$-820
Cash flow
-19.5%
Cash-on-Cash Return
1.8%
Cap rate
0.9%
Rent to Value Ratio

Active
$1,590,000
1
bds
|
2
ba
|
1,126
sqft
|
built
2008
5875 Collins Ave, Miami Beach, FL 33140
$-8,125
Cash flow
-26.7%
Cash-on-Cash Return
0.2%
Cap rate
0.4%
Rent to Value Ratio

Active
$365,000
1
bds
|
2
ba
|
920
sqft
|
built
1966
800 West Ave, Miami Beach, FL 33139
$-1,342
Cash flow
-19.2%
Cash-on-Cash Return
1.9%
Cap rate
0.9%
Rent to Value Ratio
Active
$1,250,000
1
bds
|
2
ba
|
1,090
sqft
|
built
1996
300 S Pointe Dr, Miami Beach, FL 33139
$-5,417
Cash flow
-22.6%
Cash-on-Cash Return
1.1%
Cap rate
0.5%
Rent to Value Ratio
Active
$248,500
1
bds
|
2
ba
|
780
sqft
|
built
1978
8250 Byron Ave, Miami Beach, FL 33141
$-674
Cash flow
-14.2%
Cash-on-Cash Return
3.0%
Cap rate
0.8%
Rent to Value Ratio
Active
$12,500,000
4
bds
|
5
ba
|
3,671
sqft
|
built
1959
1011 N Venetian Dr, Miami Beach, FL 33139
$-73,960
Cash flow
-30.9%
Cash-on-Cash Return
-0.8%
Cap rate
0.1%
Rent to Value Ratio
Active
$339,000
1
bds
|
1
ba
|
671
sqft
|
built
1968
1130 11th St, Miami Beach, FL 33139
$-1,015
Cash flow
-15.6%
Cash-on-Cash Return
2.7%
Cap rate
0.7%
Rent to Value Ratio
Active
$4,725,000
3
bds
|
4
ba
|
2,133
sqft
|
built
2019
6901 Collins Ave, Miami Beach, FL 33141
$-33,082
Cash flow
-36.5%
Cash-on-Cash Return
-2.1%
Cap rate
0.2%
Rent to Value Ratio
Active
$585,000
2
bds
|
2
ba
|
950
sqft
|
built
1998
5900 Collins Ave, Miami Beach, FL 33140
$-2,807
Cash flow
-25.0%
Cash-on-Cash Return
0.5%
Cap rate
0.6%
Rent to Value Ratio
Active
$895,000
1
bds
|
2
ba
|
1,283
sqft
|
built
1959
4925 Collins Ave, Miami Beach, FL 33140
$-4,304
Cash flow
-25.1%
Cash-on-Cash Return
0.5%
Cap rate
0.5%
Rent to Value Ratio

Active
$585,000
1
bds
|
2
ba
|
692
sqft
|
built
2008
2020 Prairie Ave, Miami Beach, FL 33139
$-1,363
Cash flow
-12.2%
Cash-on-Cash Return
3.5%
Cap rate
0.5%
Rent to Value Ratio

Active
$895,000
2
bds
|
2
ba
|
1,070
sqft
|
built
1995
1688 West Ave, Miami Beach, FL 33139
$-4,013
Cash flow
-23.4%
Cash-on-Cash Return
0.9%
Cap rate
0.4%
Rent to Value Ratio
Active
$289,000
bds
|
1
ba
|
515
sqft
|
built
1949
1340 Drexel Ave, Miami Beach, FL 33139
$-922
Cash flow
-16.6%
Cash-on-Cash Return
2.5%
Cap rate
0.7%
Rent to Value Ratio
Active
$310,000
1
bds
|
1
ba
|
934
sqft
|
built
1970
401 69th St, Miami Beach, FL 33141
$-1,297
Cash flow
-21.8%
Cash-on-Cash Return
1.3%
Cap rate
0.8%
Rent to Value Ratio
Active
$795,000
1
bds
|
1
ba
|
740
sqft
|
built
1999
90 Alton Rd, Miami Beach, FL 33139
$-3,124
Cash flow
-20.5%
Cash-on-Cash Return
1.6%
Cap rate
0.5%
Rent to Value Ratio

Active
$490,000
bds
|
1
ba
|
550
sqft
|
built
1965
100 Lincoln Rd, Miami Beach, FL 33139
$-2,172
Cash flow
-23.1%
Cash-on-Cash Return
1.0%
Cap rate
0.6%
Rent to Value Ratio