Miami Beach, FL Investment Properties for Sale
Browse homes for sale and investment properties in Miami Beach, FL. Refine your search by price, property type, or more.
Best cash flowing properties in Miami Beach, FL
Active
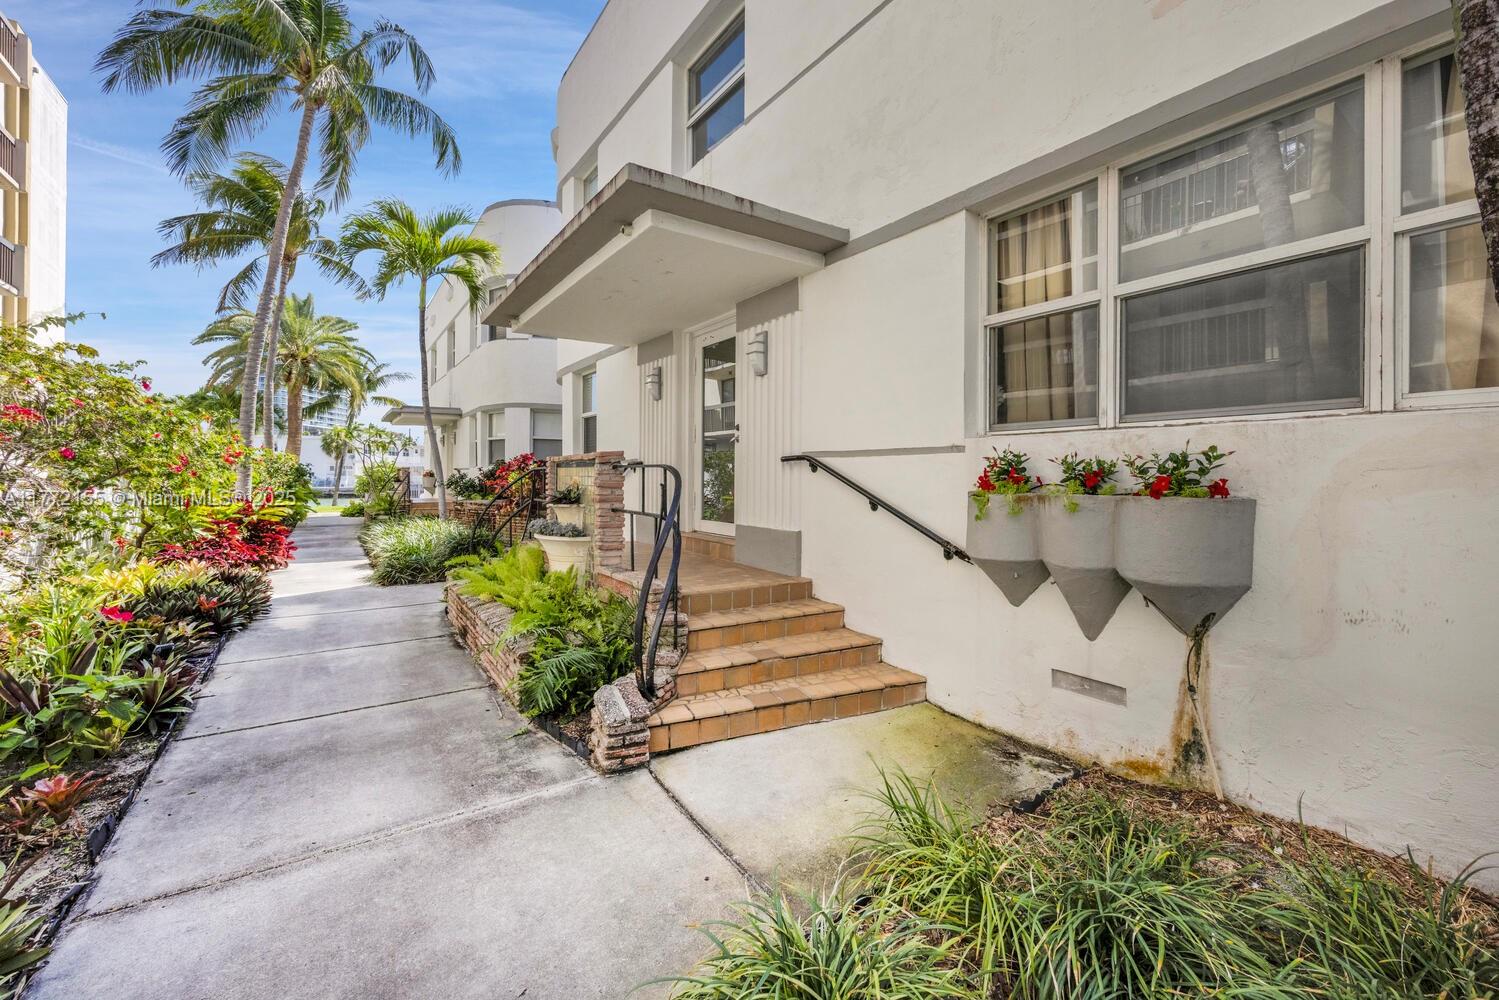
$225,000
1
bds
|
1
ba
|
422
sqft
|
built
2016
1035 Euclid Ave, Miami Beach, FL 33139
$-411
Cash flow
-9.5%
Cash-on-Cash Return
4.0%
Cap rate
0.9%
Rent to Value Ratio
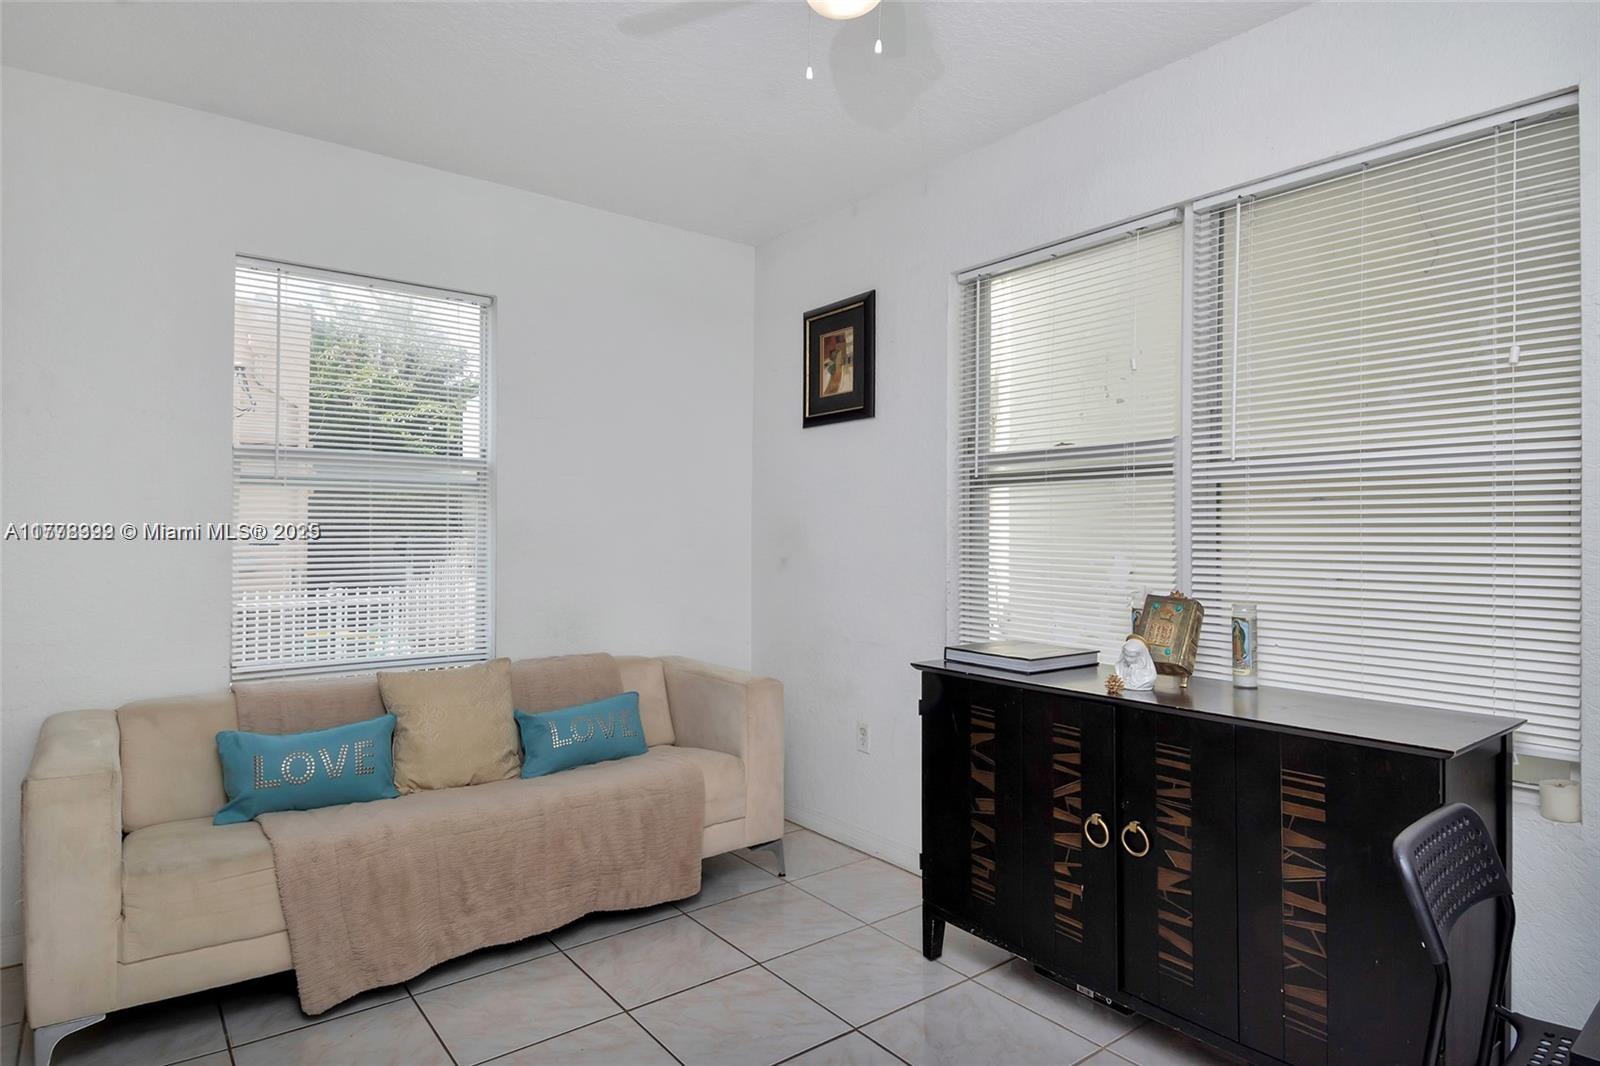
Active
$239,000
bds
|
1
ba
|
497
sqft
|
built
1945
1000 Meridian Ave, Miami Beach, FL 33139
$-480
Cash flow
-10.5%
Cash-on-Cash Return
3.7%
Cap rate
0.8%
Rent to Value Ratio
1,965 out of 2,167 properties for sale in Miami Beach, FL
Limited Results Shown
Create a free account, or log in to reveal all property listings and enjoy the complete experience.
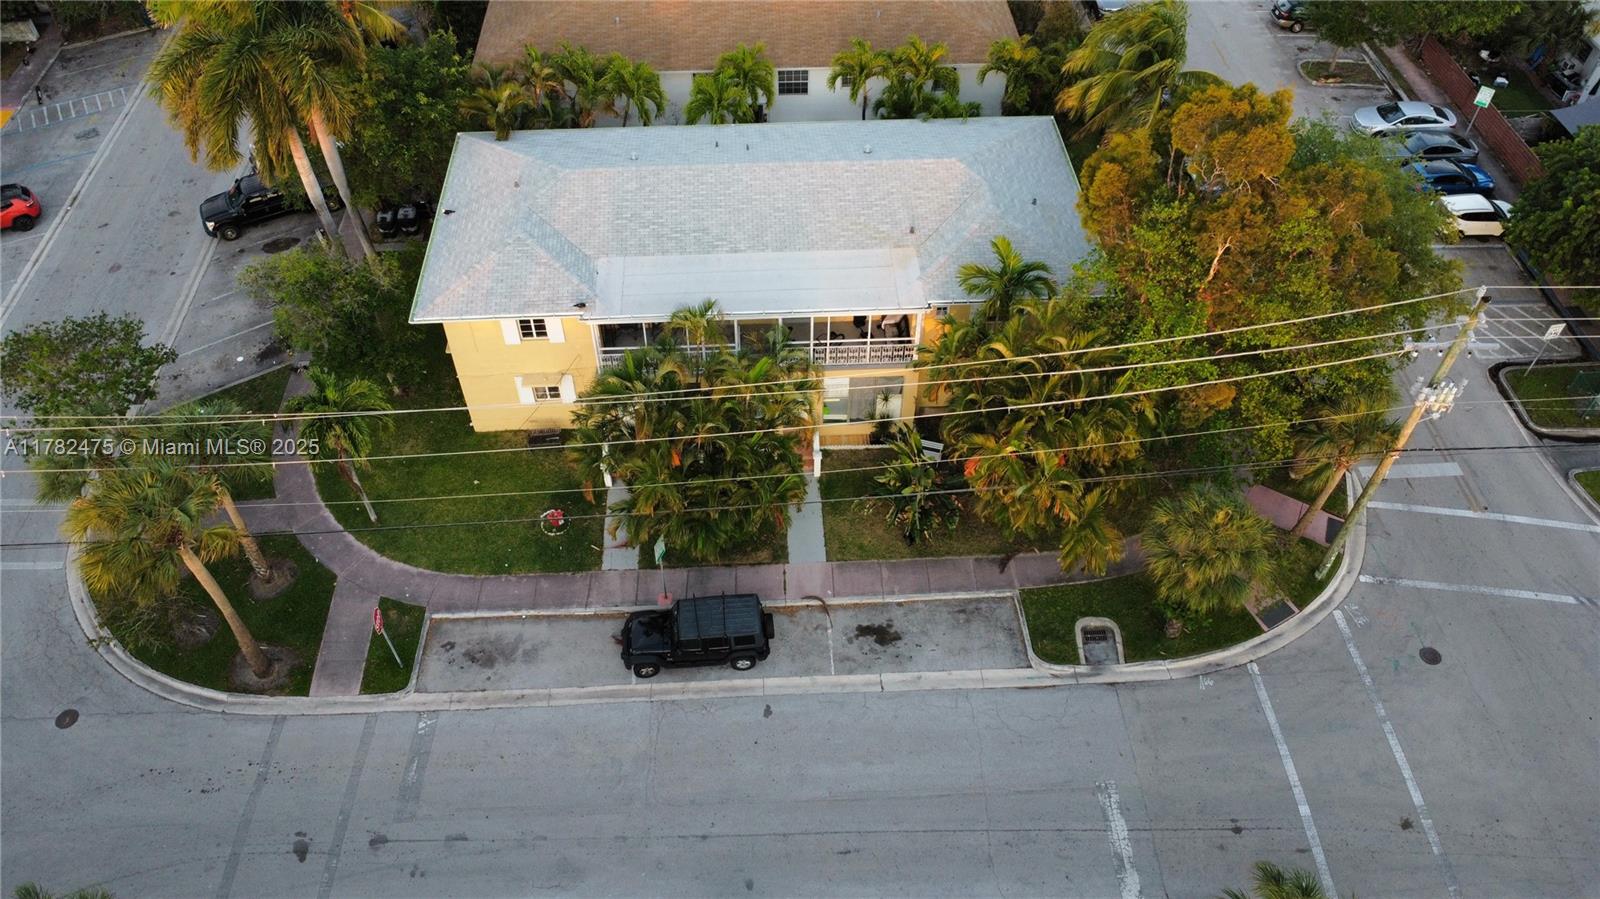
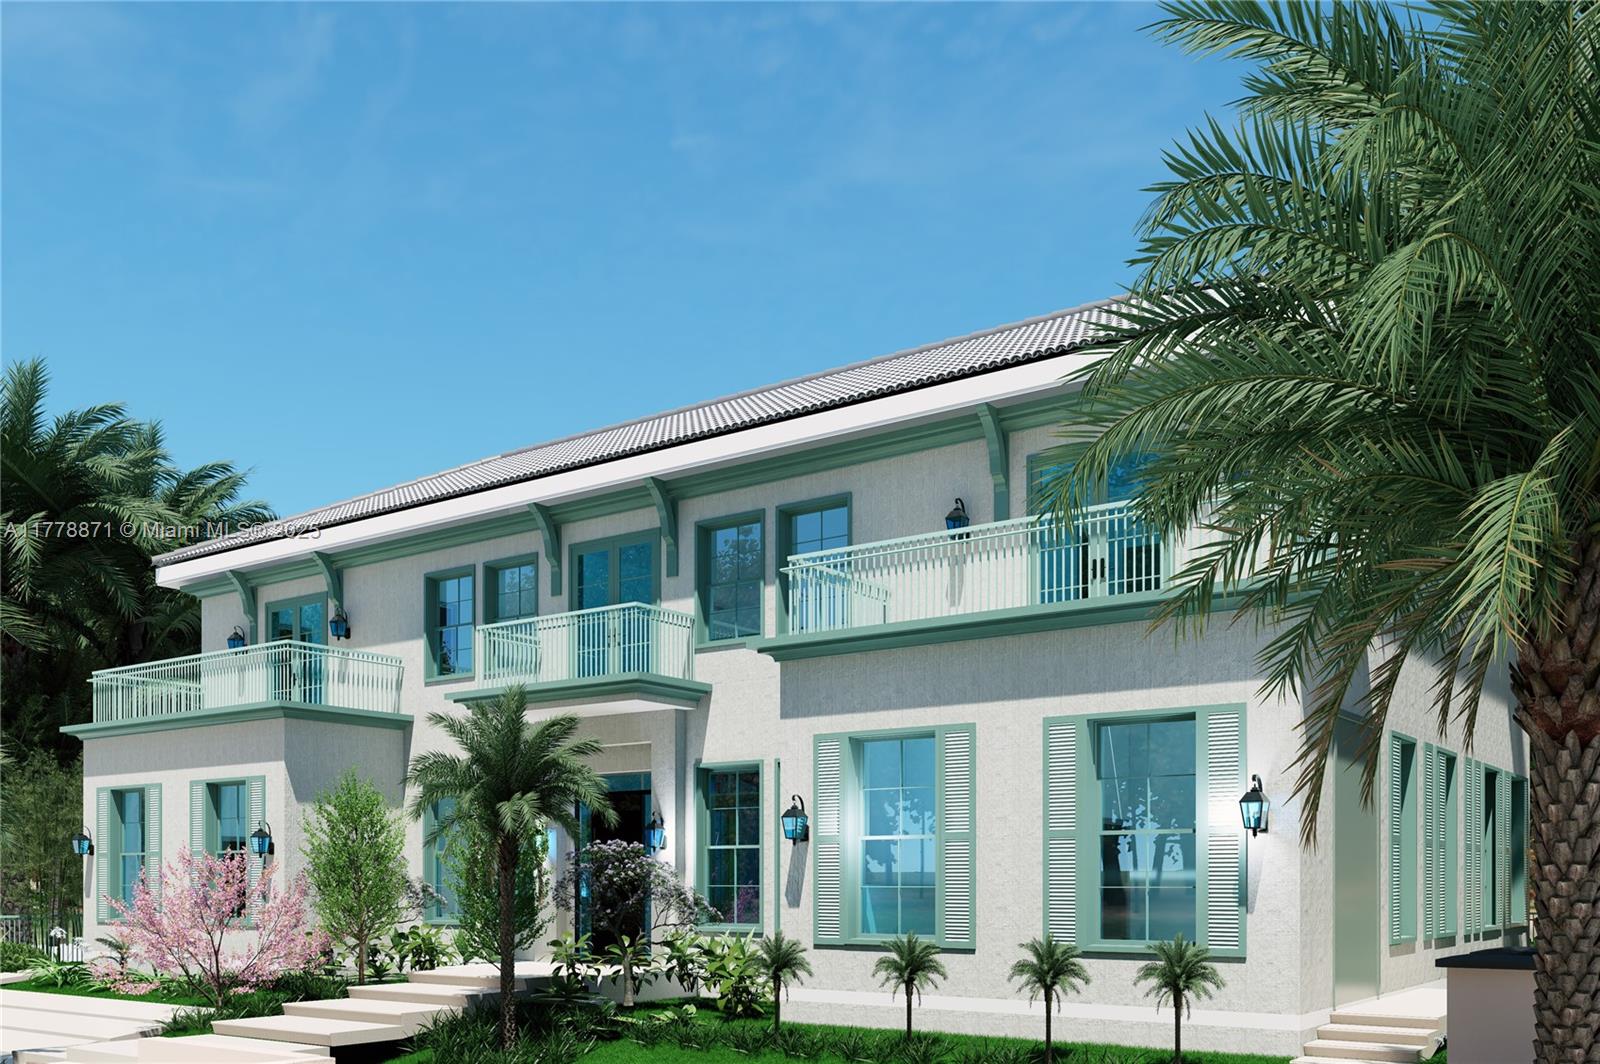
Active
$1,650,000
4
bds
|
0
ba
|
2,315
sqft
|
built
1949
820 86th St, Miami Beach, FL 33141
$-6,593
Cash flow
-20.8%
Cash-on-Cash Return
1.4%
Cap rate
0.2%
Rent to Value Ratio
Active
$3,100,000
3
bds
|
3
ba
|
2,090
sqft
|
built
2005
2001 Meridian Ave, Miami Beach, FL 33139
$-12,790
Cash flow
-21.5%
Cash-on-Cash Return
1.2%
Cap rate
0.4%
Rent to Value Ratio
Active
$2,900,000
3
bds
|
3
ba
|
3,357
sqft
|
built
1928
4515 N Bay Rd, Miami Beach, FL 33140
$-10,038
Cash flow
-18.1%
Cash-on-Cash Return
2.0%
Cap rate
0.3%
Rent to Value Ratio
Active
$1,190,000
2
bds
|
2
ba
|
1,280
sqft
|
built
1998
1 Century Ln, Miami Beach, FL 33139
$-3,684
Cash flow
-16.2%
Cash-on-Cash Return
2.4%
Cap rate
0.5%
Rent to Value Ratio
Active
$1,095,000
3
bds
|
3
ba
|
1,723
sqft
|
built
1982
5845 Collins Ave, Miami Beach, FL 33140
$-4,312
Cash flow
-20.5%
Cash-on-Cash Return
1.4%
Cap rate
0.5%
Rent to Value Ratio
Active
$340,000
1
bds
|
2
ba
|
864
sqft
|
built
1967
8233 Harding Ave, Miami Beach, FL 33141
$-1,225
Cash flow
-18.8%
Cash-on-Cash Return
1.8%
Cap rate
0.7%
Rent to Value Ratio
Active
$295,000
1
bds
|
1
ba
|
443
sqft
|
built
1940
7326 Collins Ave, Miami Beach, FL 33141
$-933
Cash flow
-16.5%
Cash-on-Cash Return
2.4%
Cap rate
0.7%
Rent to Value Ratio
Active
$1,540,000
2
bds
|
2
ba
|
1,322
sqft
|
built
2004
6365 Collins Ave, Miami Beach, FL 33141
$-6,726
Cash flow
-22.8%
Cash-on-Cash Return
0.9%
Cap rate
0.4%
Rent to Value Ratio
Active
$4,750,000
4
bds
|
5
ba
|
3,725
sqft
|
built
1936
2550 Flamingo Dr, Miami Beach, FL 33140
$-21,836
Cash flow
-24.0%
Cash-on-Cash Return
0.6%
Cap rate
0.2%
Rent to Value Ratio
Active
$7,000,000
4
bds
|
3
ba
|
2,863
sqft
|
built
1953
1820 Daytonia Rd, Miami Beach, FL 33141
$-31,363
Cash flow
-23.4%
Cash-on-Cash Return
0.8%
Cap rate
0.1%
Rent to Value Ratio
Active
$299,000
1
bds
|
1
ba
|
622
sqft
|
built
2016
1035 Euclid Ave, Miami Beach, FL 33139
$-904
Cash flow
-15.8%
Cash-on-Cash Return
2.5%
Cap rate
0.7%
Rent to Value Ratio
Active
$1,575,000
8
bds
|
0
ba
|
4,439
sqft
|
built
1944
1797 Marseille Dr, Miami Beach, FL 33141
$-6,610
Cash flow
-21.9%
Cash-on-Cash Return
1.1%
Cap rate
0.2%
Rent to Value Ratio
Active
$2,099,000
2
bds
|
2
ba
|
1,380
sqft
|
built
2000
4779 Collins Ave, Miami Beach, FL 33140
$-9,448
Cash flow
-23.5%
Cash-on-Cash Return
0.7%
Cap rate
0.3%
Rent to Value Ratio
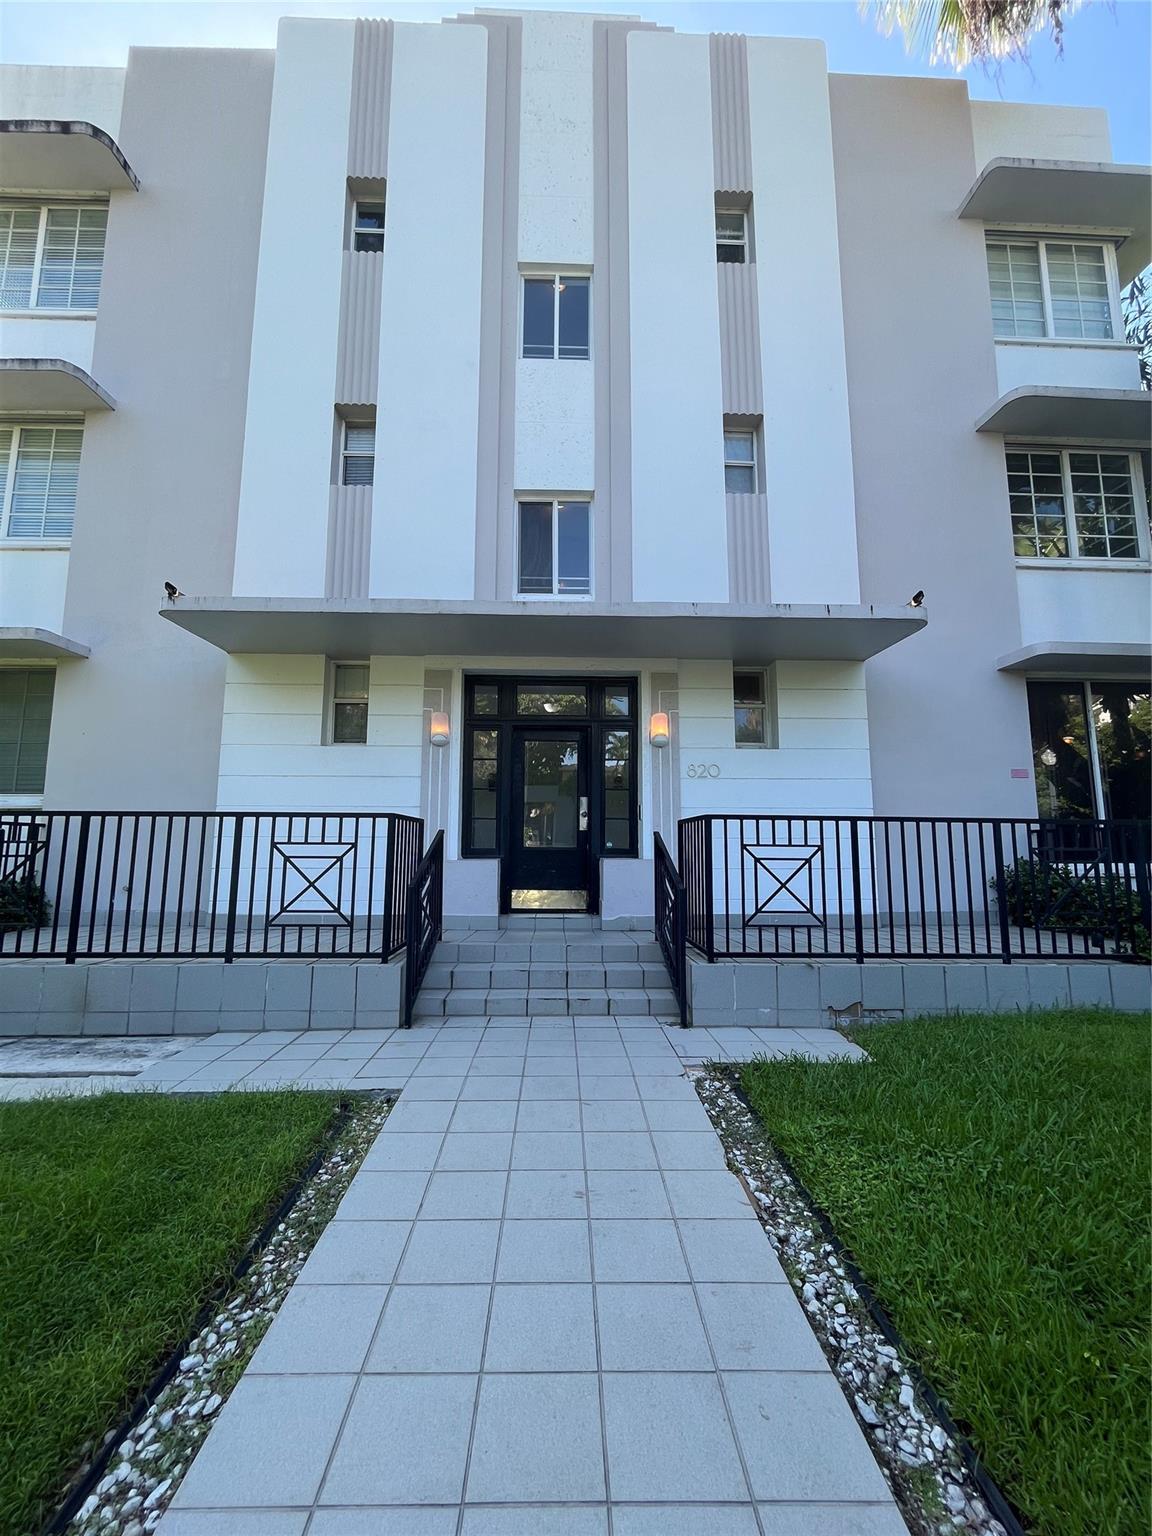
Active
$210,000
bds
|
1
ba
|
431
sqft
|
built
1939
820 Euclid Ave, Miami Beach, FL 33139
$-671
Cash flow
-16.7%
Cash-on-Cash Return
2.3%
Cap rate
0.9%
Rent to Value Ratio

Active
$230,000
1
bds
|
1
ba
|
448
sqft
|
built
2016
740 Meridian Ave, Miami Beach, FL 33139
$-549
Cash flow
-12.5%
Cash-on-Cash Return
3.3%
Cap rate
0.9%
Rent to Value Ratio
Active
$319,000
1
bds
|
2
ba
|
970
sqft
|
built
1973
6900 Bay Dr, Miami Beach, FL 33141
$-495
Cash flow
-8.1%
Cash-on-Cash Return
4.3%
Cap rate
0.8%
Rent to Value Ratio
Active
$785,000
1
bds
|
2
ba
|
1,283
sqft
|
built
1959
4925 Collins Ave, Miami Beach, FL 33140
$-3,672
Cash flow
-24.4%
Cash-on-Cash Return
0.5%
Cap rate
0.5%
Rent to Value Ratio
Active
$470,000
1
bds
|
2
ba
|
910
sqft
|
built
1968
6770 Indian Creek Dr, Miami Beach, FL 33141
$-1,641
Cash flow
-18.2%
Cash-on-Cash Return
2.0%
Cap rate
0.7%
Rent to Value Ratio
Active
$495,000
1
bds
|
2
ba
|
860
sqft
|
built
1971
1228 West Ave, Miami Beach, FL 33139
$-848
Cash flow
-8.9%
Cash-on-Cash Return
4.1%
Cap rate
0.8%
Rent to Value Ratio

Active
$2,650,000
3
bds
|
4
ba
|
2,342
sqft
|
built
1946
4271 Alton Rd, Miami Beach, FL 33140
$-9,788
Cash flow
-19.3%
Cash-on-Cash Return
1.7%
Cap rate
0.4%
Rent to Value Ratio
Active
$750,000
1
bds
|
2
ba
|
930
sqft
|
built
1998
1 Century Ln, Miami Beach, FL 33139
$-1,616
Cash flow
-11.2%
Cash-on-Cash Return
3.6%
Cap rate
0.7%
Rent to Value Ratio

Active
$365,000
1
bds
|
1
ba
|
650
sqft
|
built
1938
1605 Michigan Ave, Miami Beach, FL 33139
$-1,516
Cash flow
-21.7%
Cash-on-Cash Return
1.2%
Cap rate
0.7%
Rent to Value Ratio
Active
$310,000
1
bds
|
2
ba
|
676
sqft
|
built
1971
6969 Collins Ave, Miami Beach, FL 33141
$-915
Cash flow
-15.4%
Cash-on-Cash Return
2.6%
Cap rate
0.8%
Rent to Value Ratio
Active
$225,000
1
bds
|
1
ba
|
422
sqft
|
built
2016
1035 Euclid Ave, Miami Beach, FL 33139
$-411
Cash flow
-9.5%
Cash-on-Cash Return
4.0%
Cap rate
0.9%
Rent to Value Ratio

Active
$829,000
2
bds
|
2
ba
|
1,020
sqft
|
built
2000
227 Michigan Ave, Miami Beach, FL 33139
$-2,838
Cash flow
-17.9%
Cash-on-Cash Return
2.0%
Cap rate
0.6%
Rent to Value Ratio
Active
$239,000
bds
|
1
ba
|
497
sqft
|
built
1945
1000 Meridian Ave, Miami Beach, FL 33139
$-480
Cash flow
-10.5%
Cash-on-Cash Return
3.7%
Cap rate
0.8%
Rent to Value Ratio
Active
$1,175,000
2
bds
|
2
ba
|
1,524
sqft
|
built
1982
6061 Collins Ave, Miami Beach, FL 33140
$-4,146
Cash flow
-18.4%
Cash-on-Cash Return
1.9%
Cap rate
0.5%
Rent to Value Ratio
Active
$695,000
1
bds
|
2
ba
|
1,027
sqft
|
built
1960
1500 Bay Rd, Miami Beach, FL 33139
$-901
Cash flow
-6.8%
Cash-on-Cash Return
4.6%
Cap rate
0.7%
Rent to Value Ratio
Active
$299,900
1
bds
|
1
ba
|
591
sqft
|
built
1932
6911 Bay Dr, Miami Beach, FL 33141
$-810
Cash flow
-14.1%
Cash-on-Cash Return
2.9%
Cap rate
0.7%
Rent to Value Ratio
Active
$5,450,000
6
bds
|
7
ba
|
4,998
sqft
|
built
1937
6371 N Bay Rd, Miami Beach, FL 33141
$-28,175
Cash flow
-27.0%
Cash-on-Cash Return
-0.1%
Cap rate
0.1%
Rent to Value Ratio
Active
$299,900
1
bds
|
1
ba
|
438
sqft
|
built
1940
7326 Collins Ave, Miami Beach, FL 33141
$-879
Cash flow
-15.3%
Cash-on-Cash Return
2.6%
Cap rate
0.7%
Rent to Value Ratio
Active
$305,000
1
bds
|
1
ba
|
488
sqft
|
built
1940
7326 Collins Ave, Miami Beach, FL 33141
$-985
Cash flow
-16.8%
Cash-on-Cash Return
2.3%
Cap rate
0.7%
Rent to Value Ratio
Active
$550,000
1
bds
|
2
ba
|
858
sqft
|
built
1970
1658 Bay Rd, Miami Beach, FL 33139
$-1,746
Cash flow
-16.6%
Cash-on-Cash Return
2.3%
Cap rate
0.6%
Rent to Value Ratio
Active
$19,500,000
6
bds
|
7
ba
|
5,292
sqft
|
built
1950
247 E Rivo Alto Dr, Miami Beach, FL 33139
$-115,904
Cash flow
-31.0%
Cash-on-Cash Return
-1.0%
Cap rate
0.0%
Rent to Value Ratio
Active
$450,000
2
bds
|
2
ba
|
1,101
sqft
|
built
1986
7125 Bay Dr, Miami Beach, FL 33141
$-1,461
Cash flow
-16.9%
Cash-on-Cash Return
2.3%
Cap rate
0.6%
Rent to Value Ratio

Active
$1,450,000
2
bds
|
2
ba
|
1,258
sqft
|
built
1997
650 West Ave, Miami Beach, FL 33139
$-5,943
Cash flow
-21.4%
Cash-on-Cash Return
1.2%
Cap rate
0.5%
Rent to Value Ratio
Active
$1,475,000
bds
|
1
ba
|
699
sqft
|
built
2008
50 S Pointe Dr, Miami Beach, FL 33139
$-5,671
Cash flow
-20.1%
Cash-on-Cash Return
1.5%
Cap rate
0.4%
Rent to Value Ratio
Active
$319,000
1
bds
|
1
ba
|
496
sqft
|
built
1952
1840 James Ave, Miami Beach, FL 33139
$-857
Cash flow
-14.0%
Cash-on-Cash Return
2.9%
Cap rate
0.7%
Rent to Value Ratio
Active
$314,000
1
bds
|
1
ba
|
726
sqft
|
built
1966
2899 Collins Ave, Miami Beach, FL 33140
$-1,159
Cash flow
-19.3%
Cash-on-Cash Return
1.7%
Cap rate
0.6%
Rent to Value Ratio

Active
$850,000
2
bds
|
2
ba
|
1,078
sqft
|
built
1997
650 West Ave, Miami Beach, FL 33139
$-2,267
Cash flow
-13.9%
Cash-on-Cash Return
2.9%
Cap rate
0.7%
Rent to Value Ratio