Miami Beach, FL Investment Properties for Sale
Browse homes for sale and investment properties in Miami Beach, FL. Refine your search by price, property type, or more.
Best cash flowing properties in Miami Beach, FL
Active
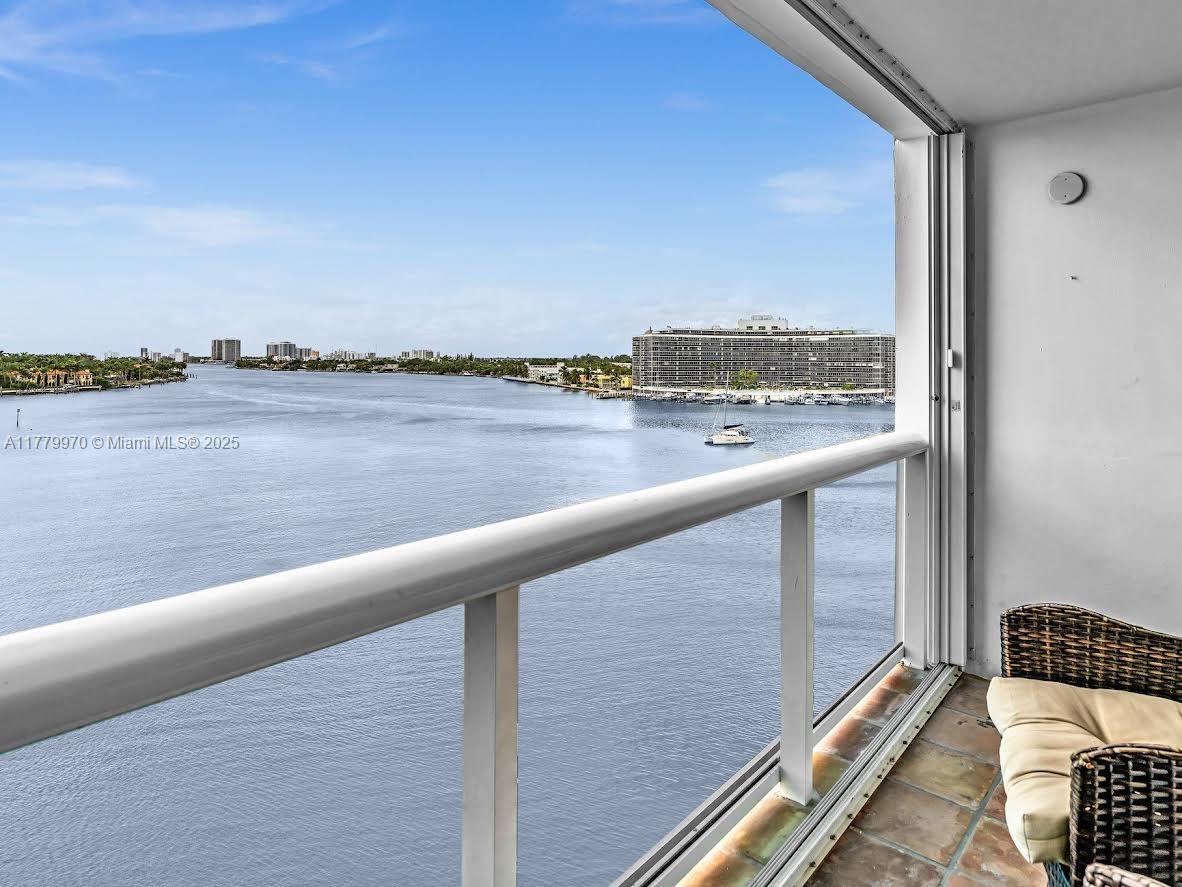
$135,000
bds
|
1
ba
|
112
sqft
|
built
1966
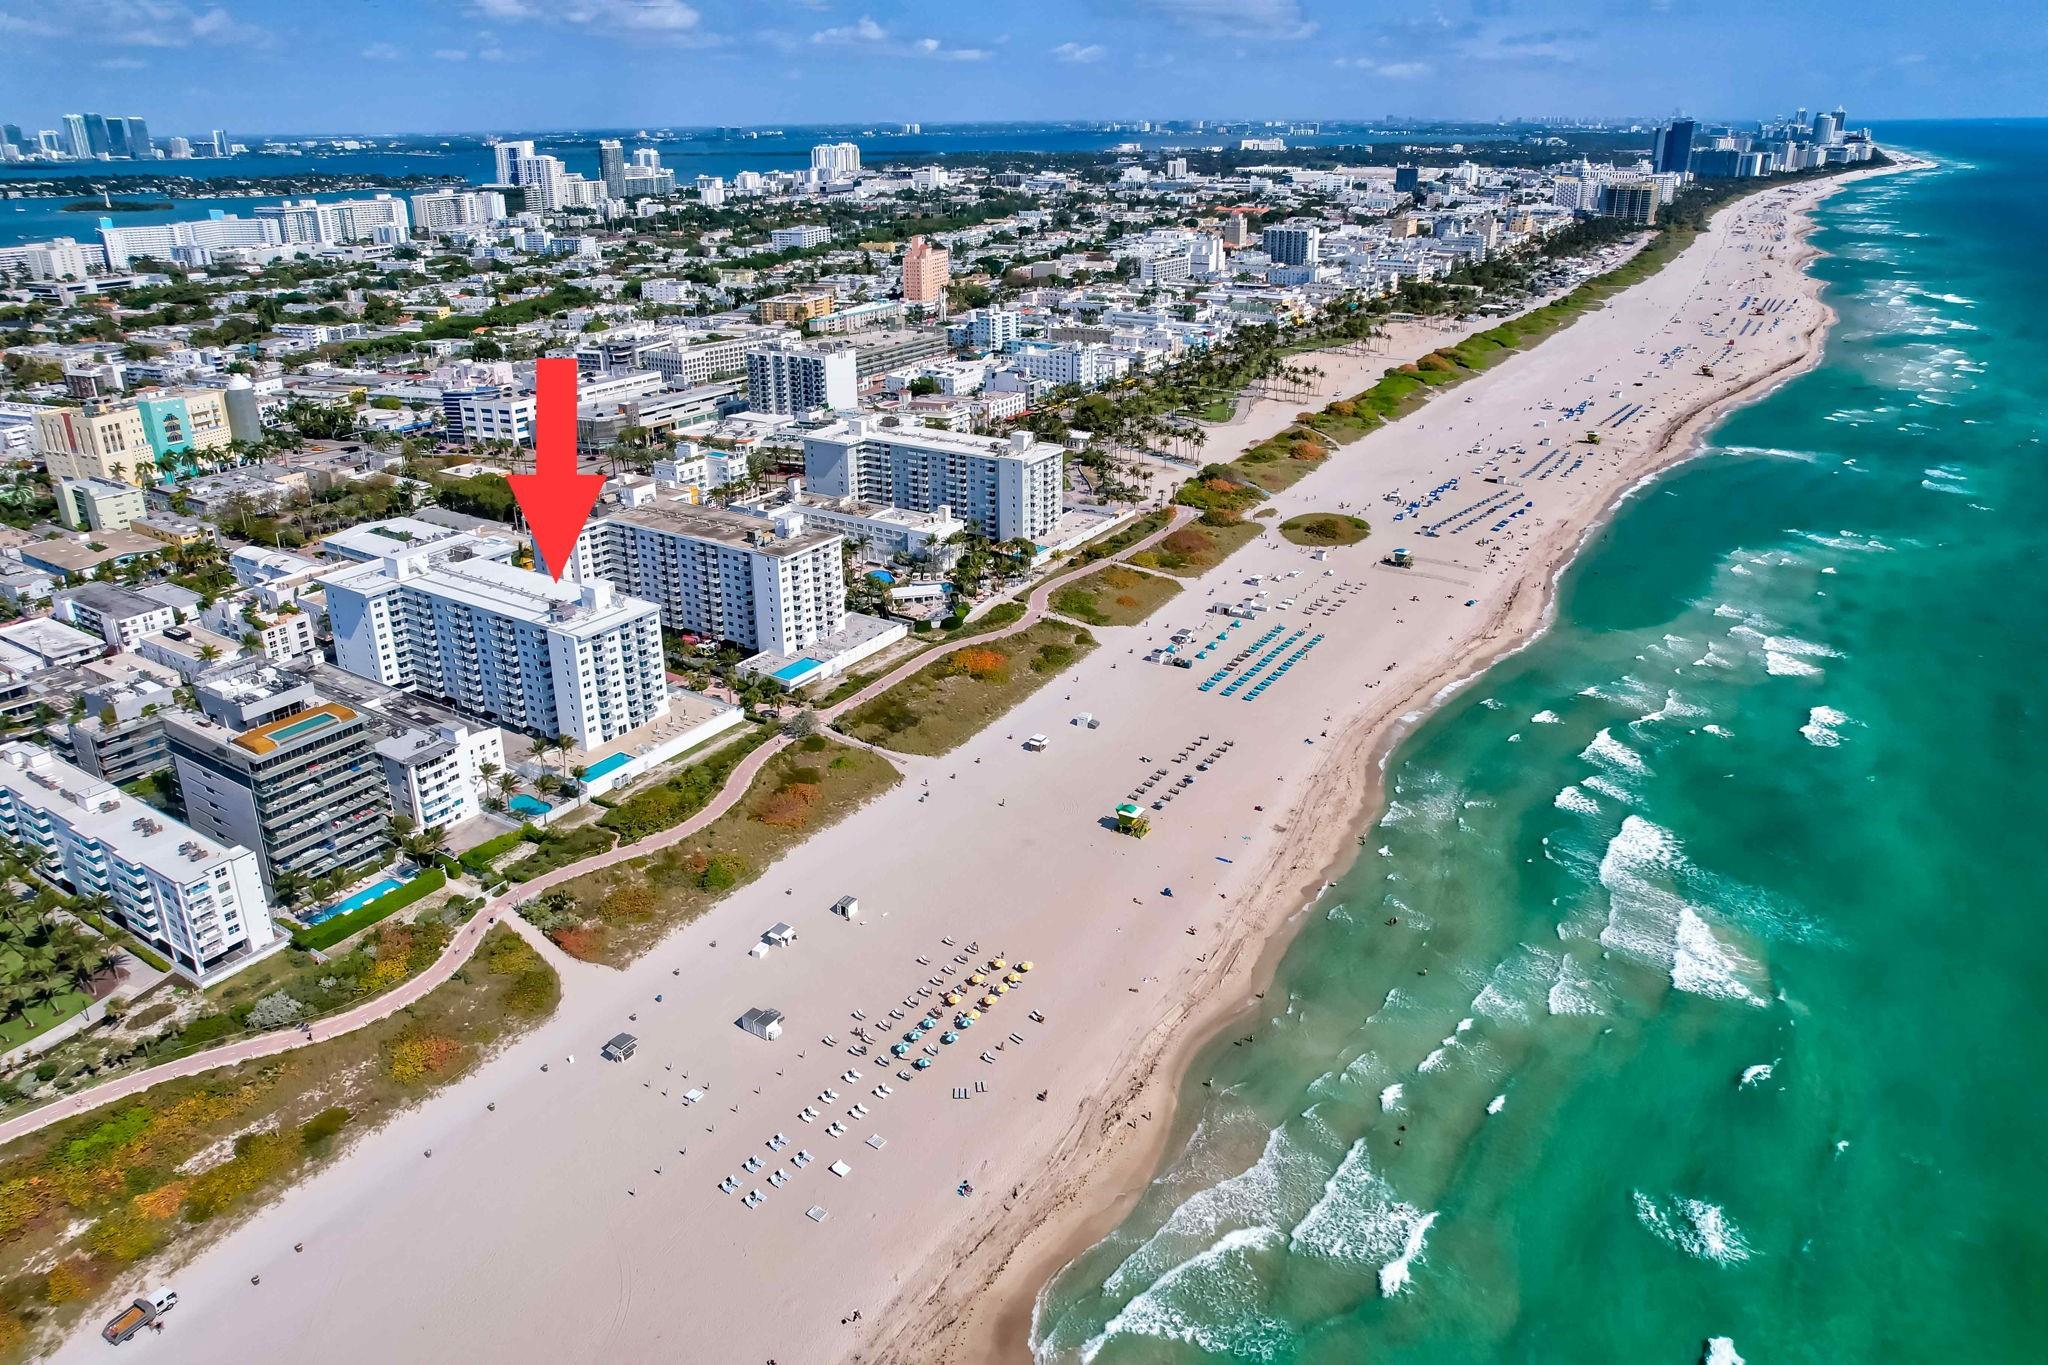
2899 Collins Ave, Miami Beach, FL 33140
$597
Cash flow
23.1%
Cash-on-Cash Return
11.5%
Cap rate
1.6%
Rent to Value Ratio
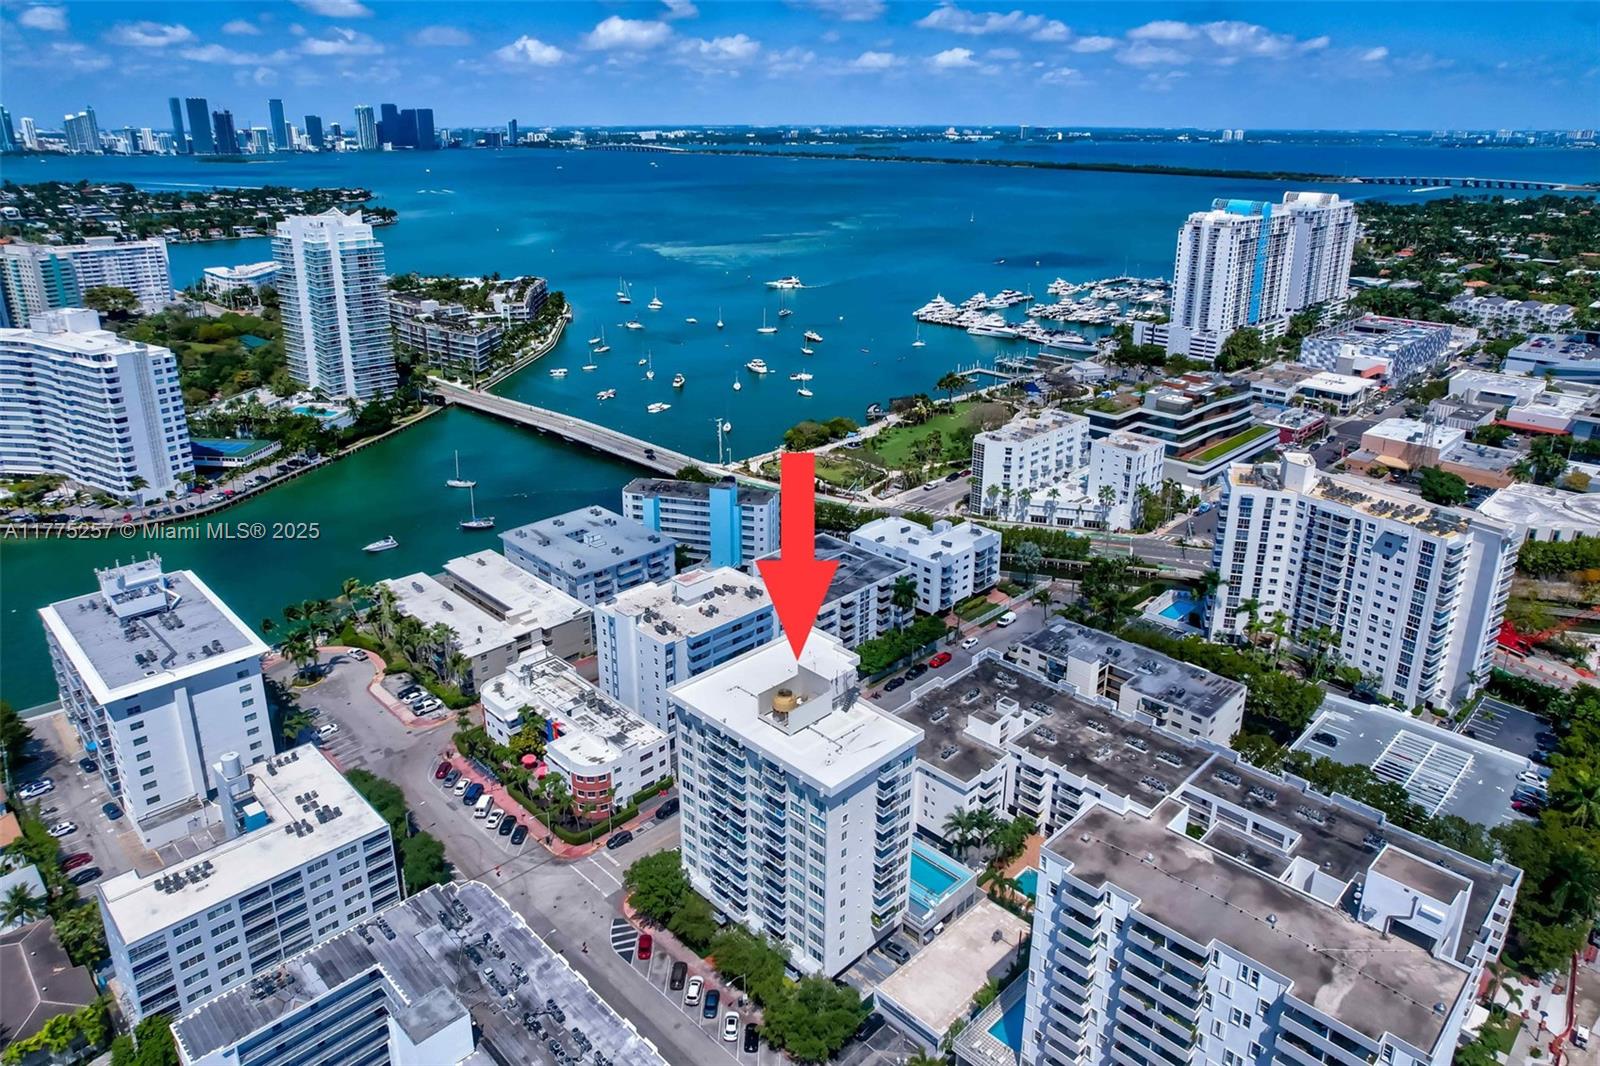
Active
$330,000
bds
|
1
ba
|
566
sqft
|
built
1966
2899 Collins Ave, Miami Beach, FL 33140
$-355
Cash flow
-5.6%
Cash-on-Cash Return
4.9%
Cap rate
0.8%
Rent to Value Ratio
1,965 out of 2,167 properties for sale in Miami Beach, FL
Limited Results Shown
Create a free account, or log in to reveal all property listings and enjoy the complete experience.
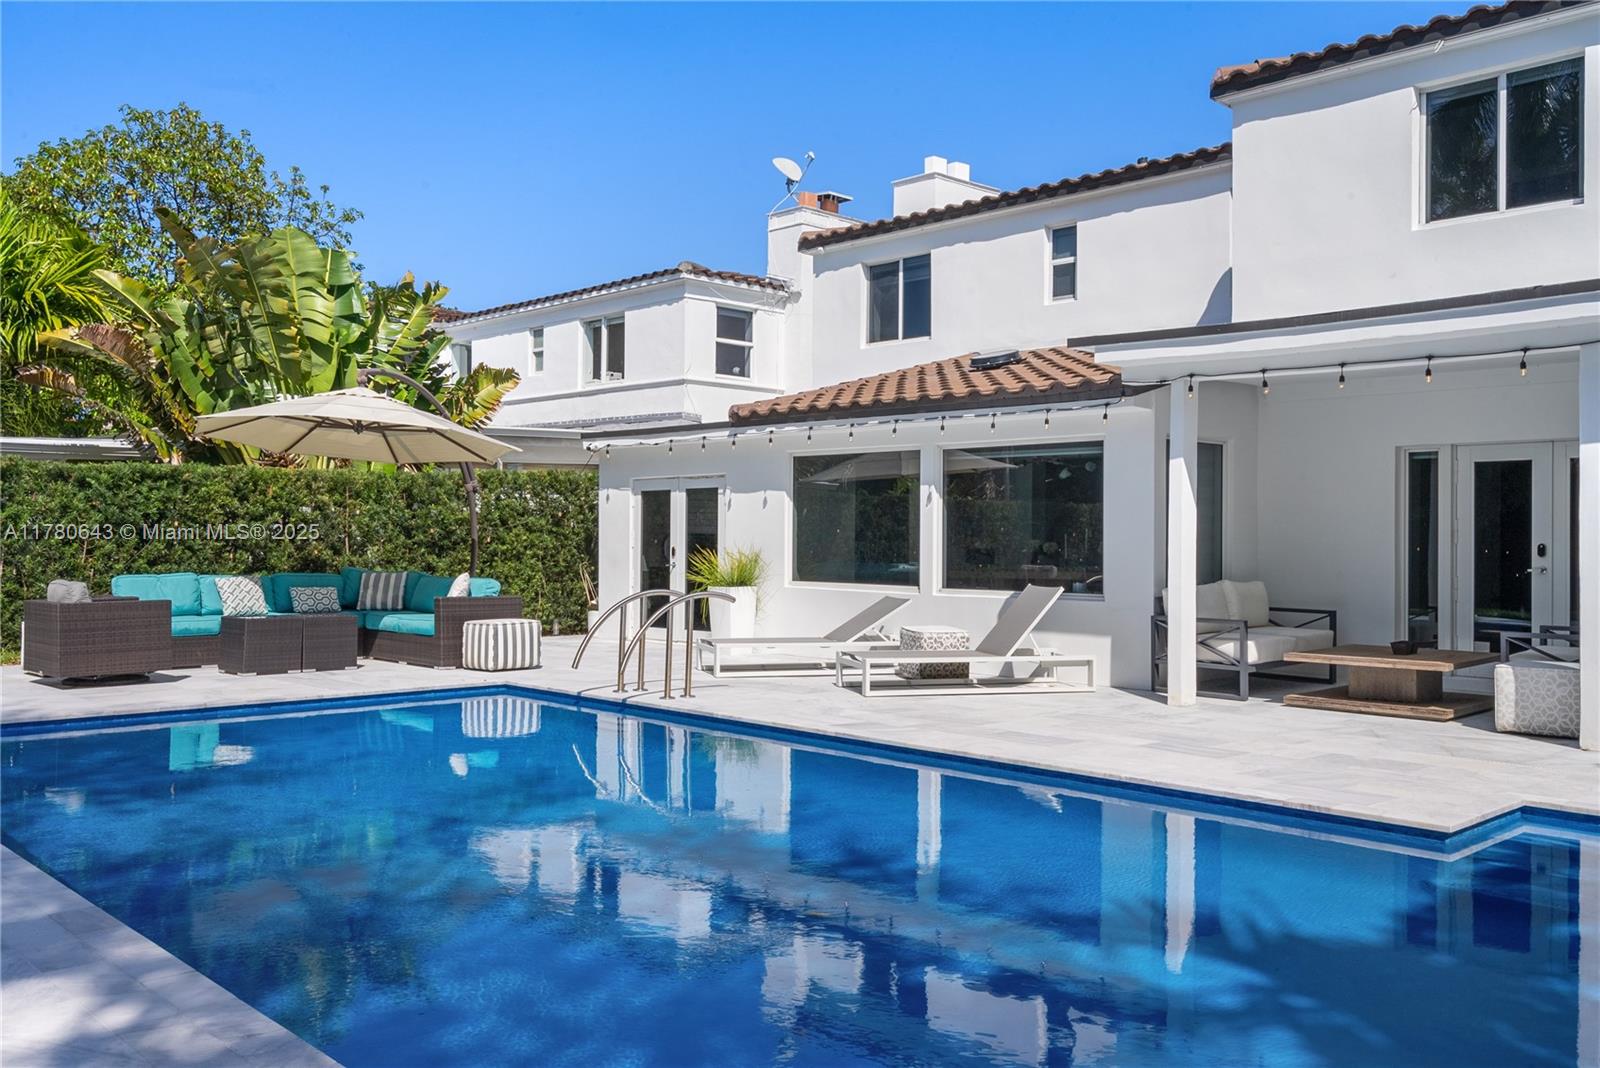
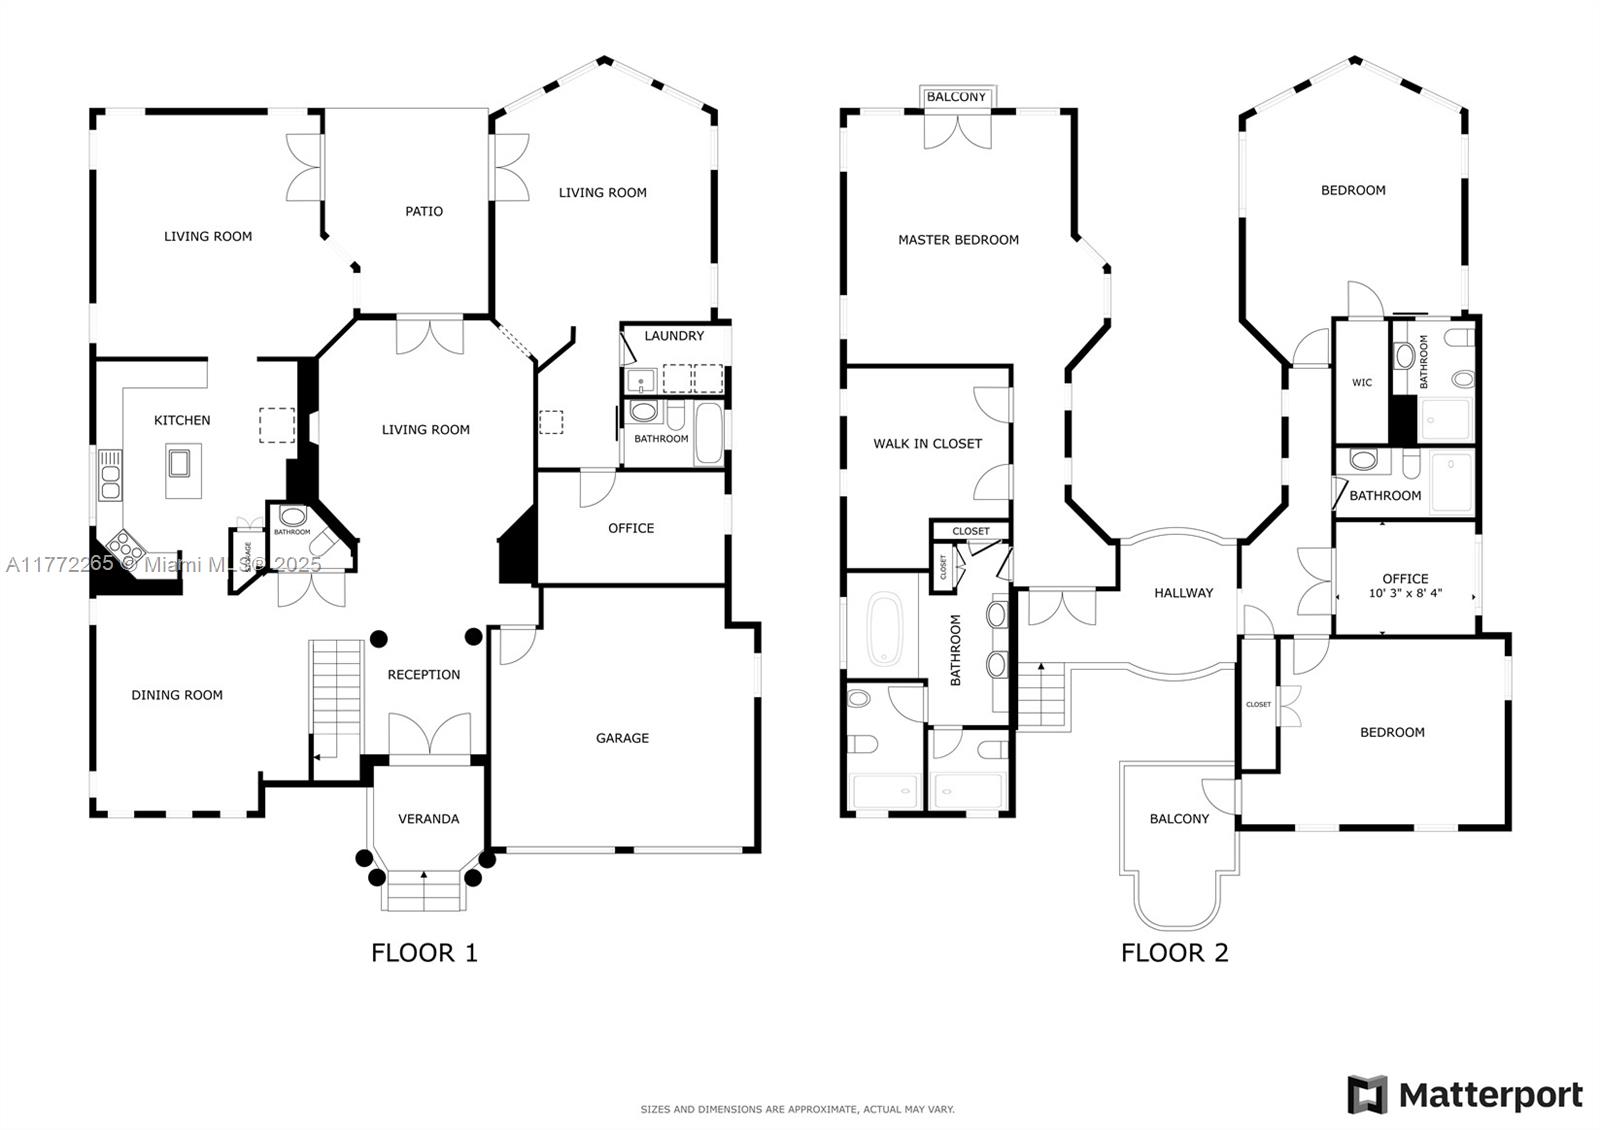
Active
$2,800,000
4
bds
|
5
ba
|
2,982
sqft
|
built
1937
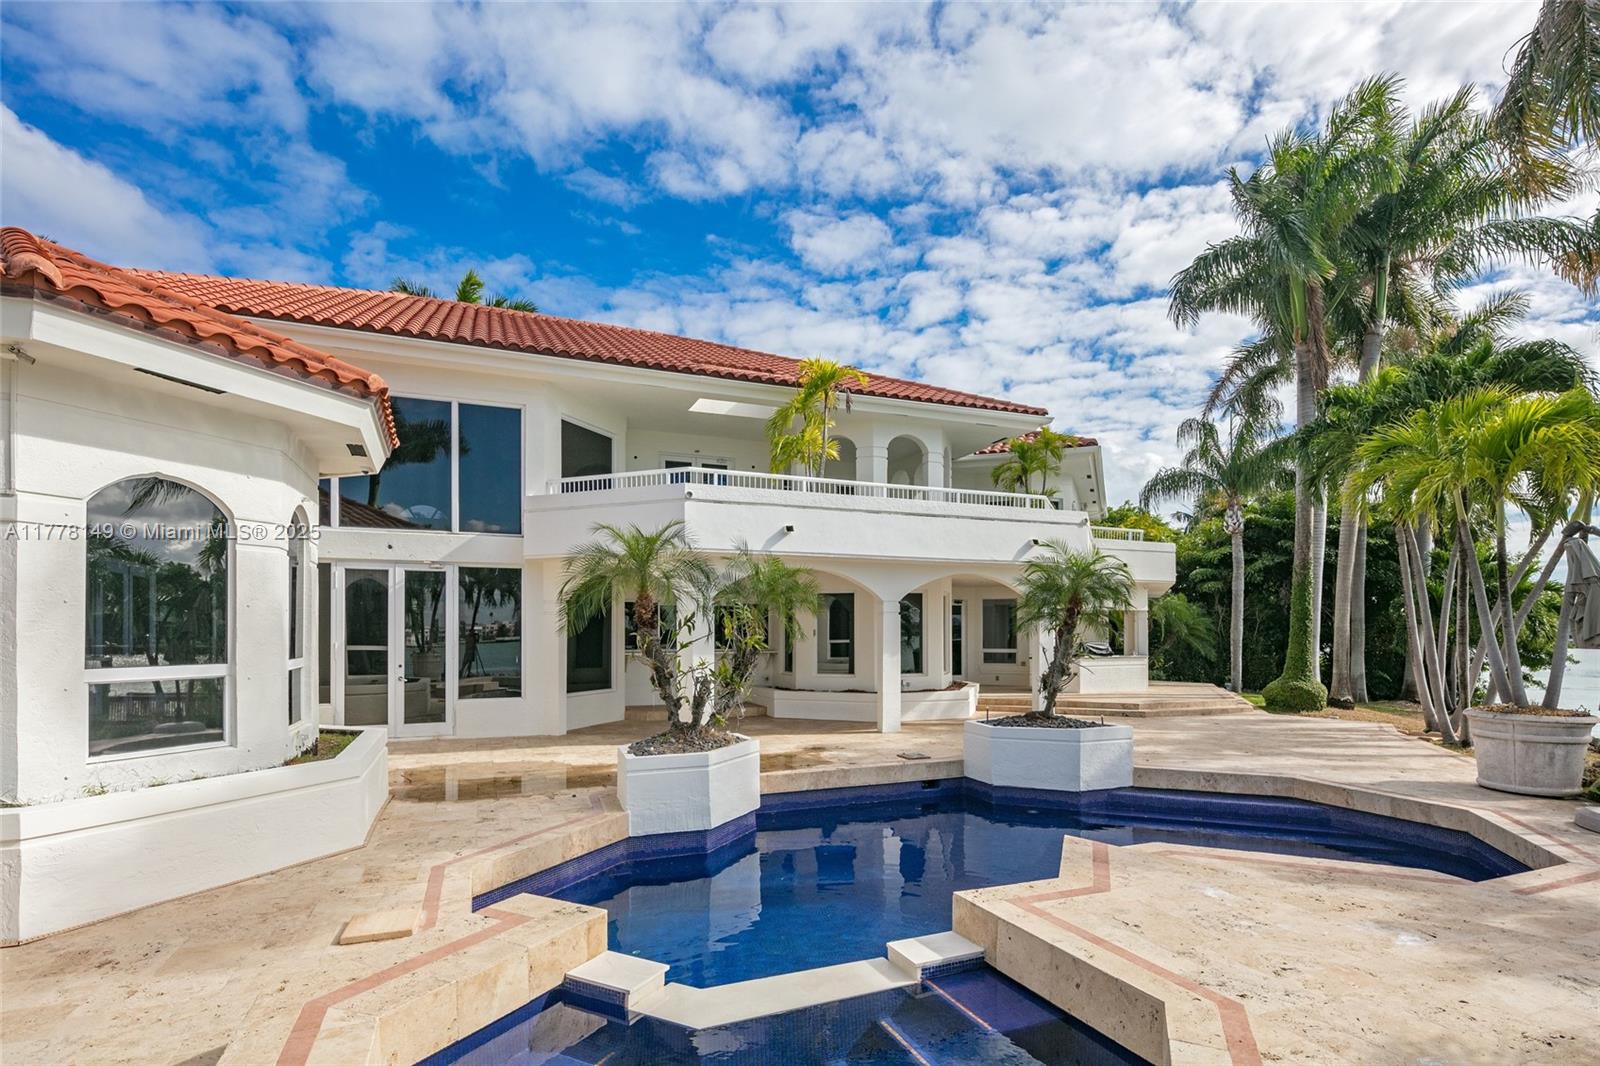
5120 Alton Rd, Miami Beach, FL 33140
$-9,319
Cash flow
-17.4%
Cash-on-Cash Return
2.2%
Cap rate
0.4%
Rent to Value Ratio
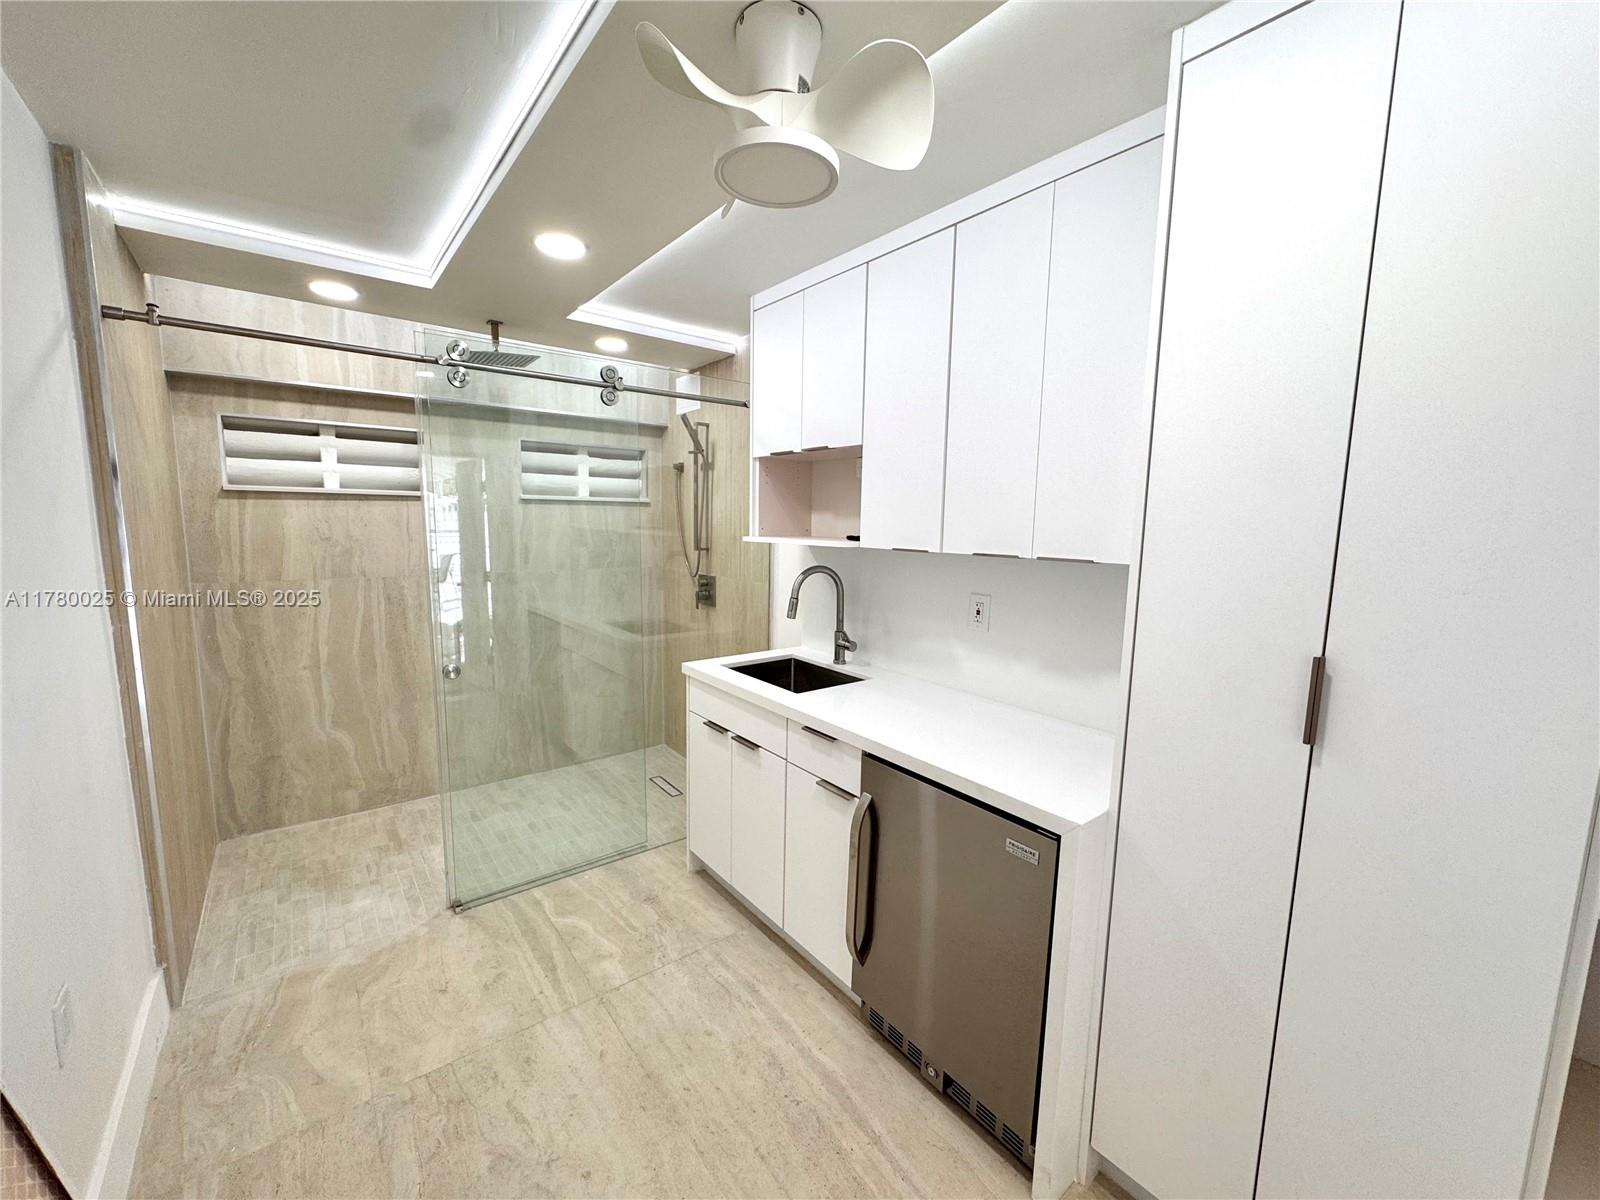
Active
$515,000
1
bds
|
1
ba
|
837
sqft
|
built
1965
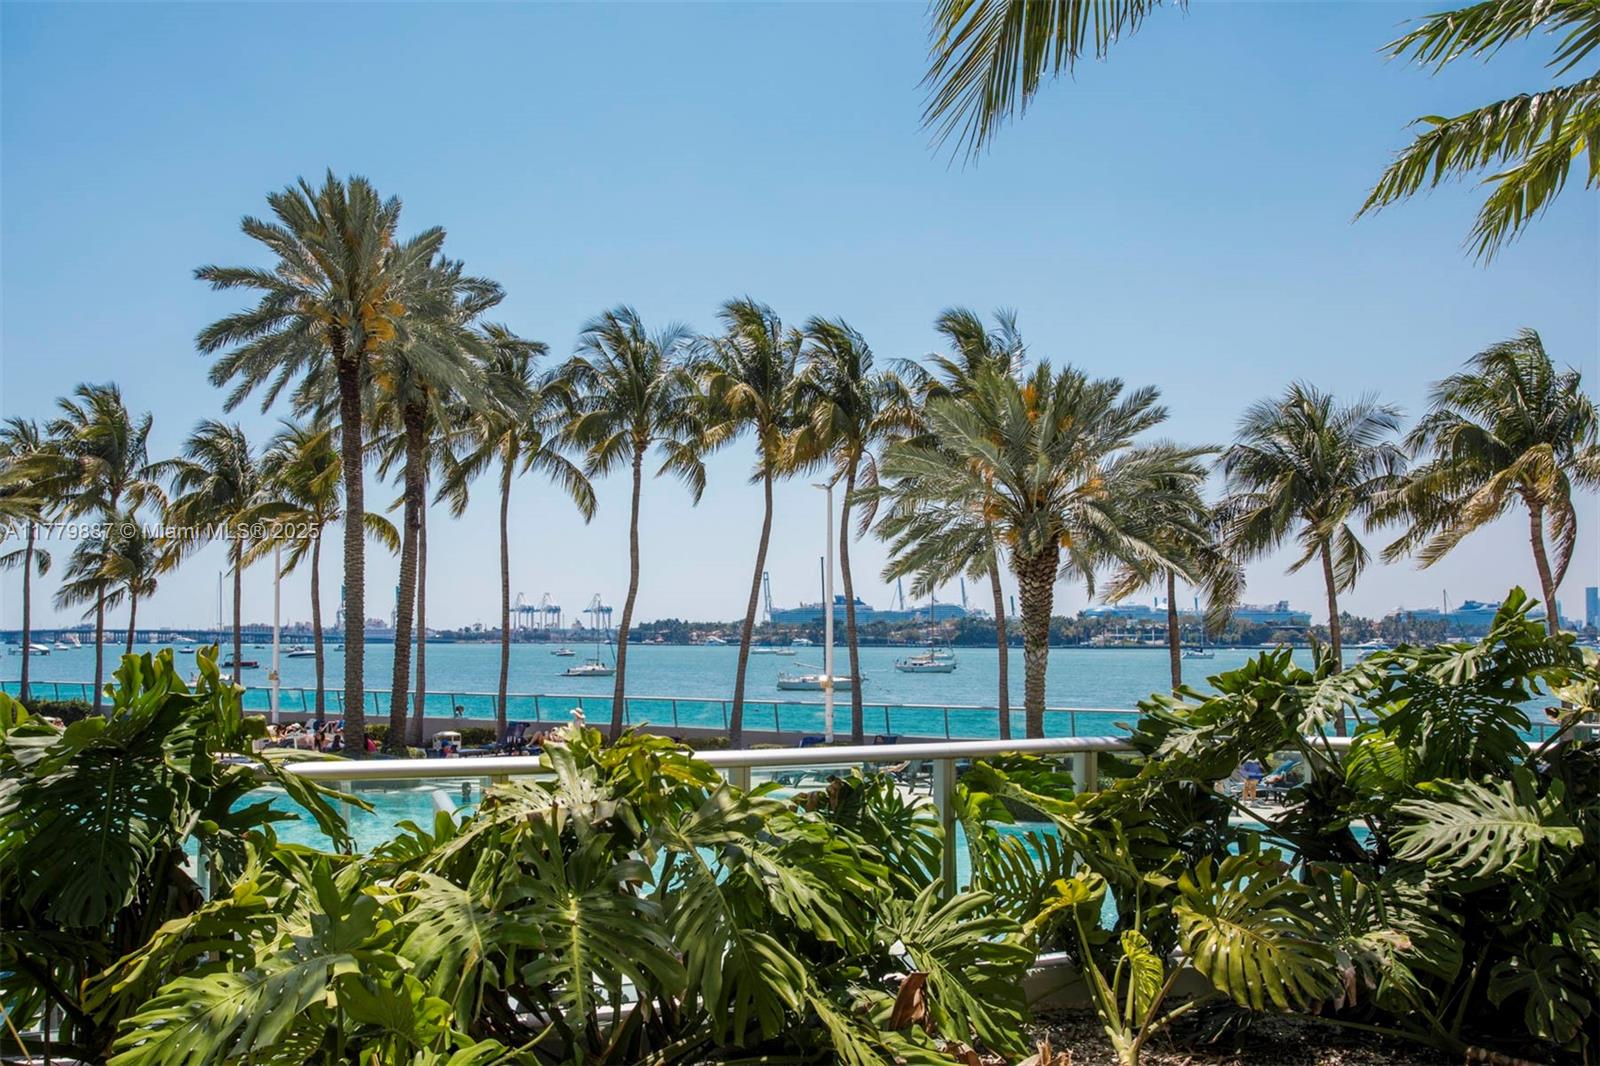
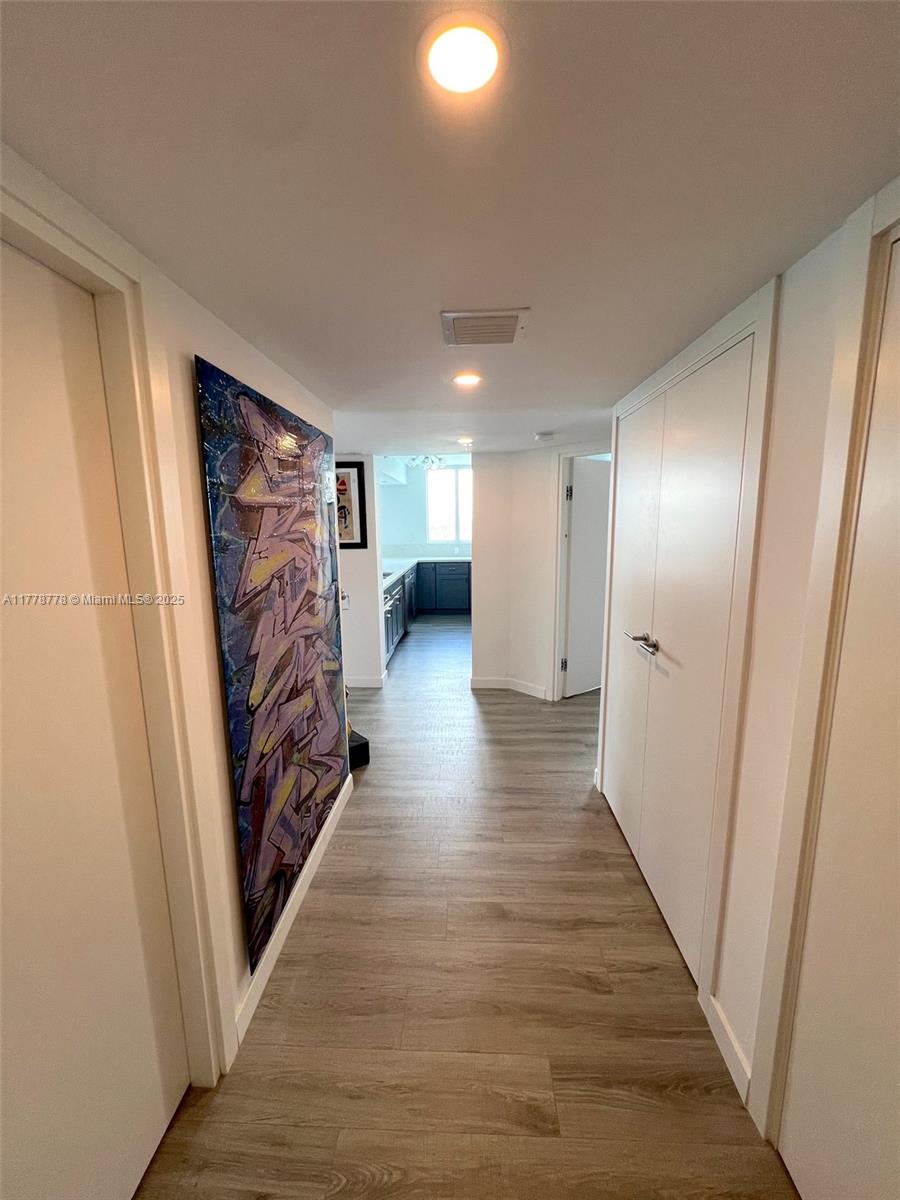
1200 West Ave, Miami Beach, FL 33139
$-1,679
Cash flow
-17.0%
Cash-on-Cash Return
2.2%
Cap rate
0.7%
Rent to Value Ratio
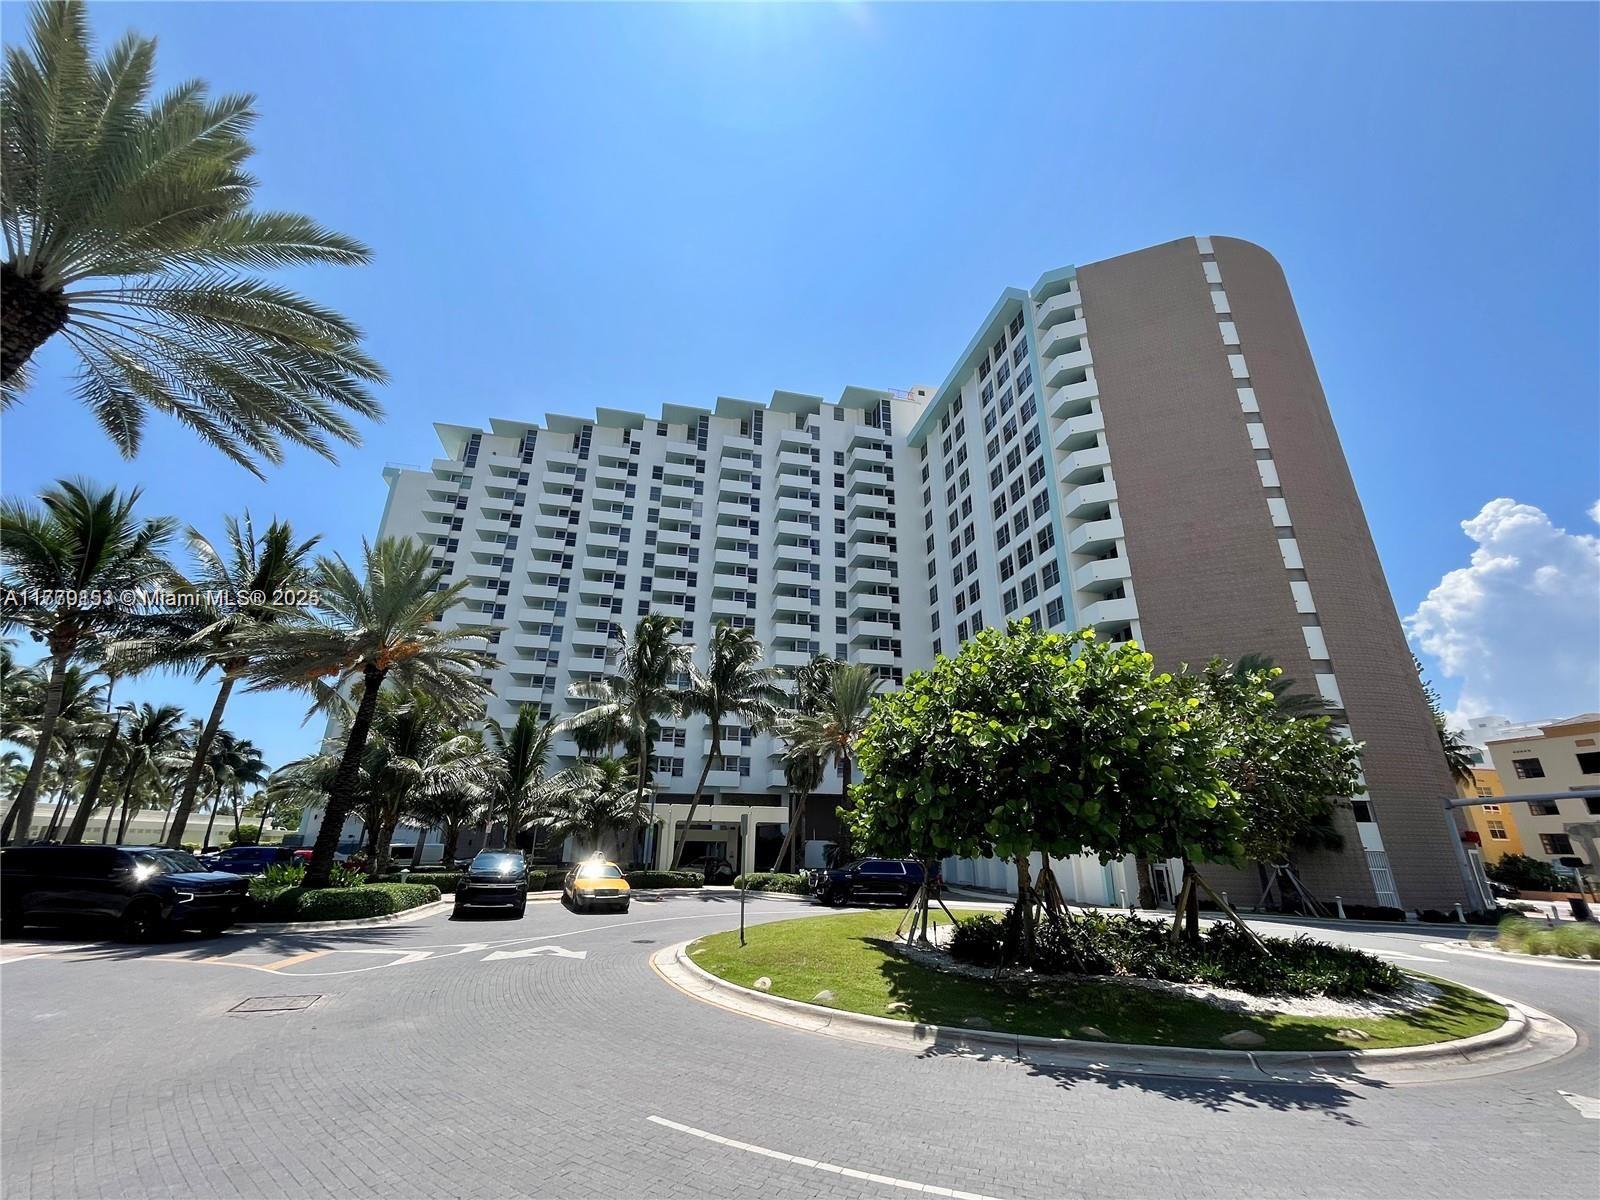
Active
$407,999
1
bds
|
2
ba
|
910
sqft
|
built
1968
6770 Indian Creek Dr, Miami Beach, FL 33141
$-1,511
Cash flow
-19.3%
Cash-on-Cash Return
1.7%
Cap rate
0.7%
Rent to Value Ratio
Active
$135,000
bds
|
1
ba
|
112
sqft
|
built
1966
2899 Collins Ave, Miami Beach, FL 33140
$597
Cash flow
23.1%
Cash-on-Cash Return
11.5%
Cap rate
1.6%
Rent to Value Ratio
Active
$299,000
1
bds
|
2
ba
|
718
sqft
|
built
1972
1345 Lincoln Rd, Miami Beach, FL 33139
$-547
Cash flow
-9.5%
Cash-on-Cash Return
4.0%
Cap rate
0.9%
Rent to Value Ratio
Active
$295,000
1
bds
|
1
ba
|
570
sqft
|
built
1940
1561 Lenox Ave, Miami Beach, FL 33139
$-1,006
Cash flow
-17.8%
Cash-on-Cash Return
2.1%
Cap rate
0.7%
Rent to Value Ratio

Active
$699,000
2
bds
|
2
ba
|
1,340
sqft
|
built
1964
5005 Collins Ave, Miami Beach, FL 33140
$-3,217
Cash flow
-24.0%
Cash-on-Cash Return
0.6%
Cap rate
0.6%
Rent to Value Ratio

Active
$180,000
1
bds
|
1
ba
|
578
sqft
|
built
1949
630 84th St, Miami Beach, FL 33141
$-657
Cash flow
-19.0%
Cash-on-Cash Return
1.8%
Cap rate
1.0%
Rent to Value Ratio
Active
$330,000
bds
|
1
ba
|
566
sqft
|
built
1966
2899 Collins Ave, Miami Beach, FL 33140
$-355
Cash flow
-5.6%
Cash-on-Cash Return
4.9%
Cap rate
0.8%
Rent to Value Ratio
Active
$735,000
2
bds
|
3
ba
|
1,200
sqft
|
built
1965
1545 Jefferson Ave, Miami Beach, FL 33139
$-1,442
Cash flow
-10.2%
Cash-on-Cash Return
3.8%
Cap rate
0.6%
Rent to Value Ratio
Active
$395,000
1
bds
|
1
ba
|
656
sqft
|
built
1970
345 Ocean Dr, Miami Beach, FL 33139
$-1,458
Cash flow
-19.3%
Cash-on-Cash Return
1.7%
Cap rate
0.7%
Rent to Value Ratio

Active
$649,000
2
bds
|
2
ba
|
1,305
sqft
|
built
1980
2625 Collins Ave, Miami Beach, FL 33140
$-2,844
Cash flow
-22.9%
Cash-on-Cash Return
0.9%
Cap rate
0.5%
Rent to Value Ratio
Active
$18,500,000
8
bds
|
9
ba
|
8,911
sqft
|
built
1992
6640 Allison Rd, Miami Beach, FL 33141
$-111,985
Cash flow
-31.6%
Cash-on-Cash Return
-1.1%
Cap rate
0.1%
Rent to Value Ratio

Active
$259,000
1
bds
|
2
ba
|
680
sqft
|
built
1974
6545 Indian Creek Dr, Miami Beach, FL 33141
$-740
Cash flow
-14.9%
Cash-on-Cash Return
2.7%
Cap rate
0.8%
Rent to Value Ratio
Active
$485,000
1
bds
|
1
ba
|
726
sqft
|
built
1960
1500 Bay Rd, Miami Beach, FL 33139
$-1,843
Cash flow
-19.8%
Cash-on-Cash Return
1.6%
Cap rate
0.7%
Rent to Value Ratio
Active
$1,400,000
2
bds
|
2
ba
|
1,147
sqft
|
built
1997
650 West Ave, Miami Beach, FL 33139
$-5,049
Cash flow
-18.8%
Cash-on-Cash Return
1.8%
Cap rate
0.5%
Rent to Value Ratio
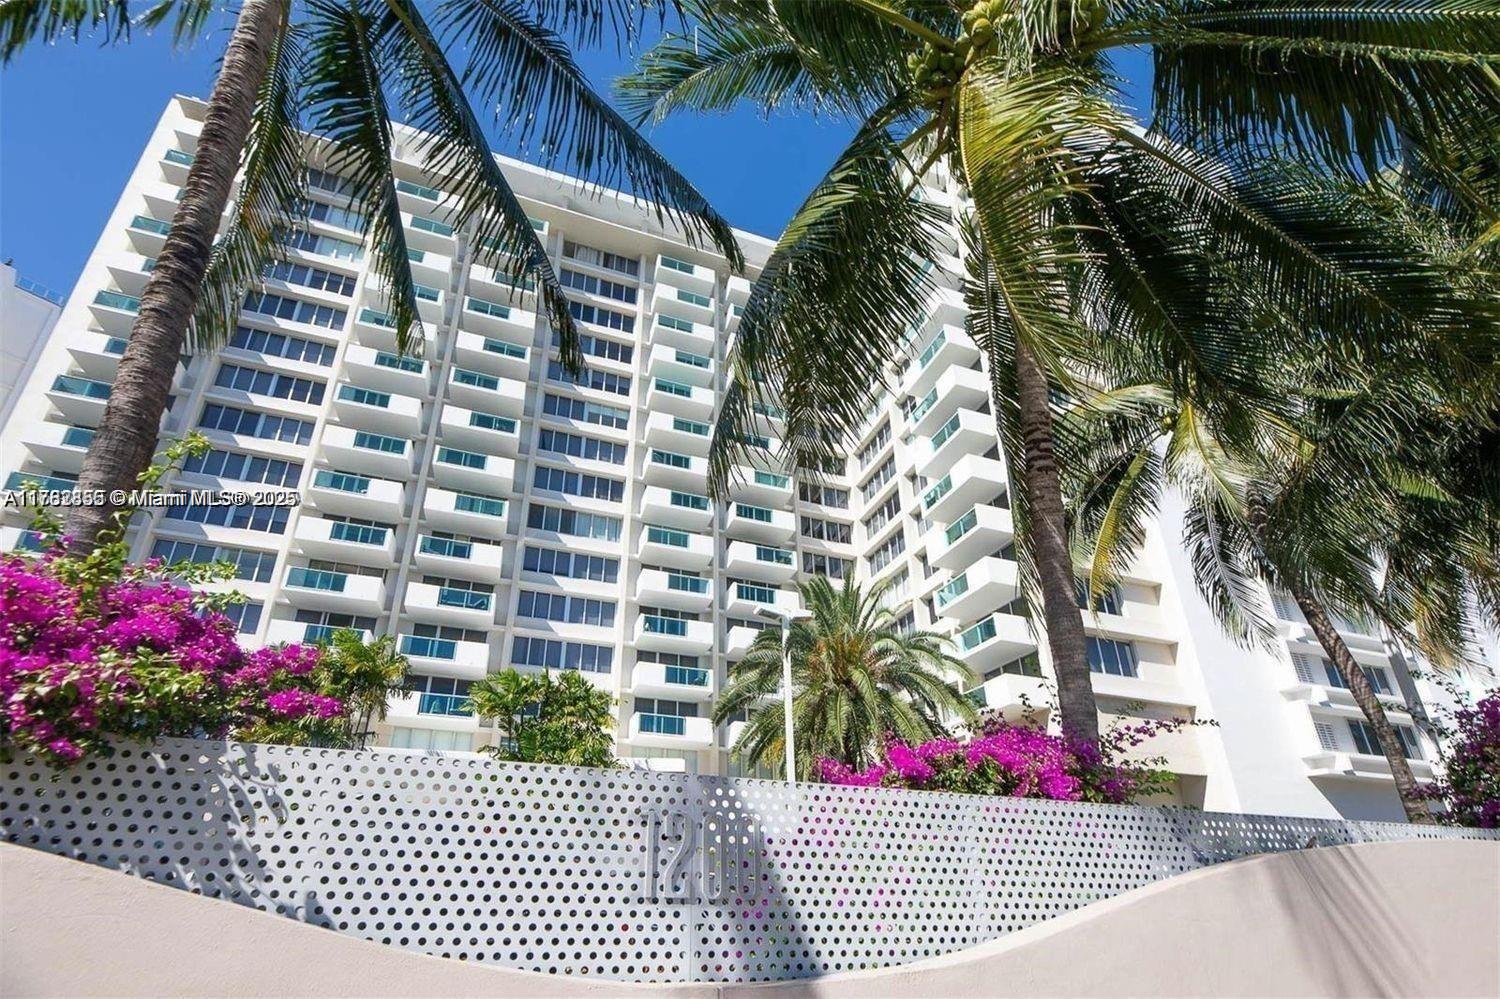
Active
$499,000
1
bds
|
1
ba
|
837
sqft
|
built
1965
1200 West Ave, Miami Beach, FL 33139
$-1,967
Cash flow
-20.6%
Cash-on-Cash Return
1.4%
Cap rate
0.6%
Rent to Value Ratio

Active
$315,000
1
bds
|
1
ba
|
461
sqft
|
built
1941
3030 Collins Ave, Miami Beach, FL 33140
$-1,339
Cash flow
-22.2%
Cash-on-Cash Return
1.0%
Cap rate
0.6%
Rent to Value Ratio
Active
$7,890,000
5
bds
|
6
ba
|
3,347
sqft
|
built
2016
1 Collins Ave, Miami Beach, FL 33139
$-52,048
Cash flow
-34.4%
Cash-on-Cash Return
-1.8%
Cap rate
0.1%
Rent to Value Ratio
Active
$359,000
1
bds
|
1
ba
|
934
sqft
|
built
1970
401 69th St, Miami Beach, FL 33141
$-1,412
Cash flow
-20.5%
Cash-on-Cash Return
1.4%
Cap rate
0.8%
Rent to Value Ratio
Active
$545,000
1
bds
|
2
ba
|
791
sqft
|
built
2013
2130 Park Ave, Miami Beach, FL 33139
$-1,930
Cash flow
-18.5%
Cash-on-Cash Return
1.9%
Cap rate
0.7%
Rent to Value Ratio
Active
$2,297,000
2
bds
|
2
ba
|
1,296
sqft
|
built
2009
125 Ocean Dr, Miami Beach, FL 33139
$-11,293
Cash flow
-25.7%
Cash-on-Cash Return
0.2%
Cap rate
0.4%
Rent to Value Ratio
Active
$245,000
1
bds
|
1
ba
|
518
sqft
|
built
1940
810 7th St, Miami Beach, FL 33139
$-655
Cash flow
-13.9%
Cash-on-Cash Return
2.9%
Cap rate
0.9%
Rent to Value Ratio
Active
$214,000
bds
|
1
ba
|
420
sqft
|
built
1956
911 Meridian Ave, Miami Beach, FL 33139
$-516
Cash flow
-12.6%
Cash-on-Cash Return
3.3%
Cap rate
0.8%
Rent to Value Ratio
Active
$215,000
bds
|
1
ba
|
470
sqft
|
built
1970
716 Michigan Ave, Miami Beach, FL 33139
$-416
Cash flow
-10.1%
Cash-on-Cash Return
3.8%
Cap rate
0.9%
Rent to Value Ratio
Active
$7,800,000
5
bds
|
4
ba
|
3,814
sqft
|
built
1962
1150 S Biscayne Point Rd, Miami Beach, FL 33141
$-41,964
Cash flow
-28.1%
Cash-on-Cash Return
-0.3%
Cap rate
0.1%
Rent to Value Ratio
Active
$499,000
1
bds
|
2
ba
|
824
sqft
|
built
1969
5701 Collins Ave, Miami Beach, FL 33140
$-2,065
Cash flow
-21.6%
Cash-on-Cash Return
1.2%
Cap rate
0.7%
Rent to Value Ratio
Active
$379,900
1
bds
|
1
ba
|
621
sqft
|
built
1972
221 Meridian Ave, Miami Beach, FL 33139
$-773
Cash flow
-10.6%
Cash-on-Cash Return
3.7%
Cap rate
0.7%
Rent to Value Ratio
Active
$1,600,000
8
bds
|
0
ba
|
4,731
sqft
|
built
1955
809 85th St, Miami Beach, FL 33141
$-7,263
Cash flow
-23.7%
Cash-on-Cash Return
0.7%
Cap rate
0.2%
Rent to Value Ratio
Active
$949,000
2
bds
|
2
ba
|
1,190
sqft
|
built
1981
9 Island Ave, Miami Beach, FL 33139
$-3,488
Cash flow
-19.2%
Cash-on-Cash Return
1.7%
Cap rate
0.5%
Rent to Value Ratio
Active
$419,000
2
bds
|
2
ba
|
1,175
sqft
|
built
1980
7801 Abbott Ave, Miami Beach, FL 33141
$-825
Cash flow
-10.3%
Cash-on-Cash Return
3.8%
Cap rate
0.7%
Rent to Value Ratio
Active
$750,000
1
bds
|
2
ba
|
1,412
sqft
|
built
1976
6423 Collins Ave, Miami Beach, FL 33141
$-2,635
Cash flow
-18.3%
Cash-on-Cash Return
1.9%
Cap rate
0.5%
Rent to Value Ratio
Active
$550,000
1
bds
|
1
ba
|
620
sqft
|
built
1923
834 Ocean Dr, Miami Beach, FL 33139
$-2,221
Cash flow
-21.1%
Cash-on-Cash Return
1.3%
Cap rate
0.6%
Rent to Value Ratio
Active
$5,100,000
5
bds
|
5
ba
|
4,401
sqft
|
built
2003
4501 N Bay Rd, Miami Beach, FL 33140
$-21,903
Cash flow
-22.4%
Cash-on-Cash Return
1.0%
Cap rate
0.2%
Rent to Value Ratio
Active
$14,900,000
5
bds
|
7
ba
|
6,408
sqft
|
built
1968
7960 Biscayne Point Cir, Miami Beach, FL 33141
$-87,202
Cash flow
-30.5%
Cash-on-Cash Return
-0.9%
Cap rate
0.1%
Rent to Value Ratio

Active
$3,377,000
3
bds
|
4
ba
|
2,123
sqft
|
built
1967
5251 Lagorce Dr, Miami Beach, FL 33140
$-13,395
Cash flow
-20.7%
Cash-on-Cash Return
1.4%
Cap rate
0.2%
Rent to Value Ratio
Active
$740,000
2
bds
|
2
ba
|
1,135
sqft
|
built
2016
6620 Indian Creek Dr, Miami Beach, FL 33141
$-3,236
Cash flow
-22.8%
Cash-on-Cash Return
0.9%
Cap rate
0.6%
Rent to Value Ratio
Active
$1,025,000
2
bds
|
2
ba
|
1,190
sqft
|
built
1981
9 Island Ave, Miami Beach, FL 33139
$-3,694
Cash flow
-18.8%
Cash-on-Cash Return
1.8%
Cap rate
0.6%
Rent to Value Ratio
Active
$2,500,000
5
bds
|
5
ba
|
3,990
sqft
|
built
1937
1534 Euclid Ave, Miami Beach, FL 33139
$-11,530
Cash flow
-24.1%
Cash-on-Cash Return
0.6%
Cap rate
0.2%
Rent to Value Ratio

Active
$280,000
1
bds
|
1
ba
|
497
sqft
|
built
1936
1600 Euclid Ave, Miami Beach, FL 33139
$-720
Cash flow
-13.4%
Cash-on-Cash Return
3.1%
Cap rate
0.8%
Rent to Value Ratio