Miami Beach, FL Investment Properties for Sale
Browse homes for sale and investment properties in Miami Beach, FL. Refine your search by price, property type, or more.
Best cash flowing properties in Miami Beach, FL
Active
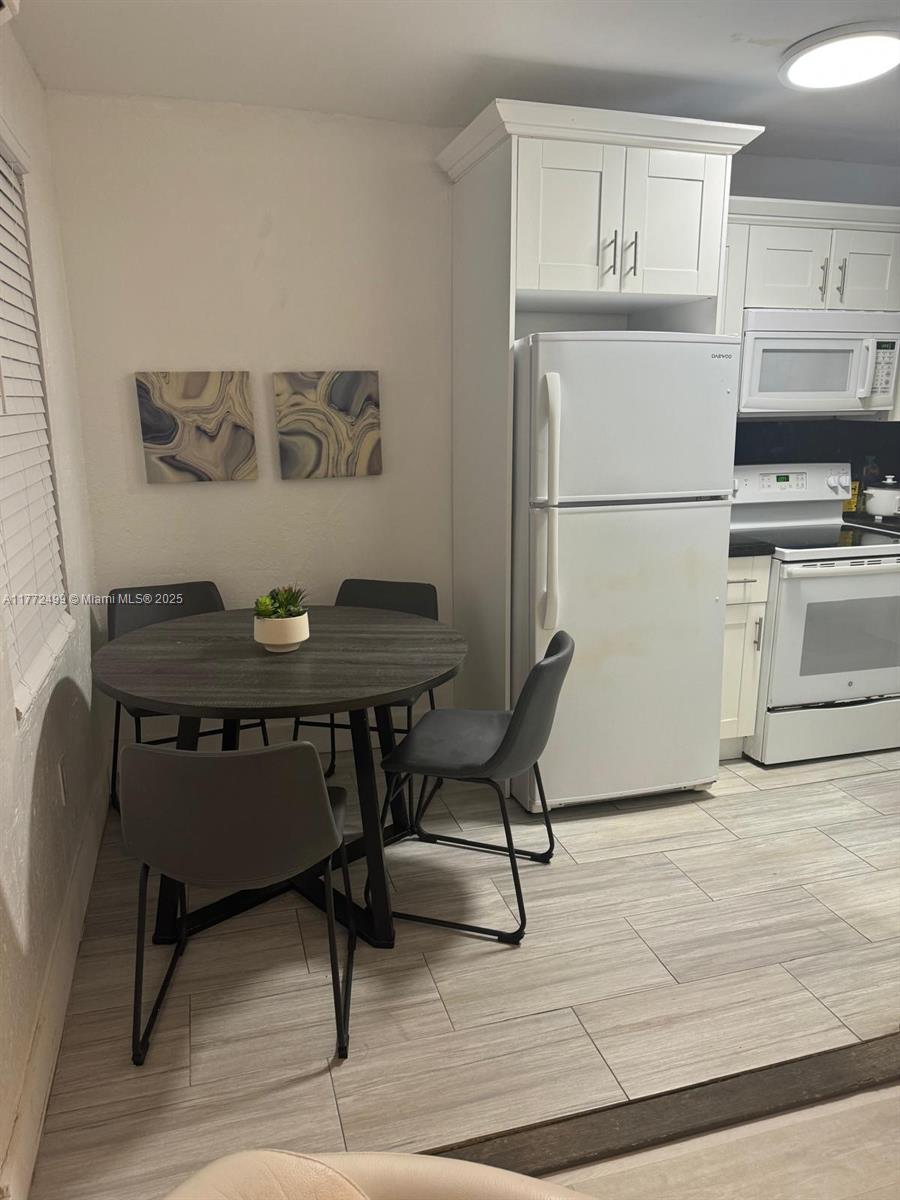
$203,000
1
bds
|
1
ba
|
493
sqft
|
built
1940
7928 Harding Ave, Miami Beach, FL 33141
$-400
Cash flow
-10.3%
Cash-on-Cash Return
3.8%
Cap rate
0.9%
Rent to Value Ratio
Active
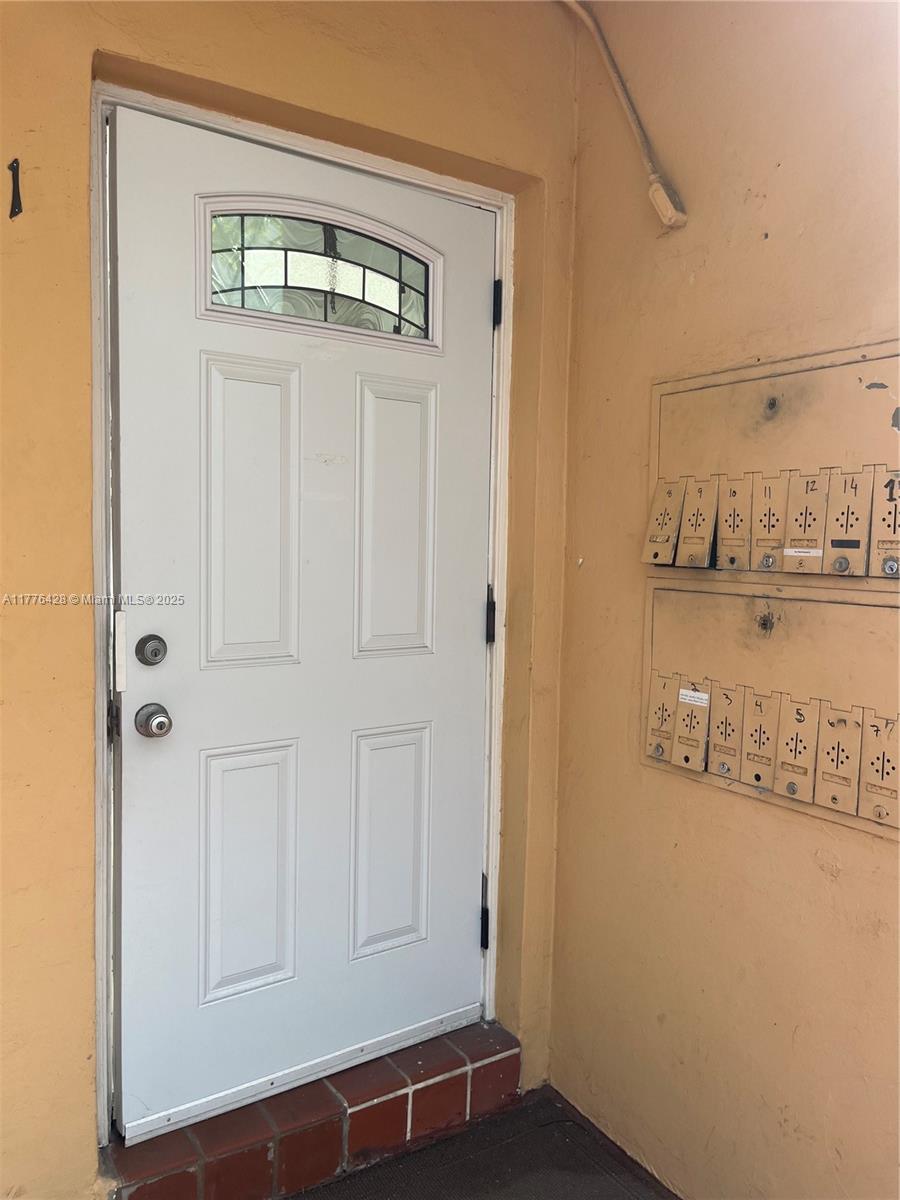
$165,000
bds
|
1
ba
|
406
sqft
|
built
1958
7720 Harding Ave, Miami Beach, FL 33141
$-423
Cash flow
-13.4%
Cash-on-Cash Return
3.1%
Cap rate
1.0%
Rent to Value Ratio
1,961 out of 2,163 properties for sale in Miami Beach, FL
Limited Results Shown
Create a free account, or log in to reveal all property listings and enjoy the complete experience.
Active
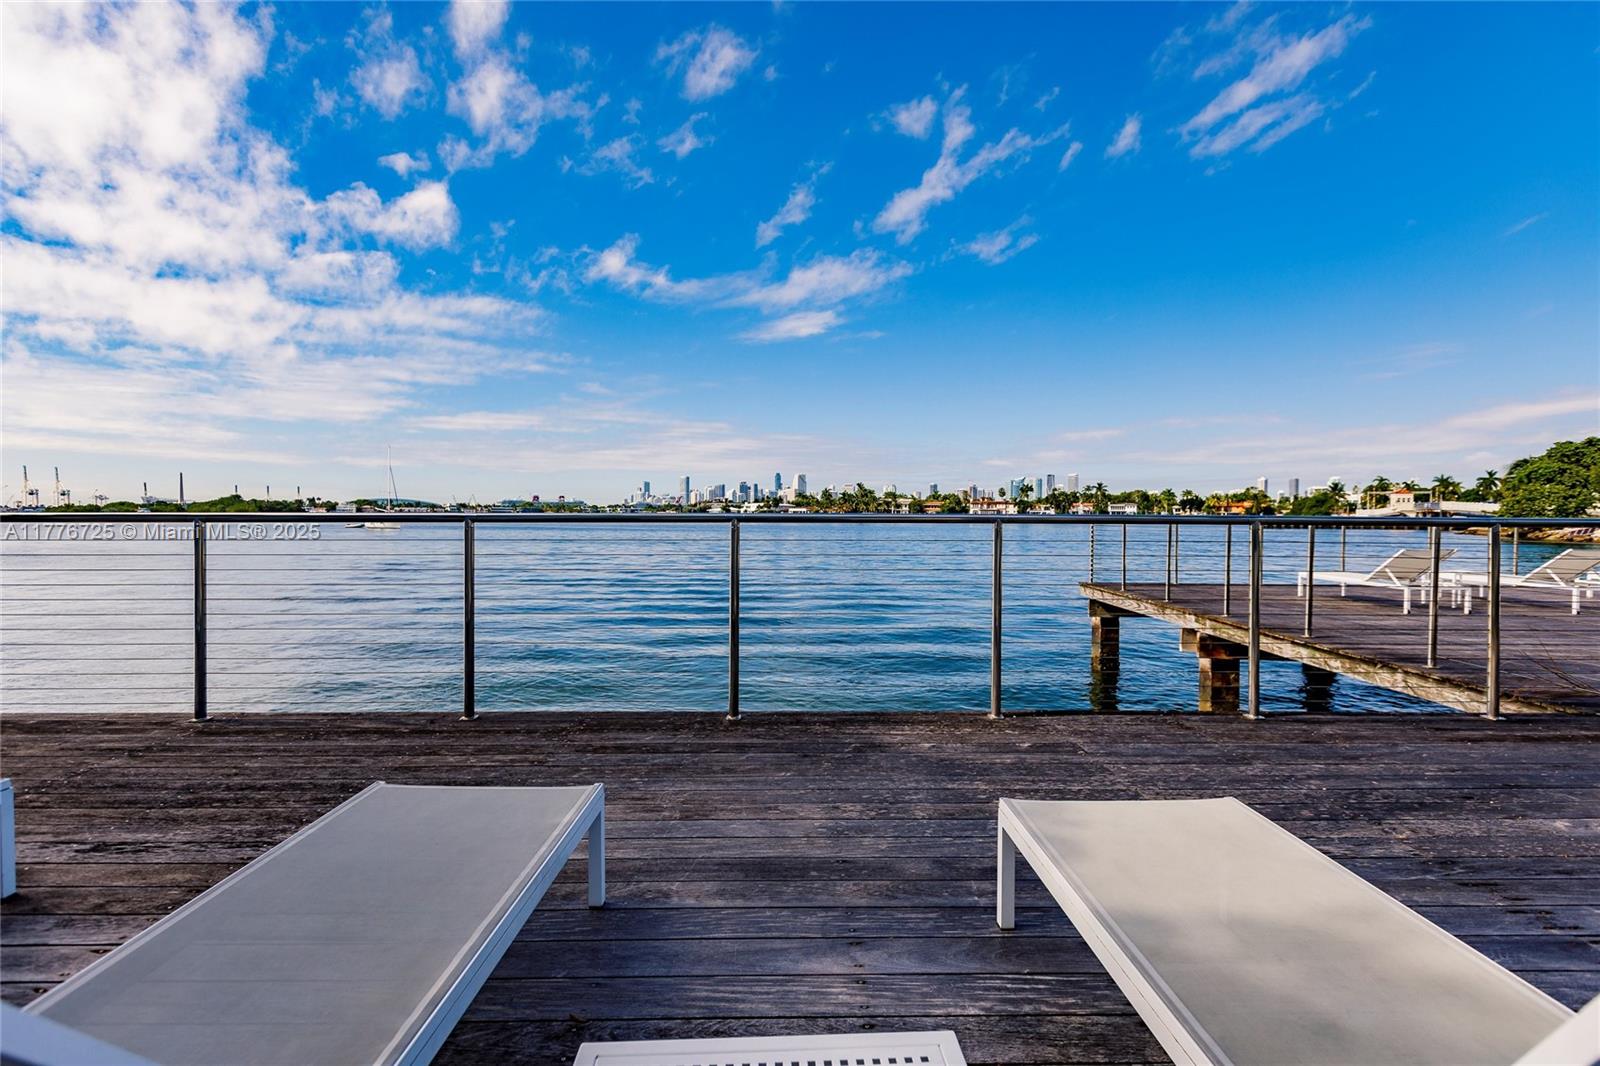
$400,000
1
bds
|
1
ba
|
624
sqft
|
built
1962
3 Island Ave, Miami Beach, FL 33139
$-1,460
Cash flow
-19.0%
Cash-on-Cash Return
1.8%
Cap rate
0.7%
Rent to Value Ratio
Active
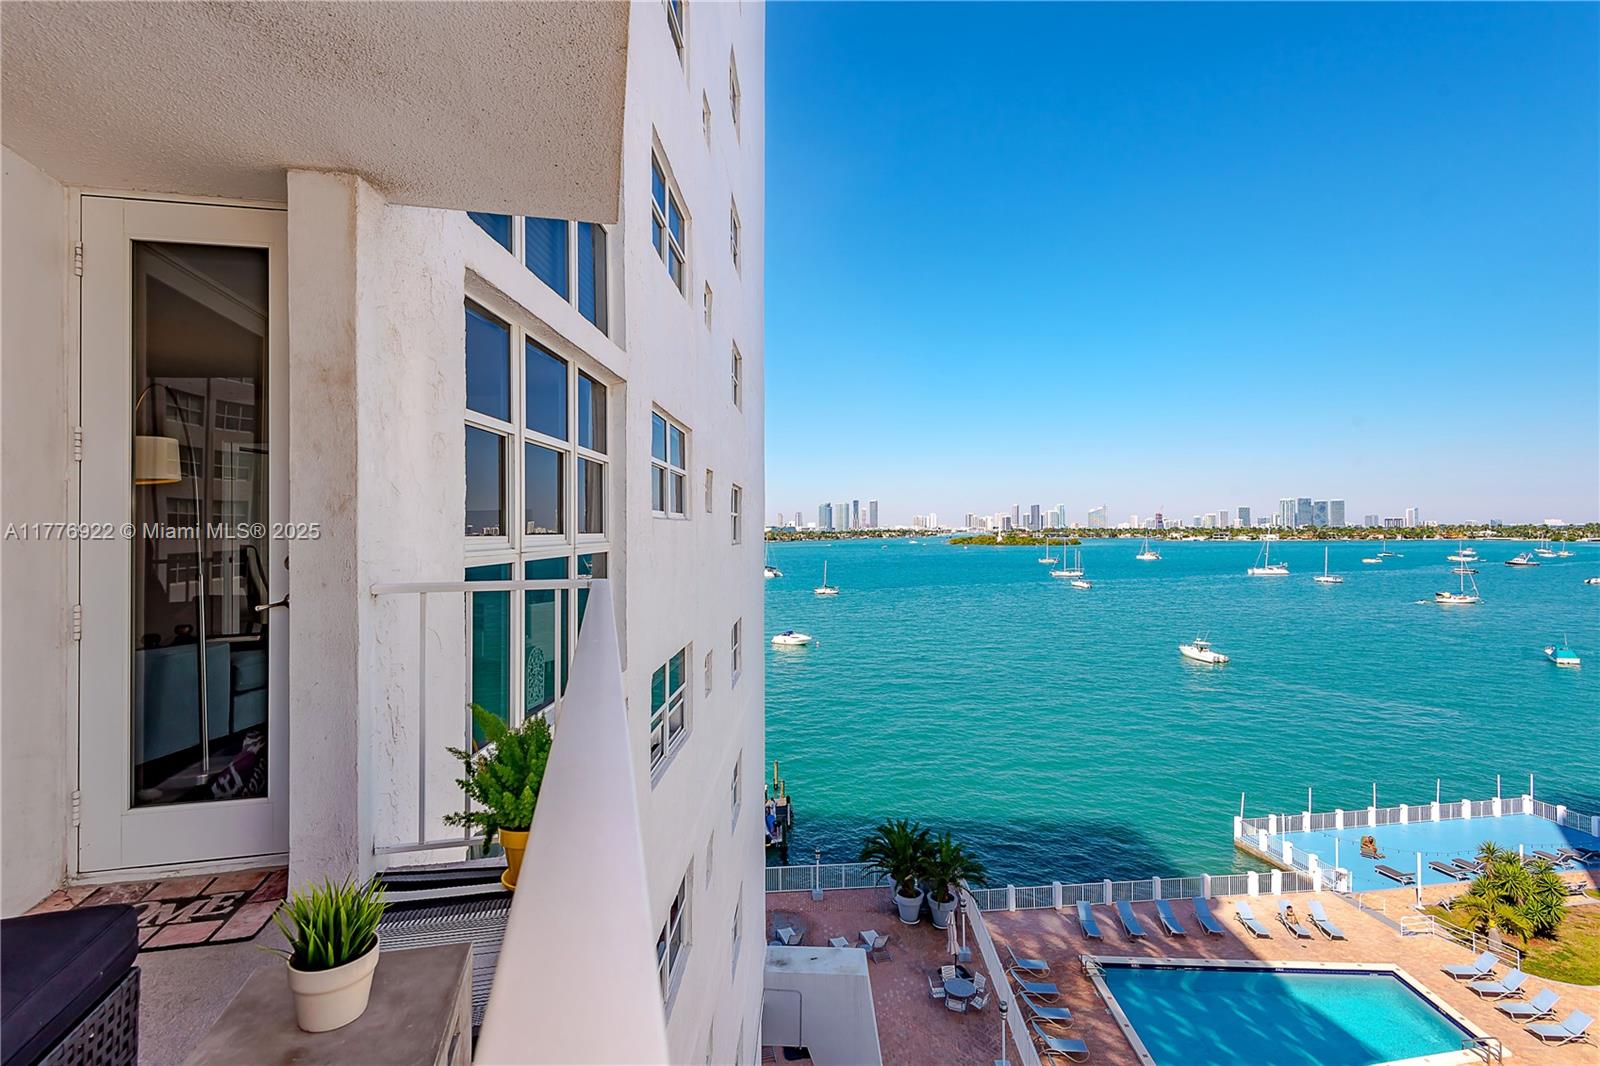
$635,000
2
bds
|
2
ba
|
940
sqft
|
built
1971
1228 West Ave, Miami Beach, FL 33139
$-2,041
Cash flow
-16.8%
Cash-on-Cash Return
2.3%
Cap rate
0.6%
Rent to Value Ratio
Active
$489,000
1
bds
|
1
ba
|
589
sqft
|
built
1955
935 Euclid Ave, Miami Beach, FL 33139
$-685
Cash flow
-7.3%
Cash-on-Cash Return
4.5%
Cap rate
0.8%
Rent to Value Ratio
Active
$245,000
1
bds
|
1
ba
|
600
sqft
|
built
1965
549 Meridian Ave, Miami Beach, FL 33139
$-653
Cash flow
-13.9%
Cash-on-Cash Return
2.9%
Cap rate
0.8%
Rent to Value Ratio
Active
$2,360,000
4
bds
|
3
ba
|
2,011
sqft
|
built
1949
1323 Cleveland Rd, Miami Beach, FL 33141
$-7,266
Cash flow
-16.1%
Cash-on-Cash Return
2.5%
Cap rate
0.4%
Rent to Value Ratio
Active
$685,000
2
bds
|
2
ba
|
1,700
sqft
|
built
2010
6000 Collins Ave, Miami Beach, FL 33140
$-1,949
Cash flow
-14.8%
Cash-on-Cash Return
2.7%
Cap rate
0.8%
Rent to Value Ratio
Active
$330,000
1
bds
|
1
ba
|
742
sqft
|
built
1965
1030 9th St, Miami Beach, FL 33139
$-510
Cash flow
-8.1%
Cash-on-Cash Return
4.3%
Cap rate
0.8%
Rent to Value Ratio
Active
$5,000,000
2
bds
|
3
ba
|
1,938
sqft
|
built
2015
120 Ocean Dr, Miami Beach, FL 33139
$-26,071
Cash flow
-27.2%
Cash-on-Cash Return
-0.1%
Cap rate
0.2%
Rent to Value Ratio
Active
$1,299,000
2
bds
|
2
ba
|
1,169
sqft
|
built
1987
400 S Pointe Dr, Miami Beach, FL 33139
$-3,947
Cash flow
-15.9%
Cash-on-Cash Return
2.5%
Cap rate
0.5%
Rent to Value Ratio

Active
$1,395,000
2
bds
|
2
ba
|
1,420
sqft
|
built
2008
6799 Collins Ave, Miami Beach, FL 33141
$-3,233
Cash flow
-12.1%
Cash-on-Cash Return
3.4%
Cap rate
0.6%
Rent to Value Ratio
Active
$500,000
1
bds
|
1
ba
|
619
sqft
|
built
1936
310 Jefferson Ave, Miami Beach, FL 33139
$-1,799
Cash flow
-18.8%
Cash-on-Cash Return
1.8%
Cap rate
0.5%
Rent to Value Ratio
Active
$165,000
bds
|
1
ba
|
406
sqft
|
built
1958
7720 Harding Ave, Miami Beach, FL 33141
$-423
Cash flow
-13.4%
Cash-on-Cash Return
3.1%
Cap rate
1.0%
Rent to Value Ratio
Active
$350,000
1
bds
|
1
ba
|
650
sqft
|
built
1925
929 Michigan Ave, Miami Beach, FL 33139
$-1,135
Cash flow
-16.9%
Cash-on-Cash Return
2.3%
Cap rate
0.7%
Rent to Value Ratio
Active
$1,799,000
3
bds
|
4
ba
|
2,203
sqft
|
built
2004
6103 Aqua Ave, Miami Beach, FL 33141
$-8,203
Cash flow
-23.8%
Cash-on-Cash Return
0.7%
Cap rate
0.6%
Rent to Value Ratio
Active
$604,000
1
bds
|
1
ba
|
530
sqft
|
built
2013
6700 Indian Creek Dr, Miami Beach, FL 33141
$-2,500
Cash flow
-21.6%
Cash-on-Cash Return
1.2%
Cap rate
0.5%
Rent to Value Ratio
Active
$449,000
2
bds
|
2
ba
|
1,129
sqft
|
built
1964
7441 Wayne Ave, Miami Beach, FL 33141
$-1,671
Cash flow
-19.4%
Cash-on-Cash Return
1.7%
Cap rate
0.6%
Rent to Value Ratio

Active
$319,900
1
bds
|
1
ba
|
445
sqft
|
built
2019
6080 Collins Ave, Miami Beach, FL 33140
$-1,228
Cash flow
-20.0%
Cash-on-Cash Return
1.5%
Cap rate
0.9%
Rent to Value Ratio
Active
$1,200,000
3
bds
|
3
ba
|
1,304
sqft
|
built
2013
6700 Indian Creek Dr, Miami Beach, FL 33141
$-4,118
Cash flow
-17.9%
Cash-on-Cash Return
2.0%
Cap rate
0.7%
Rent to Value Ratio
Active
$2,445,000
4
bds
|
3
ba
|
2,448
sqft
|
built
1925
4228 Alton Rd, Miami Beach, FL 33140
$-6,957
Cash flow
-14.8%
Cash-on-Cash Return
2.7%
Cap rate
0.4%
Rent to Value Ratio
Active
$360,000
bds
|
1
ba
|
400
sqft
|
built
1966
5445 Collins Ave, Miami Beach, FL 33140
$-1,820
Cash flow
-26.4%
Cash-on-Cash Return
0.1%
Cap rate
0.6%
Rent to Value Ratio
Active
$399,000
2
bds
|
2
ba
|
890
sqft
|
built
1968
2829 Indian Creek Dr, Miami Beach, FL 33140
$-1,635
Cash flow
-21.4%
Cash-on-Cash Return
1.2%
Cap rate
0.7%
Rent to Value Ratio
Active
$1,250,000
2
bds
|
3
ba
|
1,300
sqft
|
built
2006
6000 Indian Creek Dr, Miami Beach, FL 33140
$-4,352
Cash flow
-18.2%
Cash-on-Cash Return
2.0%
Cap rate
0.6%
Rent to Value Ratio

Active
$1,290,000
2
bds
|
3
ba
|
1,450
sqft
|
built
2005
2001 Meridian Ave, Miami Beach, FL 33139
$-5,274
Cash flow
-21.3%
Cash-on-Cash Return
1.2%
Cap rate
0.6%
Rent to Value Ratio
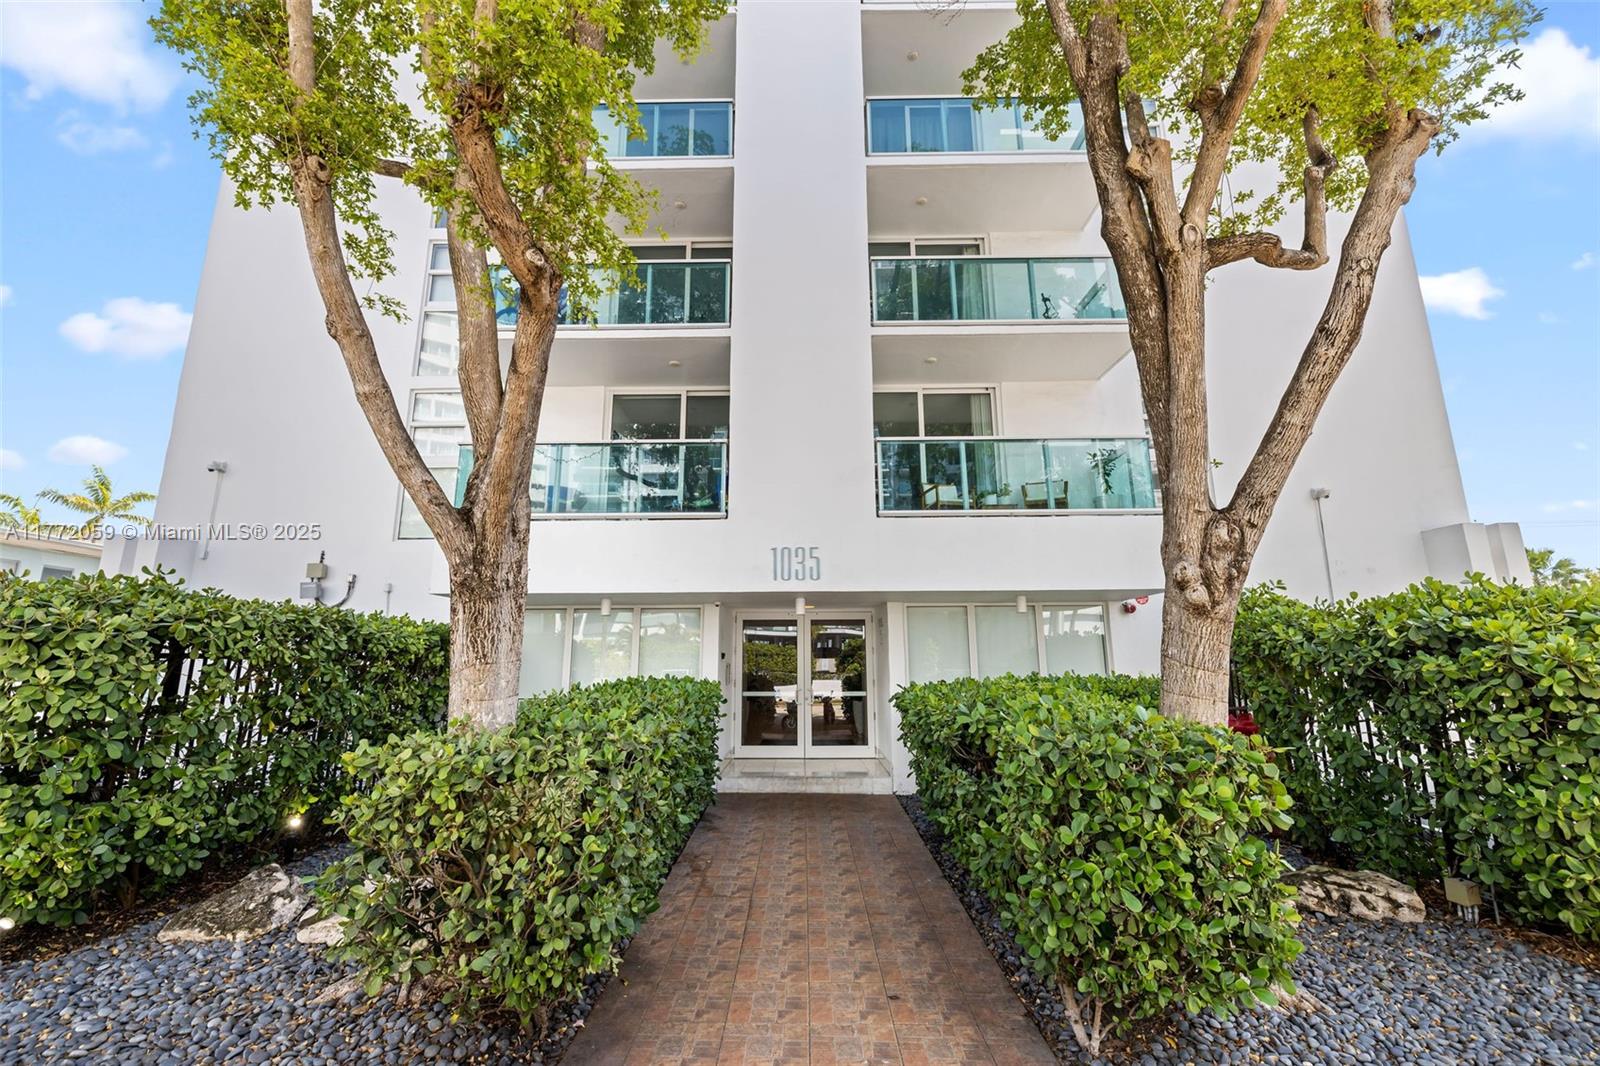
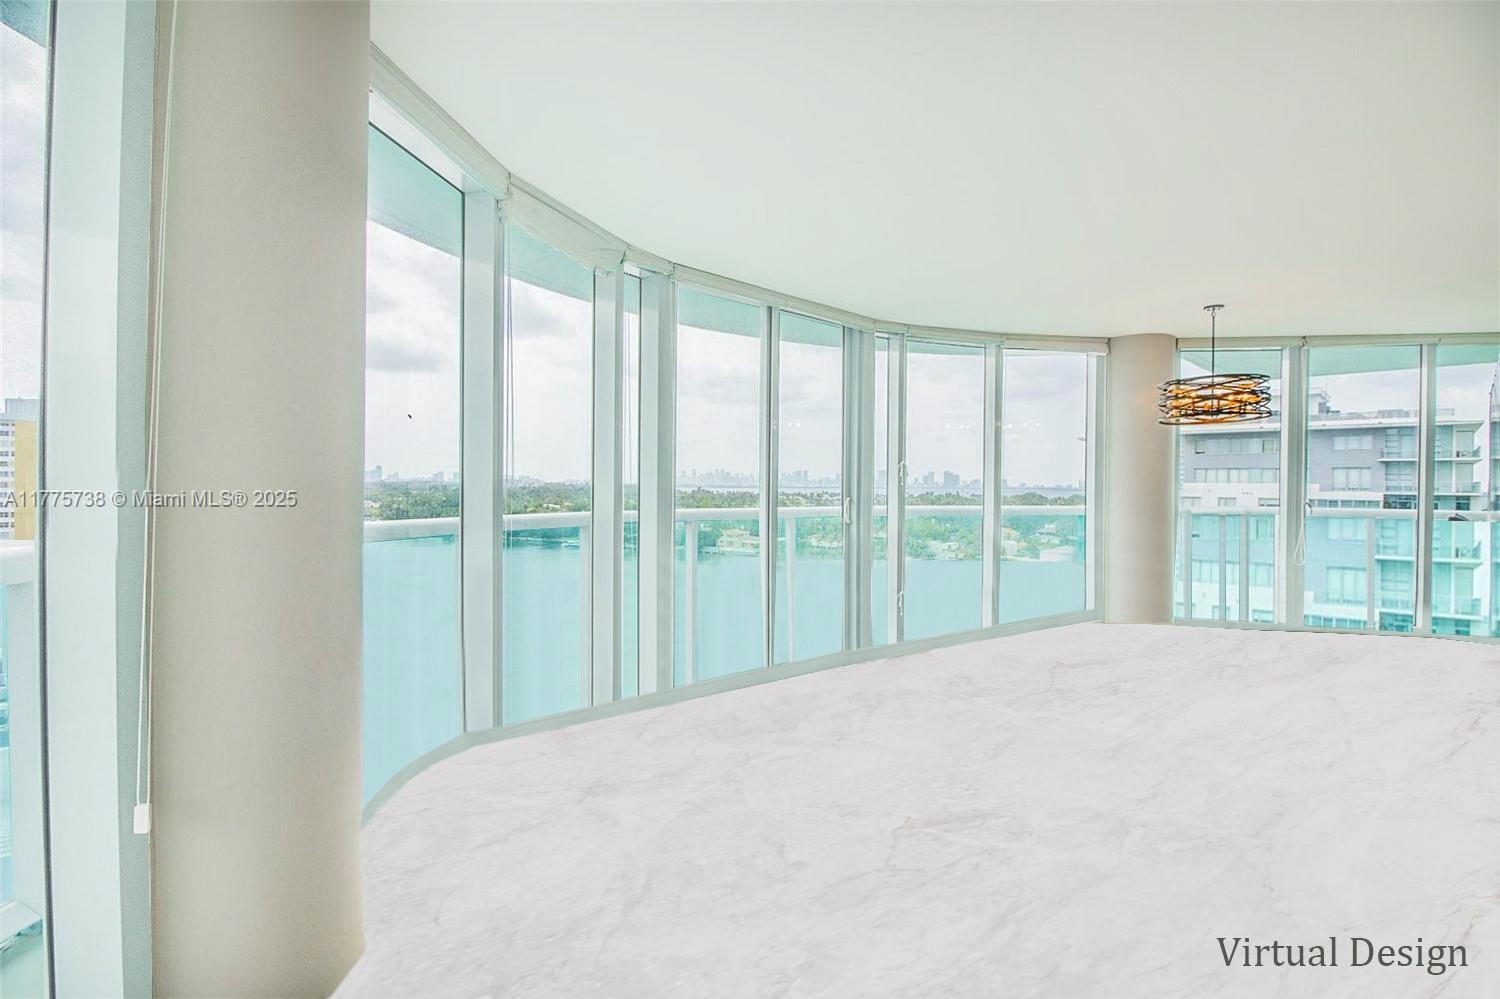
Active
$299,000
1
bds
|
1
ba
|
578
sqft
|
built
1979
1035 West Ave, Miami Beach, FL 33139
$-427
Cash flow
-7.5%
Cash-on-Cash Return
4.4%
Cap rate
0.8%
Rent to Value Ratio
Active
$248,000
1
bds
|
1
ba
|
578
sqft
|
built
1949
655 83rd St, Miami Beach, FL 33141
$-1,005
Cash flow
-21.1%
Cash-on-Cash Return
1.3%
Cap rate
0.7%
Rent to Value Ratio
Active
$230,000
bds
|
1
ba
|
560
sqft
|
built
1966
800 West Ave, Miami Beach, FL 33139
$-758
Cash flow
-17.2%
Cash-on-Cash Return
2.2%
Cap rate
1.0%
Rent to Value Ratio
Active
$299,000
1
bds
|
1
ba
|
700
sqft
|
built
1923
756 Meridian Ave, Miami Beach, FL 33139
$-1,047
Cash flow
-18.3%
Cash-on-Cash Return
1.9%
Cap rate
0.7%
Rent to Value Ratio
Active
$269,000
bds
|
1
ba
|
470
sqft
|
built
1962
641 Espanola Way, Miami Beach, FL 33139
$-479
Cash flow
-9.3%
Cash-on-Cash Return
4.0%
Cap rate
0.7%
Rent to Value Ratio
Active
$1,750,000
2
bds
|
3
ba
|
1,530
sqft
|
built
1998
1500 Ocean Dr, Miami Beach, FL 33139
$-6,168
Cash flow
-18.4%
Cash-on-Cash Return
1.9%
Cap rate
0.4%
Rent to Value Ratio
Active
$1,290,000
5
bds
|
3
ba
|
2,012
sqft
|
built
1969
7996 Crespi Blvd, Miami Beach, FL 33141
$-4,593
Cash flow
-18.6%
Cash-on-Cash Return
1.9%
Cap rate
0.3%
Rent to Value Ratio

Active
$1,699,000
3
bds
|
4
ba
|
1,597
sqft
|
built
2018
645 Michigan Ave, Miami Beach, FL 33139
$-6,044
Cash flow
-18.6%
Cash-on-Cash Return
1.9%
Cap rate
0.5%
Rent to Value Ratio
Active
$24,500,000
4
bds
|
6
ba
|
4,866
sqft
|
built
2024
94 S Hibiscus Dr, Miami Beach, FL 33139
$-130,028
Cash flow
-27.7%
Cash-on-Cash Return
-0.2%
Cap rate
0.0%
Rent to Value Ratio

Active
$5,695,000
3
bds
|
4
ba
|
3,192
sqft
|
built
1986
2437 Fisher Island Dr, Miami Beach, FL 33109
$-32,215
Cash flow
-29.5%
Cash-on-Cash Return
-0.6%
Cap rate
0.2%
Rent to Value Ratio
Active
$203,000
1
bds
|
1
ba
|
493
sqft
|
built
1940
7928 Harding Ave, Miami Beach, FL 33141
$-400
Cash flow
-10.3%
Cash-on-Cash Return
3.8%
Cap rate
0.9%
Rent to Value Ratio
Active
$399,000
1
bds
|
2
ba
|
640
sqft
|
built
1937
420 15th St, Miami Beach, FL 33139
$-1,357
Cash flow
-17.7%
Cash-on-Cash Return
2.1%
Cap rate
0.7%
Rent to Value Ratio
Active
$229,000
bds
|
1
ba
|
474
sqft
|
built
1952
1604 Drexel Ave, Miami Beach, FL 33139
$-685
Cash flow
-15.6%
Cash-on-Cash Return
2.6%
Cap rate
0.8%
Rent to Value Ratio
Active
$1,840,000
3
bds
|
2
ba
|
1,985
sqft
|
built
1938
4951 Cherokee Ave, Miami Beach, FL 33140
$-5,525
Cash flow
-15.7%
Cash-on-Cash Return
2.5%
Cap rate
0.4%
Rent to Value Ratio

Active
$625,000
1
bds
|
2
ba
|
430
sqft
|
built
1966
5445 Collins Ave, Miami Beach, FL 33140
$-3,319
Cash flow
-27.7%
Cash-on-Cash Return
-0.2%
Cap rate
0.5%
Rent to Value Ratio
Active
$1,900,000
6
bds
|
0
ba
|
3,041
sqft
|
built
1939
836 W 40th St, Miami Beach, FL 33140
$-7,435
Cash flow
-20.4%
Cash-on-Cash Return
1.5%
Cap rate
0.3%
Rent to Value Ratio
Active
$3,099,000
2
bds
|
3
ba
|
1,461
sqft
|
built
2008
4391 Collins Ave, Miami Beach, FL 33140
$-16,323
Cash flow
-27.5%
Cash-on-Cash Return
-0.2%
Cap rate
0.2%
Rent to Value Ratio