Miami Beach, FL Investment Properties for Sale
Browse homes for sale and investment properties in Miami Beach, FL. Refine your search by price, property type, or more.
Best cash flowing properties in Miami Beach, FL
Active
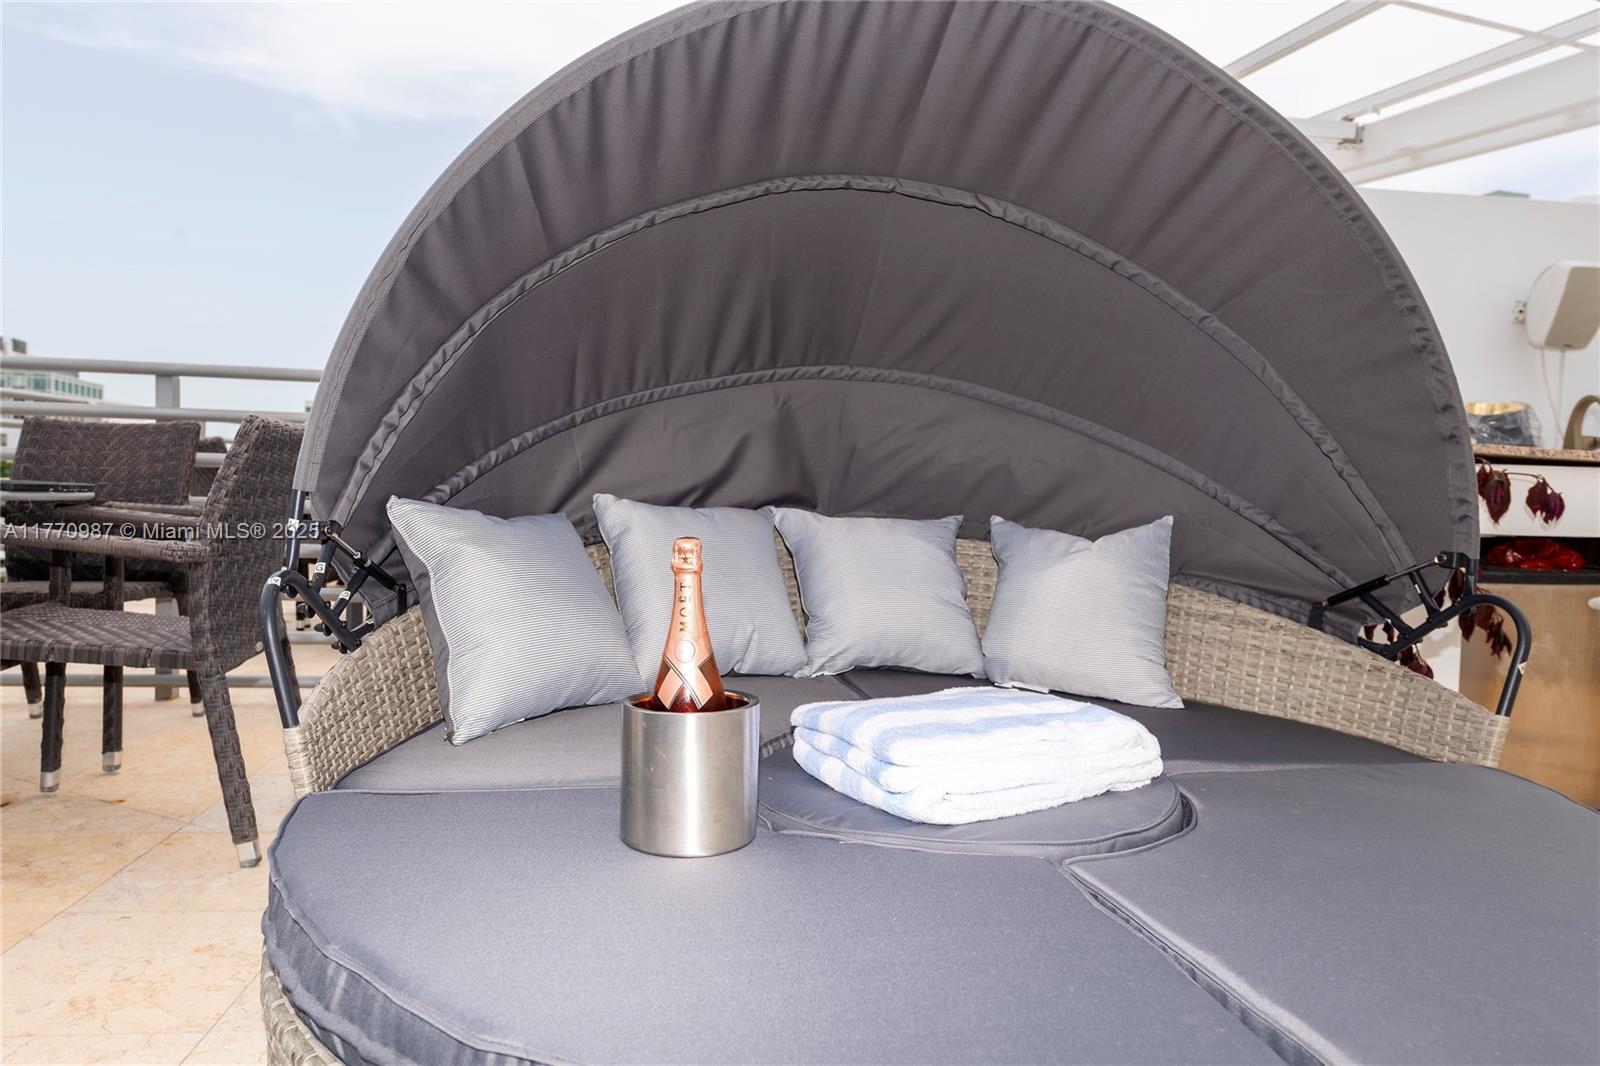
$499,000
bds
|
1
ba
|
500
sqft
|
built
2006
1437 Collins Ave, Miami Beach, FL 33139
n/a
Cash flow
n/a
Cash-on-Cash Return
n/a
Cap rate
n/a
Rent to Value Ratio
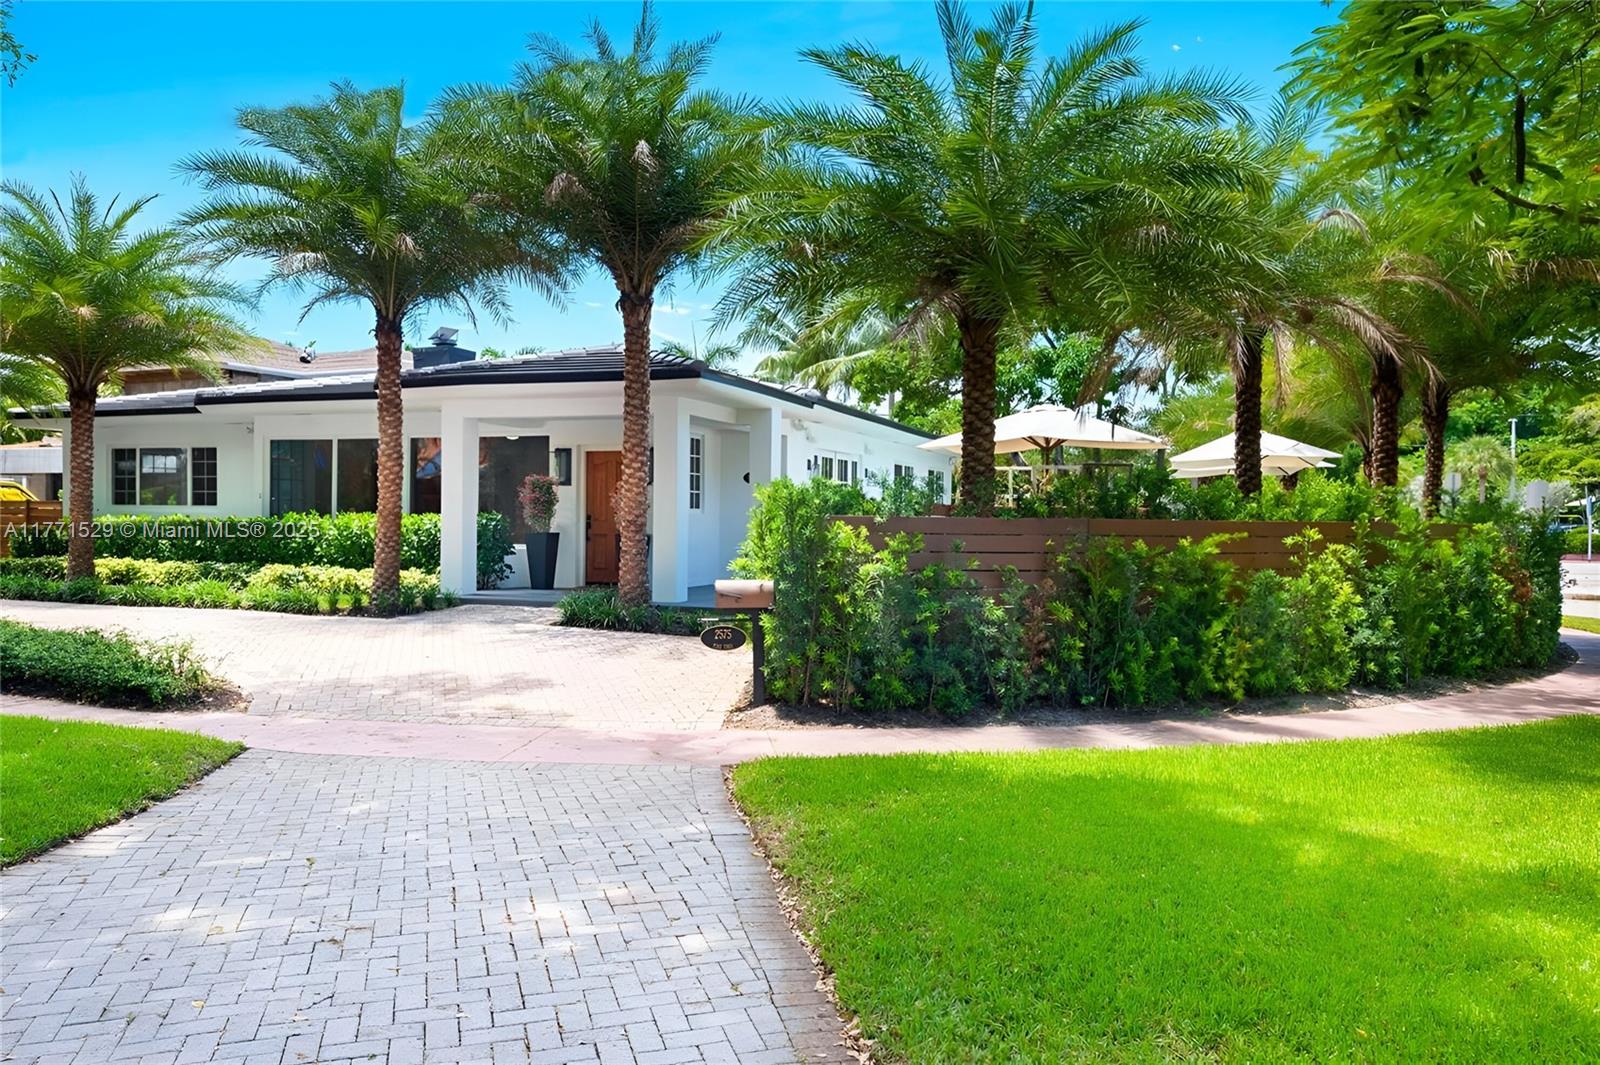
Active
$4,150,000
3
bds
|
3
ba
|
2,761
sqft
|
built
1950
2575 Pine Tree Dr, Miami Beach, FL 33140
n/a
Cash flow
n/a
Cash-on-Cash Return
n/a
Cap rate
n/a
Rent to Value Ratio
1,961 out of 2,163 properties for sale in Miami Beach, FL
Limited Results Shown
Create a free account, or log in to reveal all property listings and enjoy the complete experience.
Active
$230,000
bds
|
1
ba
|
538
sqft
|
built
1938
1611 Michigan Ave, Miami Beach, FL 33139
$-822
Cash flow
-18.6%
Cash-on-Cash Return
2.0%
Cap rate
0.8%
Rent to Value Ratio
Active
$10,500,000
6
bds
|
5
ba
|
4,508
sqft
|
built
1948
6675 Roxbury Ln, Miami Beach, FL 33141
$-55,847
Cash flow
-27.8%
Cash-on-Cash Return
-0.1%
Cap rate
0.1%
Rent to Value Ratio
Active
$345,000
1
bds
|
1
ba
|
550
sqft
|
built
1965
100 Lincoln Rd, Miami Beach, FL 33139
$-1,073
Cash flow
-16.2%
Cash-on-Cash Return
2.6%
Cap rate
0.8%
Rent to Value Ratio
Active
$269,000
1
bds
|
1
ba
|
535
sqft
|
built
1951
900 Meridian Ave, Miami Beach, FL 33139
$-713
Cash flow
-13.8%
Cash-on-Cash Return
3.1%
Cap rate
0.7%
Rent to Value Ratio

Active
$265,000
1
bds
|
1
ba
|
674
sqft
|
built
1949
1616 Euclid Ave, Miami Beach, FL 33139
$-689
Cash flow
-13.6%
Cash-on-Cash Return
3.2%
Cap rate
0.9%
Rent to Value Ratio
Active
$330,000
1
bds
|
1
ba
|
898
sqft
|
built
1970
401 69th St, Miami Beach, FL 33141
$-1,175
Cash flow
-18.6%
Cash-on-Cash Return
2.0%
Cap rate
0.8%
Rent to Value Ratio

Active
$2,690,000
5
bds
|
5
ba
|
4,232
sqft
|
built
1926
5208 Alton Rd, Miami Beach, FL 33140
$-12,093
Cash flow
-23.5%
Cash-on-Cash Return
0.9%
Cap rate
0.2%
Rent to Value Ratio
Active
$339,000
2
bds
|
2
ba
|
1,021
sqft
|
built
1953
7712 Byron Ave, Miami Beach, FL 33141
$-505
Cash flow
-7.8%
Cash-on-Cash Return
4.5%
Cap rate
0.7%
Rent to Value Ratio
Active
$1,150,000
2
bds
|
2
ba
|
1,180
sqft
|
built
1980
1623 Collins Ave, Miami Beach, FL 33139
$-4,630
Cash flow
-21.0%
Cash-on-Cash Return
1.5%
Cap rate
0.5%
Rent to Value Ratio

Active
$425,000
2
bds
|
3
ba
|
930
sqft
|
built
1925
1027 Pennsylvania Ave, Miami Beach, FL 33139
$-1,714
Cash flow
-21.0%
Cash-on-Cash Return
1.4%
Cap rate
0.6%
Rent to Value Ratio
Active
$325,000
0
bds
|
1
ba
|
376
sqft
|
built
1937
420 15th St, Miami Beach, FL 33139
$-1,049
Cash flow
-16.8%
Cash-on-Cash Return
2.4%
Cap rate
0.7%
Rent to Value Ratio
Active
$325,000
0
bds
|
1
ba
|
376
sqft
|
built
1937
420 15th St, Miami Beach, FL 33139
$-1,049
Cash flow
-16.8%
Cash-on-Cash Return
2.4%
Cap rate
0.7%
Rent to Value Ratio
Active
$1,100,000
2
bds
|
2
ba
|
1,805
sqft
|
built
1976
6423 Collins Ave, Miami Beach, FL 33141
$-4,821
Cash flow
-22.9%
Cash-on-Cash Return
1.0%
Cap rate
0.5%
Rent to Value Ratio
Active
$320,000
1
bds
|
1
ba
|
740
sqft
|
built
1957
653 Michigan Ave, Miami Beach, FL 33139
$-939
Cash flow
-15.3%
Cash-on-Cash Return
2.8%
Cap rate
0.9%
Rent to Value Ratio
Active
$439,000
2
bds
|
2
ba
|
983
sqft
|
built
1979
1035 West Ave, Miami Beach, FL 33139
$-1,392
Cash flow
-16.5%
Cash-on-Cash Return
2.5%
Cap rate
0.7%
Rent to Value Ratio
Active
$675,000
2
bds
|
2
ba
|
1,031
sqft
|
built
1969
5701 Collins Ave, Miami Beach, FL 33140
$-3,389
Cash flow
-26.2%
Cash-on-Cash Return
0.3%
Cap rate
0.6%
Rent to Value Ratio
Active
$789,000
2
bds
|
2
ba
|
1,455
sqft
|
built
1970
7135 Collins Ave, Miami Beach, FL 33141
$-2,475
Cash flow
-16.4%
Cash-on-Cash Return
2.5%
Cap rate
0.7%
Rent to Value Ratio
Active
$320,000
1
bds
|
2
ba
|
855
sqft
|
built
1970
5838 Collins Ave, Miami Beach, FL 33140
$-1,096
Cash flow
-17.9%
Cash-on-Cash Return
2.2%
Cap rate
0.9%
Rent to Value Ratio
Active
$295,000
1
bds
|
1
ba
|
710
sqft
|
built
1939
1009 Meridian Ave, Miami Beach, FL 33139
$-1,394
Cash flow
-24.7%
Cash-on-Cash Return
0.6%
Cap rate
0.8%
Rent to Value Ratio

Active
$1,550,000
2
bds
|
2
ba
|
1,322
sqft
|
built
2004
6365 Collins Ave, Miami Beach, FL 33141
$-4,824
Cash flow
-16.2%
Cash-on-Cash Return
2.5%
Cap rate
0.6%
Rent to Value Ratio
Active
$285,000
2
bds
|
2
ba
|
798
sqft
|
built
1970
1990 Marseille Dr, Miami Beach, FL 33141
$-725
Cash flow
-13.3%
Cash-on-Cash Return
3.2%
Cap rate
0.9%
Rent to Value Ratio
Active
$599,900
2
bds
|
2
ba
|
1,190
sqft
|
built
1967
5600 Collins Ave, Miami Beach, FL 33140
$-692
Cash flow
-6.0%
Cash-on-Cash Return
4.9%
Cap rate
0.7%
Rent to Value Ratio

Active
$3,895,000
2
bds
|
3
ba
|
1,778
sqft
|
built
2024
501 West Ave, Miami Beach, FL 33139
n/a
Cash flow
n/a
Cash-on-Cash Return
n/a
Cap rate
n/a
Rent to Value Ratio
Active
$3,199,000
4
bds
|
4
ba
|
2,790
sqft
|
built
1997
1415 20th St, Miami Beach, FL 33139
$-14,803
Cash flow
-24.1%
Cash-on-Cash Return
0.7%
Cap rate
0.3%
Rent to Value Ratio
Active
$1,495,000
1
bds
|
2
ba
|
960
sqft
|
built
1926
2301 Collins Ave, Miami Beach, FL 33139
$-6,701
Cash flow
-23.4%
Cash-on-Cash Return
0.9%
Cap rate
0.4%
Rent to Value Ratio
Active
$765,000
2
bds
|
2
ba
|
1,140
sqft
|
built
1967
5401 Collins Ave, Miami Beach, FL 33140
$-3,279
Cash flow
-22.4%
Cash-on-Cash Return
1.1%
Cap rate
0.6%
Rent to Value Ratio
Active
$349,000
1
bds
|
1
ba
|
511
sqft
|
built
2022
1610 Euclid Ave, Miami Beach, FL 33139
$-939
Cash flow
-14.0%
Cash-on-Cash Return
3.1%
Cap rate
0.7%
Rent to Value Ratio
Active
$315,000
2
bds
|
1
ba
|
690
sqft
|
built
1935
1008 Jefferson Ave, Miami Beach, FL 33139
$-916
Cash flow
-15.2%
Cash-on-Cash Return
2.8%
Cap rate
0.8%
Rent to Value Ratio
Active
$789,000
2
bds
|
2
ba
|
1,540
sqft
|
built
1963
900 Bay Dr, Miami Beach, FL 33141
$-3,544
Cash flow
-23.4%
Cash-on-Cash Return
0.9%
Cap rate
0.6%
Rent to Value Ratio

Active
$5,450,000
2
bds
|
3
ba
|
1,791
sqft
|
built
2003
100 S Pointe Dr, Miami Beach, FL 33139
$-34,791
Cash flow
-33.3%
Cash-on-Cash Return
-1.4%
Cap rate
0.1%
Rent to Value Ratio
Active
$305,000
2
bds
|
1
ba
|
608
sqft
|
built
2015
801 8th St, Miami Beach, FL 33139
$-936
Cash flow
-16.0%
Cash-on-Cash Return
2.6%
Cap rate
0.9%
Rent to Value Ratio

Active
$882,000
bds
|
1
ba
|
521
sqft
|
built
2008
4391 Collins Ave, Miami Beach, FL 33140
$-3,360
Cash flow
-19.9%
Cash-on-Cash Return
1.7%
Cap rate
0.5%
Rent to Value Ratio
Active
$900,000
bds
|
1
ba
|
554
sqft
|
built
2008
4391 Collins Ave, Miami Beach, FL 33140
$-3,411
Cash flow
-19.8%
Cash-on-Cash Return
1.7%
Cap rate
0.5%
Rent to Value Ratio
Active
$25,000,000
4
bds
|
4
ba
|
3,047
sqft
|
built
1950
851 N Venetian Dr, Miami Beach, FL 33139
$-145,578
Cash flow
-30.4%
Cash-on-Cash Return
-0.7%
Cap rate
0.0%
Rent to Value Ratio
Active
$575,000
1
bds
|
2
ba
|
1,190
sqft
|
built
1973
2655 Collins Ave, Miami Beach, FL 33140
$-2,026
Cash flow
-18.4%
Cash-on-Cash Return
2.1%
Cap rate
0.6%
Rent to Value Ratio
Active
$499,000
bds
|
2
ba
|
500
sqft
|
built
2006
1437 Collins Ave, Miami Beach, FL 33139
n/a
Cash flow
n/a
Cash-on-Cash Return
n/a
Cap rate
n/a
Rent to Value Ratio
Active
$2,750,000
6
bds
|
0
ba
|
3,952
sqft
|
built
1950
1471 Lincoln Ter, Miami Beach, FL 33139
$-14,352
Cash flow
-27.2%
Cash-on-Cash Return
0.0%
Cap rate
0.1%
Rent to Value Ratio
Active
$4,150,000
3
bds
|
3
ba
|
2,761
sqft
|
built
1950
2575 Pine Tree Dr, Miami Beach, FL 33140
n/a
Cash flow
n/a
Cash-on-Cash Return
n/a
Cap rate
n/a
Rent to Value Ratio
Active
$499,000
bds
|
1
ba
|
500
sqft
|
built
2006
1437 Collins Ave, Miami Beach, FL 33139
n/a
Cash flow
n/a
Cash-on-Cash Return
n/a
Cap rate
n/a
Rent to Value Ratio

Active
$215,000
1
bds
|
1
ba
|
446
sqft
|
built
1938
1611 Michigan Ave, Miami Beach, FL 33139
$-653
Cash flow
-15.8%
Cash-on-Cash Return
2.6%
Cap rate
0.8%
Rent to Value Ratio