Miami Beach, FL Investment Properties for Sale
Browse homes for sale and investment properties in Miami Beach, FL. Refine your search by price, property type, or more.
Best cash flowing properties in Miami Beach, FL
Active
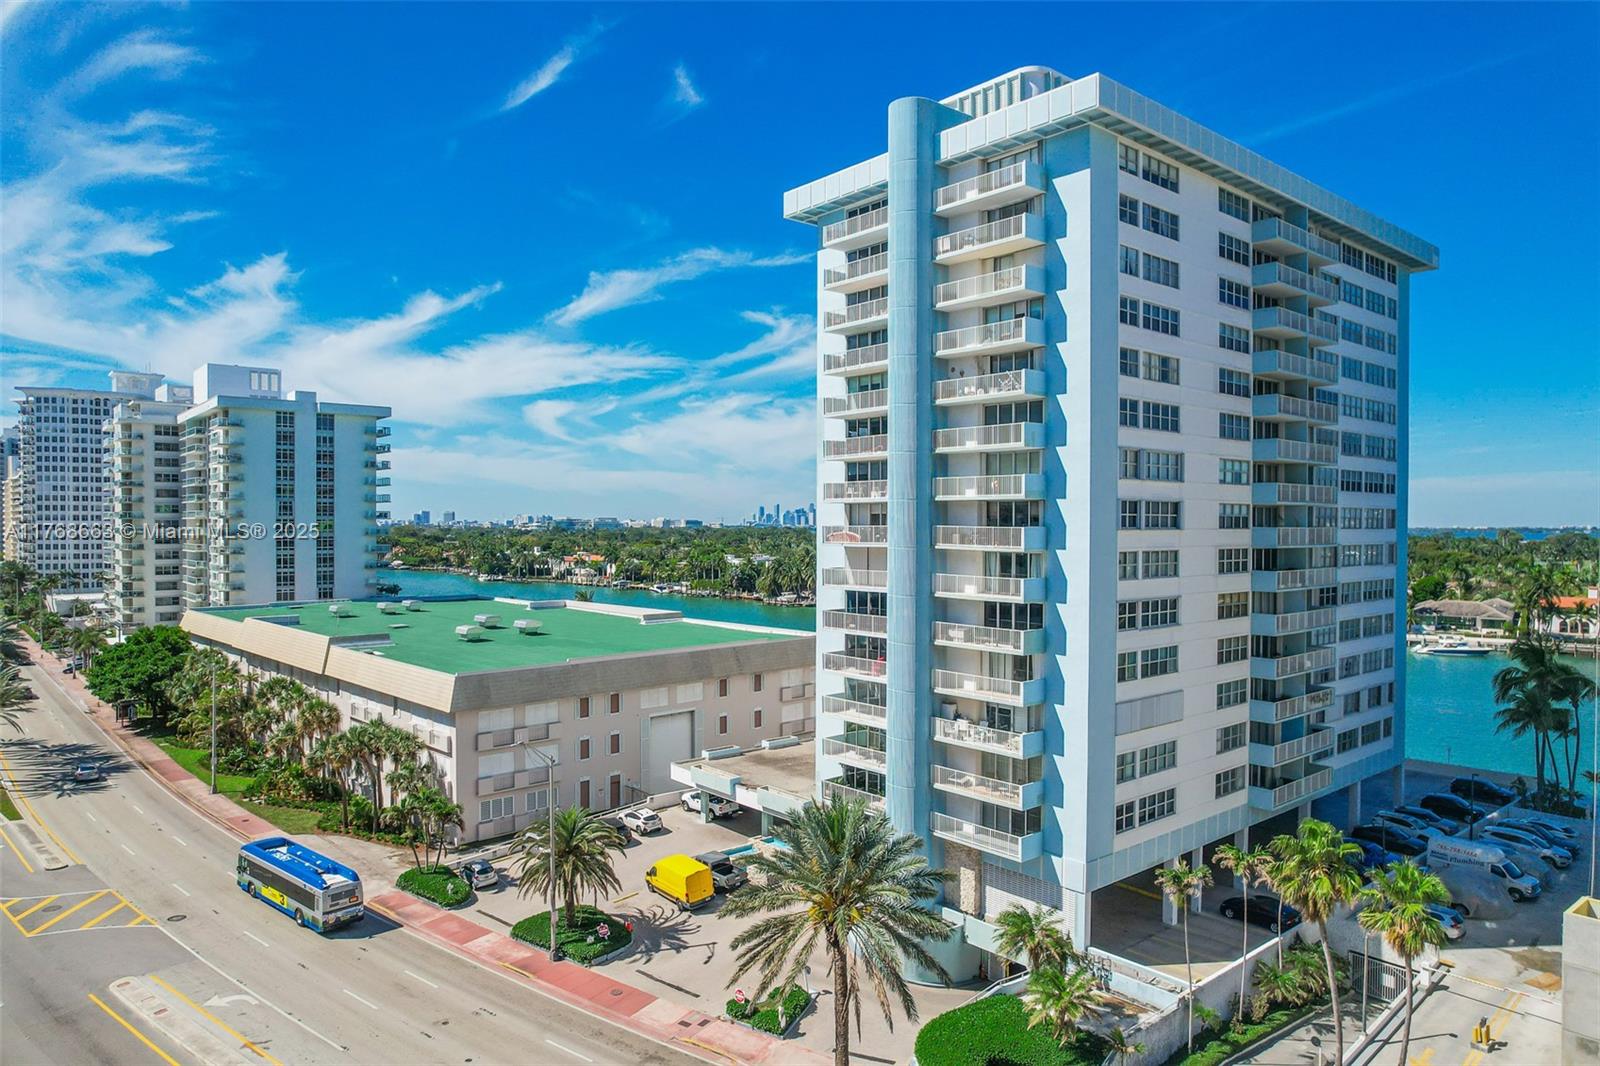
$248,000
1
bds
|
1
ba
|
602
sqft
|
built
1990
4021 Indian Creek Dr, Miami Beach, FL 33140
$-217
Cash flow
-4.6%
Cash-on-Cash Return
5.2%
Cap rate
0.8%
Rent to Value Ratio
Active
$285,000
1
bds
|
1
ba
|
658
sqft
|
built
1977
1615 Meridian Ave, Miami Beach, FL 33139
$-231
Cash flow
-4.2%
Cash-on-Cash Return
5.3%
Cap rate
0.8%
Rent to Value Ratio
1,950 out of 2,150 properties for sale in Miami Beach, FL
Limited Results Shown
Create a free account, or log in to reveal all property listings and enjoy the complete experience.
Active
$519,000
2
bds
|
2
ba
|
1,040
sqft
|
built
1966
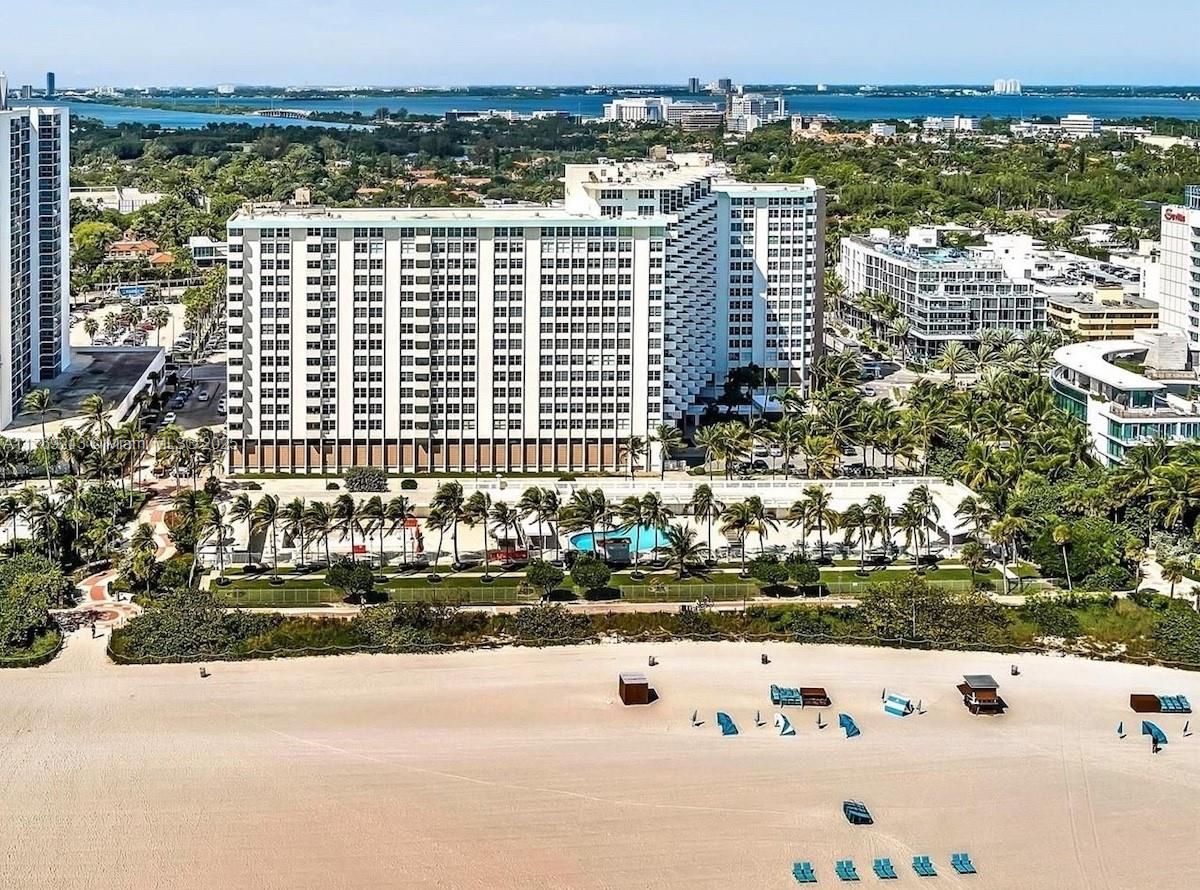
5161 Collins Ave, Miami Beach, FL 33140
$-2,058
Cash flow
-20.7%
Cash-on-Cash Return
1.5%
Cap rate
0.7%
Rent to Value Ratio

Active
$165,000
bds
|
1
ba
|
394
sqft
|
built
1940
7928 Harding Ave, Miami Beach, FL 33141
$-464
Cash flow
-14.7%
Cash-on-Cash Return
2.9%
Cap rate
0.8%
Rent to Value Ratio
Active
$626,000
2
bds
|
2
ba
|
950
sqft
|
built
1998
5900 Collins Ave, Miami Beach, FL 33140
$-2,191
Cash flow
-18.3%
Cash-on-Cash Return
2.1%
Cap rate
0.7%
Rent to Value Ratio
Active
$1,225,000
4
bds
|
3
ba
|
2,005
sqft
|
built
1945
1460 Marseille Dr, Miami Beach, FL 33141
$-1,446
Cash flow
-6.2%
Cash-on-Cash Return
4.9%
Cap rate
0.7%
Rent to Value Ratio
Active
$950,000
2
bds
|
3
ba
|
2,534
sqft
|
built
1963
5255 Collins Ave, Miami Beach, FL 33140
$-6,685
Cash flow
-36.7%
Cash-on-Cash Return
-2.2%
Cap rate
0.5%
Rent to Value Ratio
Active
$750,000
2
bds
|
2
ba
|
1,134
sqft
|
built
1962
4747 Collins Ave, Miami Beach, FL 33140
$-3,437
Cash flow
-23.9%
Cash-on-Cash Return
0.8%
Cap rate
0.5%
Rent to Value Ratio
Active
$875,000
bds
|
1
ba
|
491
sqft
|
built
2005
4401 Collins Ave, Miami Beach, FL 33140
$-3,718
Cash flow
-22.2%
Cash-on-Cash Return
1.2%
Cap rate
0.4%
Rent to Value Ratio

Active
$1,450,000
1
bds
|
2
ba
|
1,066
sqft
|
built
2005
4401 Collins Ave, Miami Beach, FL 33140
$-6,829
Cash flow
-24.6%
Cash-on-Cash Return
0.6%
Cap rate
0.4%
Rent to Value Ratio
Active
$2,990,000
3
bds
|
3
ba
|
2,114
sqft
|
built
1930
6166 Pine Tree Dr, Miami Beach, FL 33140
$-10,376
Cash flow
-18.1%
Cash-on-Cash Return
2.1%
Cap rate
0.3%
Rent to Value Ratio
Active
$330,000
bds
|
1
ba
|
511
sqft
|
built
1964
1024 Ocean Dr, Miami Beach, FL 33139
$-1,790
Cash flow
-28.3%
Cash-on-Cash Return
-0.2%
Cap rate
0.9%
Rent to Value Ratio
Active
$1,150,000
3
bds
|
4
ba
|
2,868
sqft
|
built
1974
5500 Collins Ave, Miami Beach, FL 33140
$-4,734
Cash flow
-21.5%
Cash-on-Cash Return
1.3%
Cap rate
0.8%
Rent to Value Ratio
Active
$749,000
1
bds
|
2
ba
|
966
sqft
|
built
2005
2001 Meridian Ave, Miami Beach, FL 33139
$-2,829
Cash flow
-19.7%
Cash-on-Cash Return
1.8%
Cap rate
0.6%
Rent to Value Ratio
Active
$285,000
1
bds
|
1
ba
|
658
sqft
|
built
1977
1615 Meridian Ave, Miami Beach, FL 33139
$-231
Cash flow
-4.2%
Cash-on-Cash Return
5.3%
Cap rate
0.8%
Rent to Value Ratio
Active
$1,599,000
1
bds
|
2
ba
|
960
sqft
|
built
1926
2301 Collins Ave, Miami Beach, FL 33139
$-4,620
Cash flow
-15.1%
Cash-on-Cash Return
2.8%
Cap rate
0.6%
Rent to Value Ratio
Active
$3,875,000
2
bds
|
2
ba
|
1,543
sqft
|
built
2009
2201 Collins Ave, Miami Beach, FL 33139
$-29,215
Cash flow
-39.3%
Cash-on-Cash Return
-2.8%
Cap rate
0.2%
Rent to Value Ratio
Active
$2,550,000
1
bds
|
2
ba
|
821
sqft
|
built
2004
101 20th St, Miami Beach, FL 33139
$-15,658
Cash flow
-32.0%
Cash-on-Cash Return
-1.1%
Cap rate
0.2%
Rent to Value Ratio
Active
$24,900,000
4
bds
|
4
ba
|
3,605
sqft
|
built
2010
921 N Venetian Dr, Miami Beach, FL 33139
$-136,851
Cash flow
-28.7%
Cash-on-Cash Return
-0.3%
Cap rate
0.0%
Rent to Value Ratio
Active
$799,000
bds
|
1
ba
|
660
sqft
|
built
1926
2301 Collins Ave, Miami Beach, FL 33139
$-584
Cash flow
-3.8%
Cash-on-Cash Return
5.4%
Cap rate
1.0%
Rent to Value Ratio
Active
$255,000
2
bds
|
1
ba
|
592
sqft
|
built
1949
8340 Crespi Blvd, Miami Beach, FL 33141
$-1,075
Cash flow
-22.0%
Cash-on-Cash Return
1.2%
Cap rate
0.7%
Rent to Value Ratio
Active
$1,499,000
1
bds
|
1
ba
|
900
sqft
|
built
1926
2301 Collins Ave, Miami Beach, FL 33139
$-2,910
Cash flow
-10.1%
Cash-on-Cash Return
4.0%
Cap rate
0.8%
Rent to Value Ratio

Active
$26,900,000
6
bds
|
7
ba
|
6,096
sqft
|
built
1957
1500 W 23rd St, Miami Beach, FL 33140
$-139,393
Cash flow
-27.0%
Cash-on-Cash Return
0.1%
Cap rate
0.0%
Rent to Value Ratio
Active
$1,300,000
4
bds
|
2
ba
|
1,630
sqft
|
built
1940
1915 Normandy Dr, Miami Beach, FL 33141
$-5,362
Cash flow
-21.5%
Cash-on-Cash Return
1.3%
Cap rate
0.3%
Rent to Value Ratio

Active
$1,379,000
2
bds
|
2
ba
|
1,384
sqft
|
built
2001
1330 West Ave, Miami Beach, FL 33139
$-4,246
Cash flow
-16.1%
Cash-on-Cash Return
2.6%
Cap rate
0.4%
Rent to Value Ratio
Active
$248,000
1
bds
|
1
ba
|
602
sqft
|
built
1990
4021 Indian Creek Dr, Miami Beach, FL 33140
$-217
Cash flow
-4.6%
Cash-on-Cash Return
5.2%
Cap rate
0.8%
Rent to Value Ratio
Active
$1,869,000
3
bds
|
3
ba
|
1,690
sqft
|
built
1996
6301 Collins Ave, Miami Beach, FL 33141
$-7,942
Cash flow
-22.2%
Cash-on-Cash Return
1.2%
Cap rate
0.5%
Rent to Value Ratio
Active
$1,025,000
2
bds
|
2
ba
|
1,477
sqft
|
built
1981
9 Island Ave, Miami Beach, FL 33139
$-3,205
Cash flow
-16.3%
Cash-on-Cash Return
2.5%
Cap rate
0.7%
Rent to Value Ratio
Active
$11,900,000
5
bds
|
6
ba
|
4,365
sqft
|
built
1968
6626 Pinetree Ln, Miami Beach, FL 33141
$-63,192
Cash flow
-27.7%
Cash-on-Cash Return
-0.1%
Cap rate
0.1%
Rent to Value Ratio
Active
$440,000
1
bds
|
1
ba
|
847
sqft
|
built
1969
1340 Lincoln Rd, Miami Beach, FL 33139
$-966
Cash flow
-11.5%
Cash-on-Cash Return
3.6%
Cap rate
0.6%
Rent to Value Ratio
Active
$451,050
1
bds
|
1
ba
|
726
sqft
|
built
1966
2899 Collins Ave, Miami Beach, FL 33140
$-1,264
Cash flow
-14.6%
Cash-on-Cash Return
2.9%
Cap rate
0.7%
Rent to Value Ratio
Active
$2,190,000
4
bds
|
4
ba
|
2,970
sqft
|
built
1987
1556 71st St, Miami Beach, FL 33141
$-6,656
Cash flow
-15.9%
Cash-on-Cash Return
2.6%
Cap rate
0.5%
Rent to Value Ratio
Active
$429,000
1
bds
|
2
ba
|
855
sqft
|
built
1970
5838 Collins Ave, Miami Beach, FL 33140
$-1,503
Cash flow
-18.3%
Cash-on-Cash Return
2.1%
Cap rate
0.7%
Rent to Value Ratio
Active
$665,000
2
bds
|
2
ba
|
1,326
sqft
|
built
1968
6770 Indian Creek Dr, Miami Beach, FL 33141
$-2,569
Cash flow
-20.2%
Cash-on-Cash Return
1.6%
Cap rate
0.7%
Rent to Value Ratio
Active
$490,000
1
bds
|
1
ba
|
837
sqft
|
built
1965
1200 West Ave, Miami Beach, FL 33139
$-601
Cash flow
-6.4%
Cash-on-Cash Return
4.8%
Cap rate
0.7%
Rent to Value Ratio
Active
$2,130,000
2
bds
|
2
ba
|
1,649
sqft
|
built
2003
400 Alton Rd, Miami Beach, FL 33139
$-8,927
Cash flow
-21.9%
Cash-on-Cash Return
1.3%
Cap rate
0.4%
Rent to Value Ratio
Pending
$2,399,000
2
bds
|
3
ba
|
2,040
sqft
|
built
1996
300 S Pointe Dr, Miami Beach, FL 33139
$-12,537
Cash flow
-27.3%
Cash-on-Cash Return
0.0%
Cap rate
0.4%
Rent to Value Ratio
Active
$365,000
2
bds
|
1
ba
|
740
sqft
|
built
1970
716 Michigan Ave, Miami Beach, FL 33139
$-1,321
Cash flow
-18.9%
Cash-on-Cash Return
1.9%
Cap rate
0.6%
Rent to Value Ratio
Active
$590,000
1
bds
|
1
ba
|
1,011
sqft
|
built
2010
6000 Collins Ave, Miami Beach, FL 33140
$-2,256
Cash flow
-19.9%
Cash-on-Cash Return
1.7%
Cap rate
0.6%
Rent to Value Ratio
Active
$7,575,000
3
bds
|
4
ba
|
2,704
sqft
|
built
2015
321 Ocean Dr, Miami Beach, FL 33139
$-48,632
Cash flow
-33.5%
Cash-on-Cash Return
-1.4%
Cap rate
0.1%
Rent to Value Ratio
Active
$2,650,000
2
bds
|
3
ba
|
1,933
sqft
|
built
2005
450 Alton Rd, Miami Beach, FL 33139
$-14,796
Cash flow
-29.1%
Cash-on-Cash Return
-0.4%
Cap rate
0.3%
Rent to Value Ratio
Active
$235,000
bds
|
1
ba
|
431
sqft
|
built
1957
745 13th St, Miami Beach, FL 33139
$-802
Cash flow
-17.8%
Cash-on-Cash Return
2.2%
Cap rate
0.8%
Rent to Value Ratio