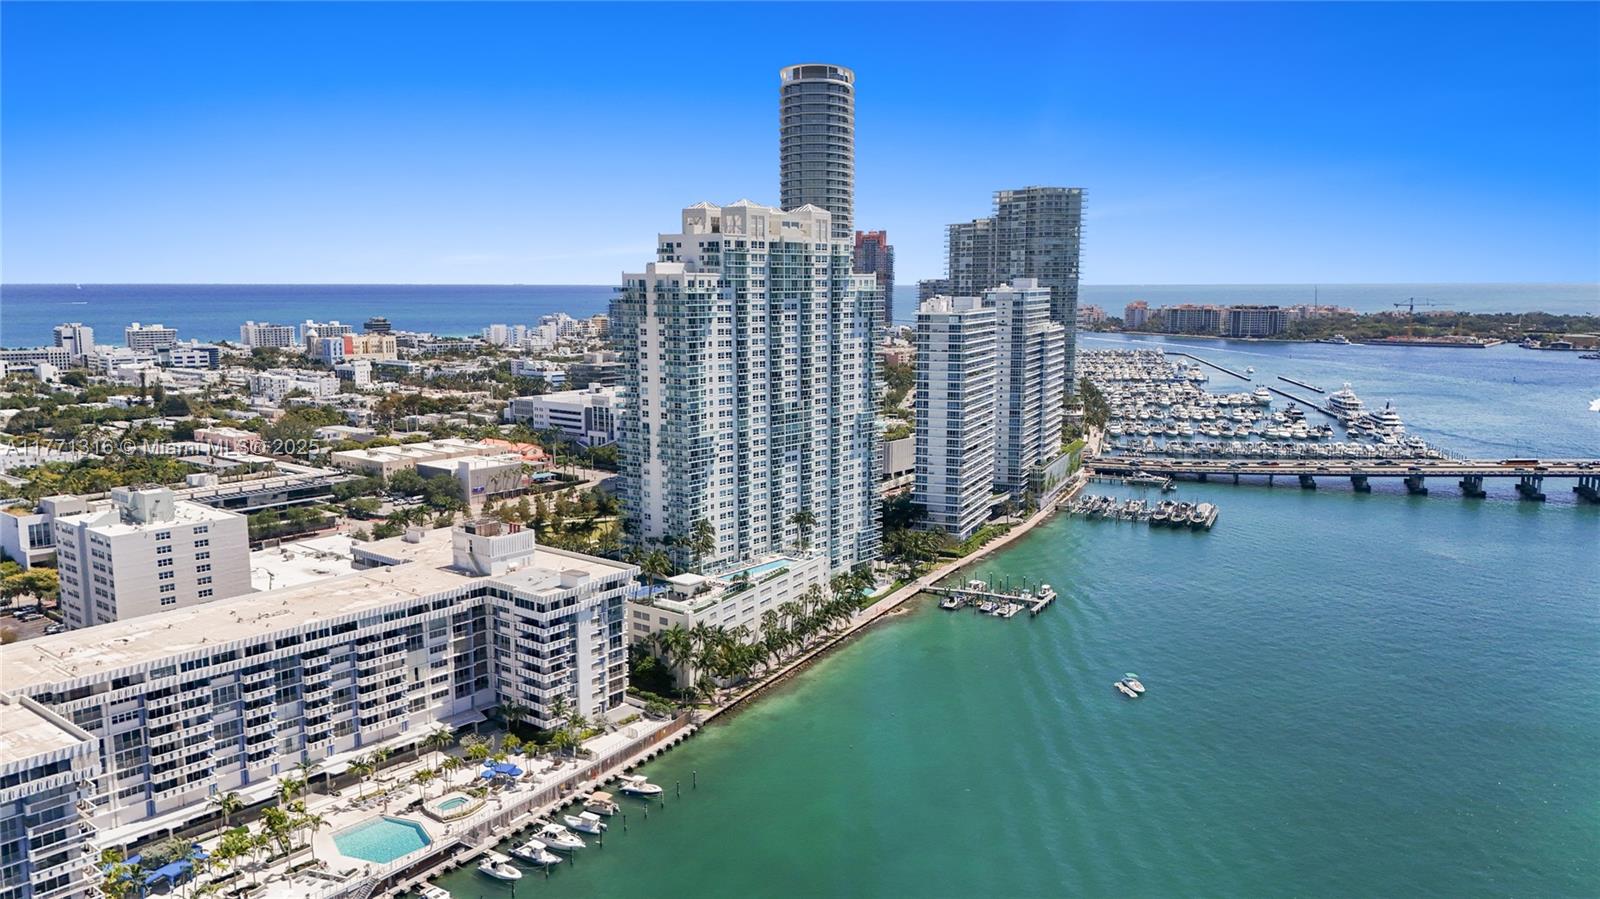
Miami Beach, FL Investment Properties for Sale
Browse homes for sale and investment properties in Miami Beach, FL. Refine your search by price, property type, or more.
Best cash flowing properties in Miami Beach, FL

Active
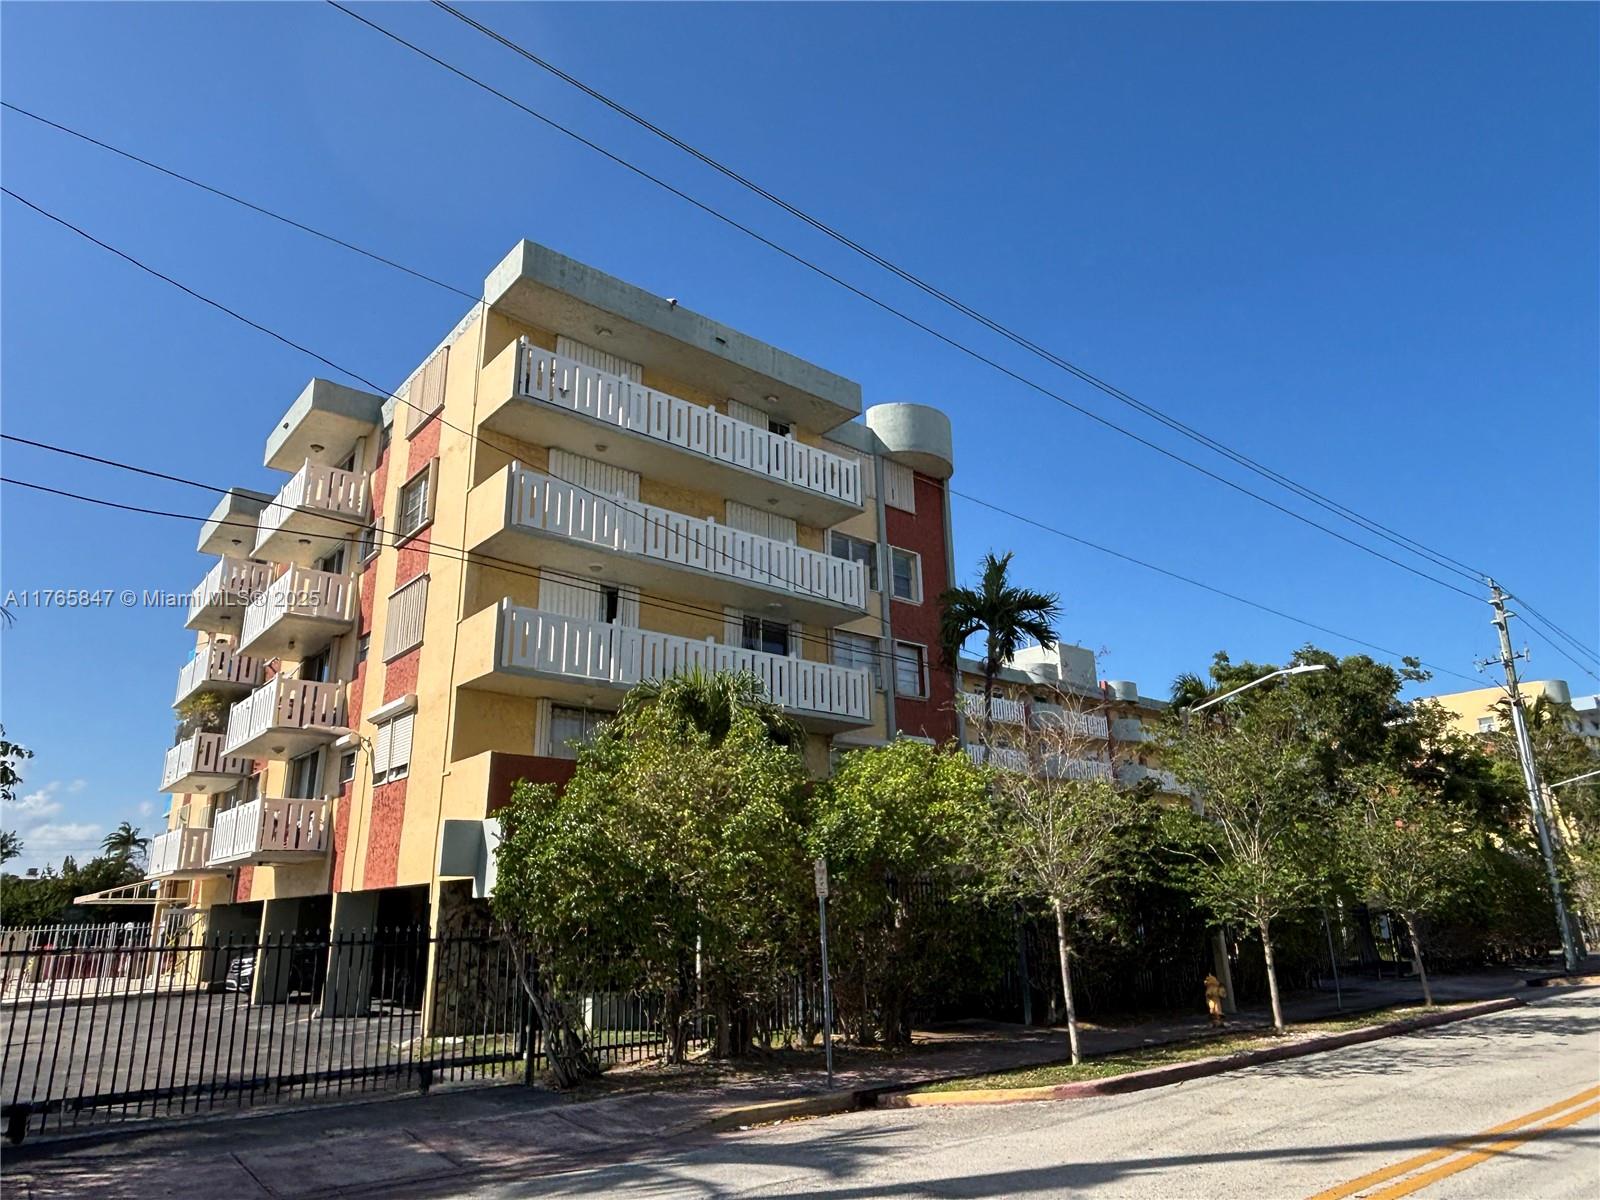
$298,000
1
bds
|
1
ba
|
606
sqft
|
built
1925
1521 Lenox Ave, Miami Beach, FL 33139
$-364
Cash flow
-6.4%
Cash-on-Cash Return
4.8%
Cap rate
0.7%
Rent to Value Ratio
Active
$235,000
1
bds
|
2
ba
|
799
sqft
|
built
1973
7900 Tatum Waterway Dr, Miami Beach, FL 33141
$-442
Cash flow
-9.8%
Cash-on-Cash Return
4.0%
Cap rate
1.0%
Rent to Value Ratio
1,961 out of 2,163 properties for sale in Miami Beach, FL
Limited Results Shown
Create a free account, or log in to reveal all property listings and enjoy the complete experience.
Active
$7,575,000
3
bds
|
4
ba
|
2,704
sqft
|
built
2015
321 Ocean Dr, Miami Beach, FL 33139
$-48,632
Cash flow
-33.5%
Cash-on-Cash Return
-1.4%
Cap rate
0.1%
Rent to Value Ratio
Active
$2,650,000
2
bds
|
3
ba
|
1,933
sqft
|
built
2005
450 Alton Rd, Miami Beach, FL 33139
$-14,796
Cash flow
-29.1%
Cash-on-Cash Return
-0.4%
Cap rate
0.3%
Rent to Value Ratio
Active
$235,000
bds
|
1
ba
|
431
sqft
|
built
1957
745 13th St, Miami Beach, FL 33139
$-802
Cash flow
-17.8%
Cash-on-Cash Return
2.2%
Cap rate
0.8%
Rent to Value Ratio
Active
$799,900
2
bds
|
3
ba
|
2,425
sqft
|
built
1963
5255 Collins Ave, Miami Beach, FL 33140
$-6,494
Cash flow
-42.4%
Cash-on-Cash Return
-3.5%
Cap rate
0.4%
Rent to Value Ratio
Active
$495,000
1
bds
|
2
ba
|
990
sqft
|
built
1965
1200 West Ave, Miami Beach, FL 33139
$-2,095
Cash flow
-22.1%
Cash-on-Cash Return
1.2%
Cap rate
0.7%
Rent to Value Ratio
Active
$469,000
2
bds
|
2
ba
|
700
sqft
|
built
1931
750 Pennsylvania Ave, Miami Beach, FL 33139
$-1,693
Cash flow
-18.8%
Cash-on-Cash Return
2.0%
Cap rate
0.5%
Rent to Value Ratio
Active
$399,000
bds
|
1
ba
|
380
sqft
|
built
1966
5445 Collins Ave, Miami Beach, FL 33140
$-2,156
Cash flow
-28.2%
Cash-on-Cash Return
-0.2%
Cap rate
0.5%
Rent to Value Ratio
Active
$1,999,990
2
bds
|
2
ba
|
1,230
sqft
|
built
1926
2301 Collins Ave, Miami Beach, FL 33139
$-8,513
Cash flow
-22.2%
Cash-on-Cash Return
1.2%
Cap rate
0.3%
Rent to Value Ratio
Active
$180,000
bds
|
1
ba
|
475
sqft
|
built
1939
500 14th St, Miami Beach, FL 33139
$-478
Cash flow
-13.9%
Cash-on-Cash Return
3.1%
Cap rate
0.9%
Rent to Value Ratio

Active
$318,000
1
bds
|
1
ba
|
634
sqft
|
built
1925
1218 Drexel Ave, Miami Beach, FL 33139
$-981
Cash flow
-16.1%
Cash-on-Cash Return
2.6%
Cap rate
0.7%
Rent to Value Ratio
Active
$685,000
1
bds
|
1
ba
|
897
sqft
|
built
1962
20 Island Ave, Miami Beach, FL 33139
$-2,290
Cash flow
-17.4%
Cash-on-Cash Return
2.3%
Cap rate
0.7%
Rent to Value Ratio
Active
$899,999
2
bds
|
2
ba
|
1,410
sqft
|
built
1966
5161 Collins Ave, Miami Beach, FL 33140
$-4,121
Cash flow
-23.9%
Cash-on-Cash Return
0.8%
Cap rate
0.5%
Rent to Value Ratio
Active
$450,000
0
bds
|
1
ba
|
493
sqft
|
built
2008
1100 West Ave, Miami Beach, FL 33139
$-1,514
Cash flow
-17.6%
Cash-on-Cash Return
2.2%
Cap rate
0.9%
Rent to Value Ratio

Active
$7,000,000
7
bds
|
8
ba
|
5,016
sqft
|
built
2021
1250 N Venetian Way, Miami Beach, FL 33139
$-34,150
Cash flow
-25.5%
Cash-on-Cash Return
0.4%
Cap rate
0.1%
Rent to Value Ratio
Active
$888,000
0
bds
|
1
ba
|
538
sqft
|
built
2008
4391 Collins Ave, Miami Beach, FL 33140
$-3,542
Cash flow
-20.8%
Cash-on-Cash Return
1.5%
Cap rate
0.5%
Rent to Value Ratio
Active
$1,689,000
3
bds
|
3
ba
|
1,230
sqft
|
built
2013
6700 Indian Creek Dr, Miami Beach, FL 33141
$-7,356
Cash flow
-22.7%
Cash-on-Cash Return
1.1%
Cap rate
0.5%
Rent to Value Ratio
Active
$335,000
1
bds
|
2
ba
|
676
sqft
|
built
1971
6969 Collins Ave, Miami Beach, FL 33141
$-958
Cash flow
-14.9%
Cash-on-Cash Return
2.9%
Cap rate
0.7%
Rent to Value Ratio
Active
$235,000
1
bds
|
2
ba
|
799
sqft
|
built
1973
7900 Tatum Waterway Dr, Miami Beach, FL 33141
$-442
Cash flow
-9.8%
Cash-on-Cash Return
4.0%
Cap rate
1.0%
Rent to Value Ratio
Active
$220,000
bds
|
1
ba
|
447
sqft
|
built
1940
1021 Euclid Ave, Miami Beach, FL 33139
$-821
Cash flow
-19.5%
Cash-on-Cash Return
1.8%
Cap rate
0.8%
Rent to Value Ratio
Active
$298,000
1
bds
|
1
ba
|
606
sqft
|
built
1925
1521 Lenox Ave, Miami Beach, FL 33139
$-364
Cash flow
-6.4%
Cash-on-Cash Return
4.8%
Cap rate
0.7%
Rent to Value Ratio
Active
$399,000
2
bds
|
2
ba
|
983
sqft
|
built
1979
1035 West Ave, Miami Beach, FL 33139
$-1,707
Cash flow
-22.3%
Cash-on-Cash Return
1.1%
Cap rate
0.7%
Rent to Value Ratio

Active
$673,500
2
bds
|
2
ba
|
1,318
sqft
|
built
1979
8530 Byron Ave, Miami Beach, FL 33141
$-2,195
Cash flow
-17.0%
Cash-on-Cash Return
2.4%
Cap rate
0.5%
Rent to Value Ratio

Active
$195,000
0
bds
|
1
ba
|
422
sqft
|
built
1940
1021 Euclid Ave, Miami Beach, FL 33139
$-648
Cash flow
-17.3%
Cash-on-Cash Return
2.3%
Cap rate
0.9%
Rent to Value Ratio
Active
$195,000
bds
|
1
ba
|
410
sqft
|
built
1940
1021 Euclid Ave, Miami Beach, FL 33139
$-557
Cash flow
-14.9%
Cash-on-Cash Return
2.9%
Cap rate
0.9%
Rent to Value Ratio
Active
$329,000
1
bds
|
2
ba
|
864
sqft
|
built
1967
8233 Harding Ave, Miami Beach, FL 33141
$-1,047
Cash flow
-16.6%
Cash-on-Cash Return
2.5%
Cap rate
0.8%
Rent to Value Ratio
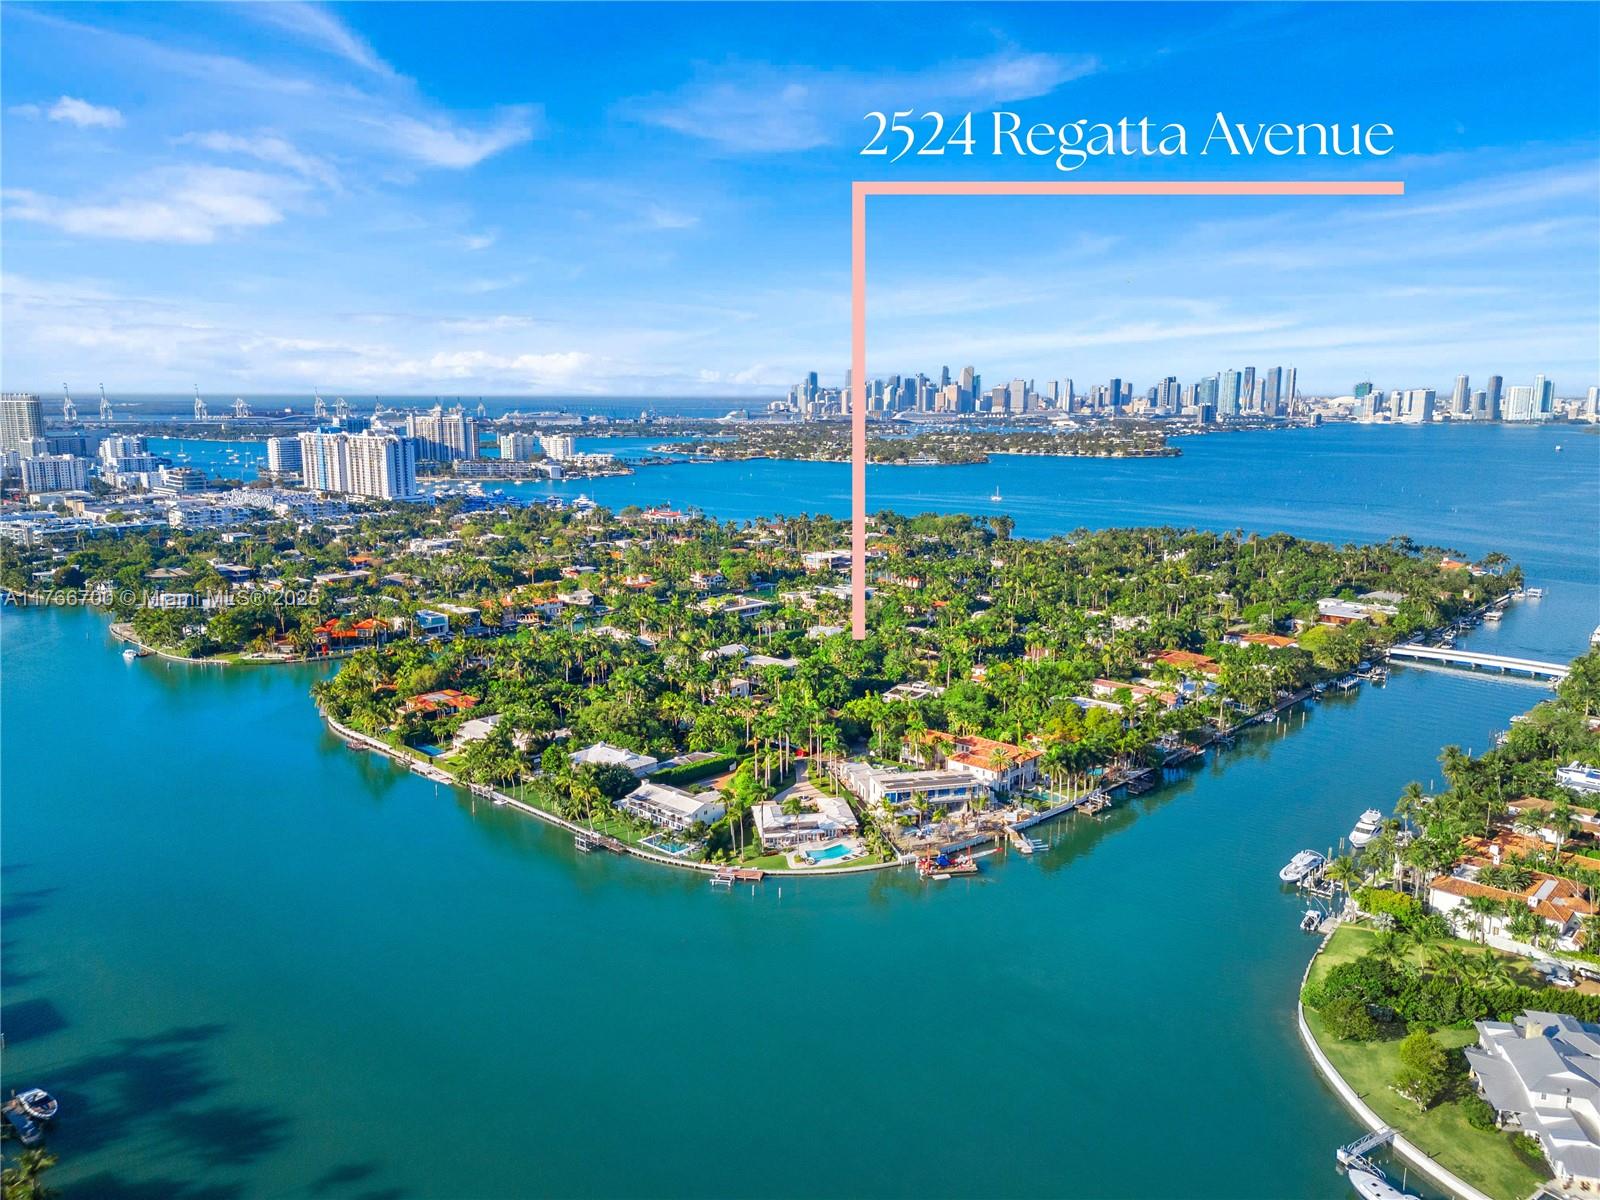
Pending
$6,700,000
4
bds
|
4
ba
|
3,162
sqft
|
built
1947
2524 Regatta Ave, Miami Beach, FL 33140
$-29,915
Cash flow
-23.3%
Cash-on-Cash Return
0.9%
Cap rate
0.1%
Rent to Value Ratio
Active
$1,640,000
2
bds
|
3
ba
|
1,094
sqft
|
built
2008
5875 Collins Ave, Miami Beach, FL 33140
$-8,318
Cash flow
-26.5%
Cash-on-Cash Return
0.2%
Cap rate
0.4%
Rent to Value Ratio
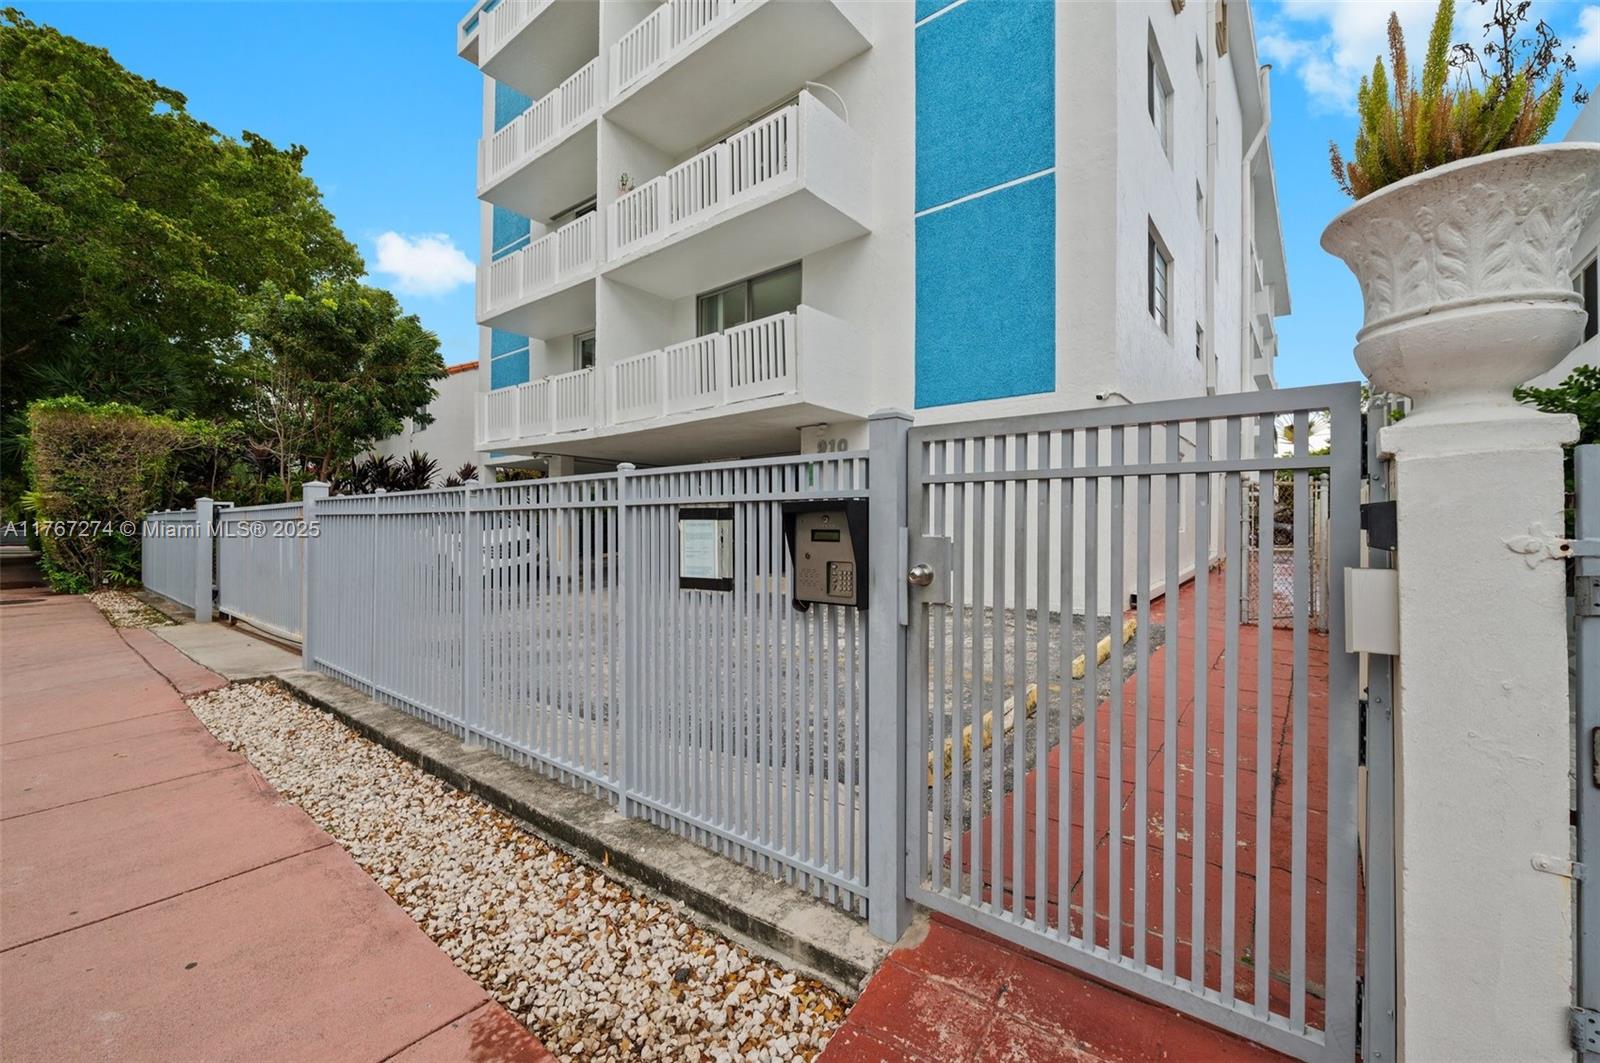
Active
$299,900
1
bds
|
1
ba
|
655
sqft
|
built
1972
910 Michigan Ave, Miami Beach, FL 33139
$-762
Cash flow
-13.3%
Cash-on-Cash Return
3.2%
Cap rate
0.8%
Rent to Value Ratio
Active
$355,000
bds
|
1
ba
|
485
sqft
|
built
2008
1100 West Ave, Miami Beach, FL 33139
$-1,864
Cash flow
-27.4%
Cash-on-Cash Return
0.0%
Cap rate
0.8%
Rent to Value Ratio
Active
$260,000
1
bds
|
1
ba
|
638
sqft
|
built
1940
1021 Euclid Ave, Miami Beach, FL 33139
$-1,096
Cash flow
-22.0%
Cash-on-Cash Return
1.2%
Cap rate
0.8%
Rent to Value Ratio

Active
$2,880,000
3
bds
|
3
ba
|
2,010
sqft
|
built
2000
4775 Collins Ave, Miami Beach, FL 33140
$-14,014
Cash flow
-25.4%
Cash-on-Cash Return
0.4%
Cap rate
0.3%
Rent to Value Ratio
Active
$19,642,000
4
bds
|
5
ba
|
4,365
sqft
|
built
2009
125 Ocean Dr, Miami Beach, FL 33139
$-123,415
Cash flow
-32.8%
Cash-on-Cash Return
-1.3%
Cap rate
0.0%
Rent to Value Ratio
Active
$415,000
1
bds
|
1
ba
|
852
sqft
|
built
1968
1000 West Ave, Miami Beach, FL 33139
$-1,437
Cash flow
-18.1%
Cash-on-Cash Return
2.1%
Cap rate
0.8%
Rent to Value Ratio
Active
$407,000
bds
|
1
ba
|
565
sqft
|
built
1965
100 Lincoln Rd, Miami Beach, FL 33139
$-952
Cash flow
-12.2%
Cash-on-Cash Return
3.5%
Cap rate
0.9%
Rent to Value Ratio

Active
$2,995,888
3
bds
|
3
ba
|
2,060
sqft
|
built
1995
5025 Collins Ave, Miami Beach, FL 33140
$-15,092
Cash flow
-26.3%
Cash-on-Cash Return
0.2%
Cap rate
0.3%
Rent to Value Ratio

Active
$305,000
1
bds
|
1
ba
|
450
sqft
|
built
2016
1215 West Ave, Miami Beach, FL 33139
$-715
Cash flow
-12.2%
Cash-on-Cash Return
3.5%
Cap rate
1.0%
Rent to Value Ratio

Active
$4,950,000
3
bds
|
4
ba
|
2,049
sqft
|
built
1989
19136 Fisher Island Dr, Miami Beach, FL 33109
$-26,087
Cash flow
-27.5%
Cash-on-Cash Return
0.0%
Cap rate
0.2%
Rent to Value Ratio
Active
$1,250,000
2
bds
|
2
ba
|
1,147
sqft
|
built
1997
650 West Ave, Miami Beach, FL 33139
$-4,496
Cash flow
-18.8%
Cash-on-Cash Return
2.0%
Cap rate
0.5%
Rent to Value Ratio
Active
$1,925,000
3
bds
|
3
ba
|
2,640
sqft
|
built
1997
1415 20th St, Miami Beach, FL 33139
$-8,101
Cash flow
-22.0%
Cash-on-Cash Return
1.2%
Cap rate
0.5%
Rent to Value Ratio
Active
$615,000
2
bds
|
2
ba
|
1,311
sqft
|
built
1981
6820 Indian Creek Dr, Miami Beach, FL 33141
$-1,561
Cash flow
-13.2%
Cash-on-Cash Return
3.2%
Cap rate
0.6%
Rent to Value Ratio