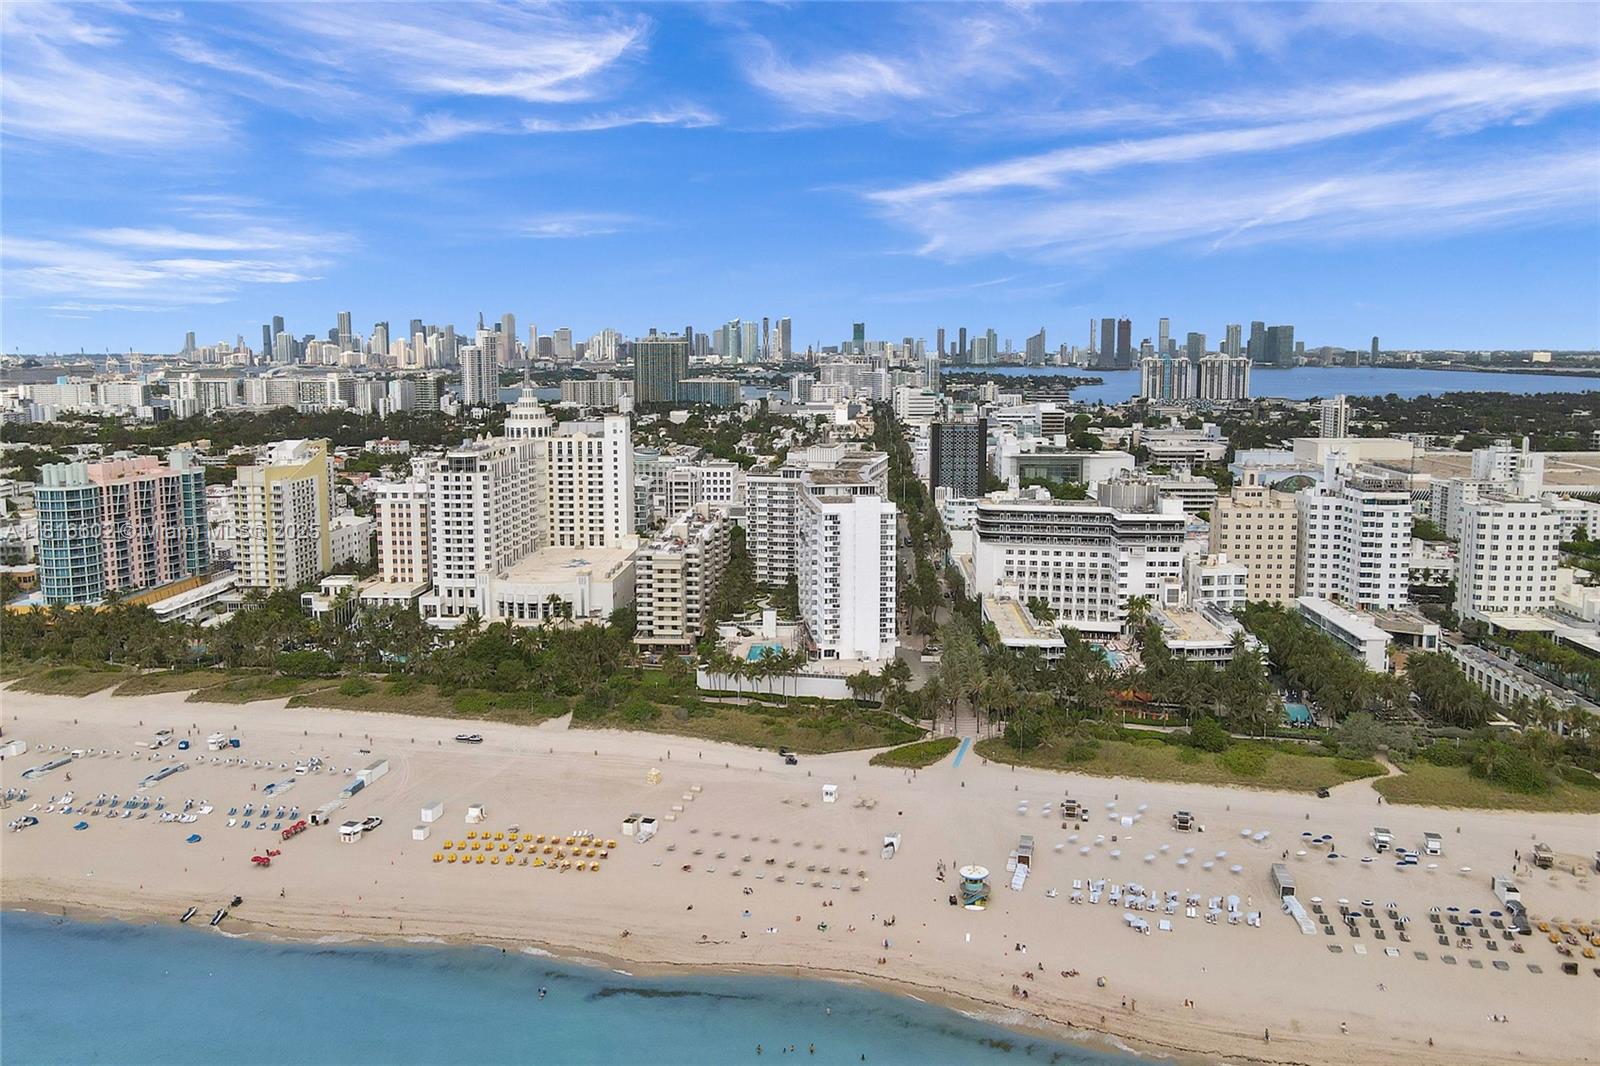
Miami Beach, FL Investment Properties for Sale
Browse homes for sale and investment properties in Miami Beach, FL. Refine your search by price, property type, or more.
Best cash flowing properties in Miami Beach, FL
Active
$185,900
0
bds
|
1
ba
|
420
sqft
|
built
1971
7620 Carlyle Ave, Miami Beach, FL 33141
$-148
Cash flow
-4.2%
Cash-on-Cash Return
5.3%
Cap rate
0.9%
Rent to Value Ratio
Active
$235,000
1
bds
|
1
ba
|
590
sqft
|
built
1925
1200 Euclid Ave, Miami Beach, FL 33139
$-452
Cash flow
-10.0%
Cash-on-Cash Return
4.0%
Cap rate
1.0%
Rent to Value Ratio
1,984 out of 2,186 properties for sale in Miami Beach, FL
Limited Results Shown
Create a free account, or log in to reveal all property listings and enjoy the complete experience.
Active
$498,500
bds
|
1
ba
|
538
sqft
|
built
1970
401 Ocean Dr, Miami Beach, FL 33139
$-896
Cash flow
-9.4%
Cash-on-Cash Return
4.1%
Cap rate
0.8%
Rent to Value Ratio
Active
$1,895,000
2
bds
|
2
ba
|
1,380
sqft
|
built
2000
4775 Collins Ave, Miami Beach, FL 33140
$-6,933
Cash flow
-19.1%
Cash-on-Cash Return
1.9%
Cap rate
0.4%
Rent to Value Ratio

Active
$2,520,000
2
bds
|
3
ba
|
1,621
sqft
|
built
2008
3737 Collins Ave, Miami Beach, FL 33140
$-15,193
Cash flow
-31.5%
Cash-on-Cash Return
-1.0%
Cap rate
0.2%
Rent to Value Ratio
Active
$549,999
2
bds
|
2
ba
|
890
sqft
|
built
1972
1345 Lincoln Rd, Miami Beach, FL 33139
$-1,371
Cash flow
-13.0%
Cash-on-Cash Return
3.3%
Cap rate
0.6%
Rent to Value Ratio
Active
$2,750,000
bds
|
0
ba
|
4,460
sqft
|
built
1955
1420 16th St, Miami Beach, FL 33139
$-14,223
Cash flow
-27.0%
Cash-on-Cash Return
0.1%
Cap rate
0.1%
Rent to Value Ratio
Active
$839,999
2
bds
|
2
ba
|
1,500
sqft
|
built
1963
900 Bay Dr, Miami Beach, FL 33141
$-3,083
Cash flow
-19.1%
Cash-on-Cash Return
1.9%
Cap rate
0.7%
Rent to Value Ratio
Active
$630,000
2
bds
|
2
ba
|
1,326
sqft
|
built
1968
6770 Indian Creek Dr, Miami Beach, FL 33141
$-2,739
Cash flow
-22.7%
Cash-on-Cash Return
1.1%
Cap rate
0.6%
Rent to Value Ratio
Active
$390,000
2
bds
|
2
ba
|
1,326
sqft
|
built
1968
6770 Indian Creek Dr, Miami Beach, FL 33141
$-904
Cash flow
-12.1%
Cash-on-Cash Return
3.5%
Cap rate
0.8%
Rent to Value Ratio
Active
$185,900
0
bds
|
1
ba
|
420
sqft
|
built
1971
7620 Carlyle Ave, Miami Beach, FL 33141
$-148
Cash flow
-4.2%
Cash-on-Cash Return
5.3%
Cap rate
0.9%
Rent to Value Ratio
Active
$299,000
1
bds
|
1
ba
|
810
sqft
|
built
1966
800 West Ave, Miami Beach, FL 33139
$-1,316
Cash flow
-23.0%
Cash-on-Cash Return
1.0%
Cap rate
0.8%
Rent to Value Ratio
Active
$530,000
2
bds
|
2
ba
|
1,030
sqft
|
built
1968
5700 Collins Ave, Miami Beach, FL 33140
$-1,812
Cash flow
-17.8%
Cash-on-Cash Return
2.2%
Cap rate
0.8%
Rent to Value Ratio
Active
$3,695,000
2
bds
|
3
ba
|
1,815
sqft
|
built
2004
450 Alton Rd, Miami Beach, FL 33139
$-18,970
Cash flow
-26.8%
Cash-on-Cash Return
0.1%
Cap rate
0.2%
Rent to Value Ratio
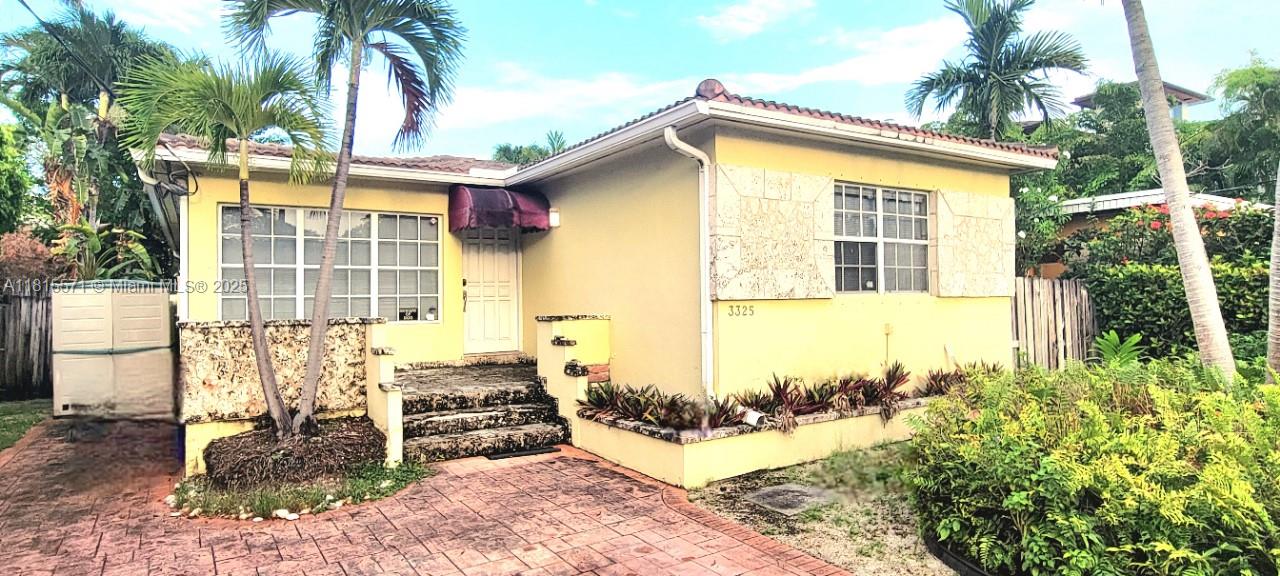
Active
$1,250,000
3
bds
|
2
ba
|
1,682
sqft
|
built
1950
3325 Alton Rd, Miami Beach, FL 33140
$-2,550
Cash flow
-10.6%
Cash-on-Cash Return
3.8%
Cap rate
0.6%
Rent to Value Ratio
Active
$948,000
2
bds
|
2
ba
|
1,218
sqft
|
built
2002
100 Meridian Ave, Miami Beach, FL 33139
$-3,019
Cash flow
-16.6%
Cash-on-Cash Return
2.5%
Cap rate
0.6%
Rent to Value Ratio
Active
$6,190,000
2
bds
|
3
ba
|
1,612
sqft
|
built
2021
5775 Collins Ave, Miami Beach, FL 33140
$-38,955
Cash flow
-32.8%
Cash-on-Cash Return
-1.3%
Cap rate
0.1%
Rent to Value Ratio
Active
$493,500
1
bds
|
1
ba
|
642
sqft
|
built
2016
6620 Indian Creek Dr, Miami Beach, FL 33141
$-1,829
Cash flow
-19.3%
Cash-on-Cash Return
1.8%
Cap rate
0.7%
Rent to Value Ratio

Active
$259,000
bds
|
1
ba
|
200
sqft
|
built
1939
335 Ocean Dr, Miami Beach, FL 33139
$-465
Cash flow
-9.4%
Cash-on-Cash Return
4.1%
Cap rate
0.9%
Rent to Value Ratio
Active
$1,200,000
2
bds
|
2
ba
|
1,340
sqft
|
built
1995
6301 Collins Ave, Miami Beach, FL 33141
$-6,021
Cash flow
-26.2%
Cash-on-Cash Return
0.3%
Cap rate
0.4%
Rent to Value Ratio
Active
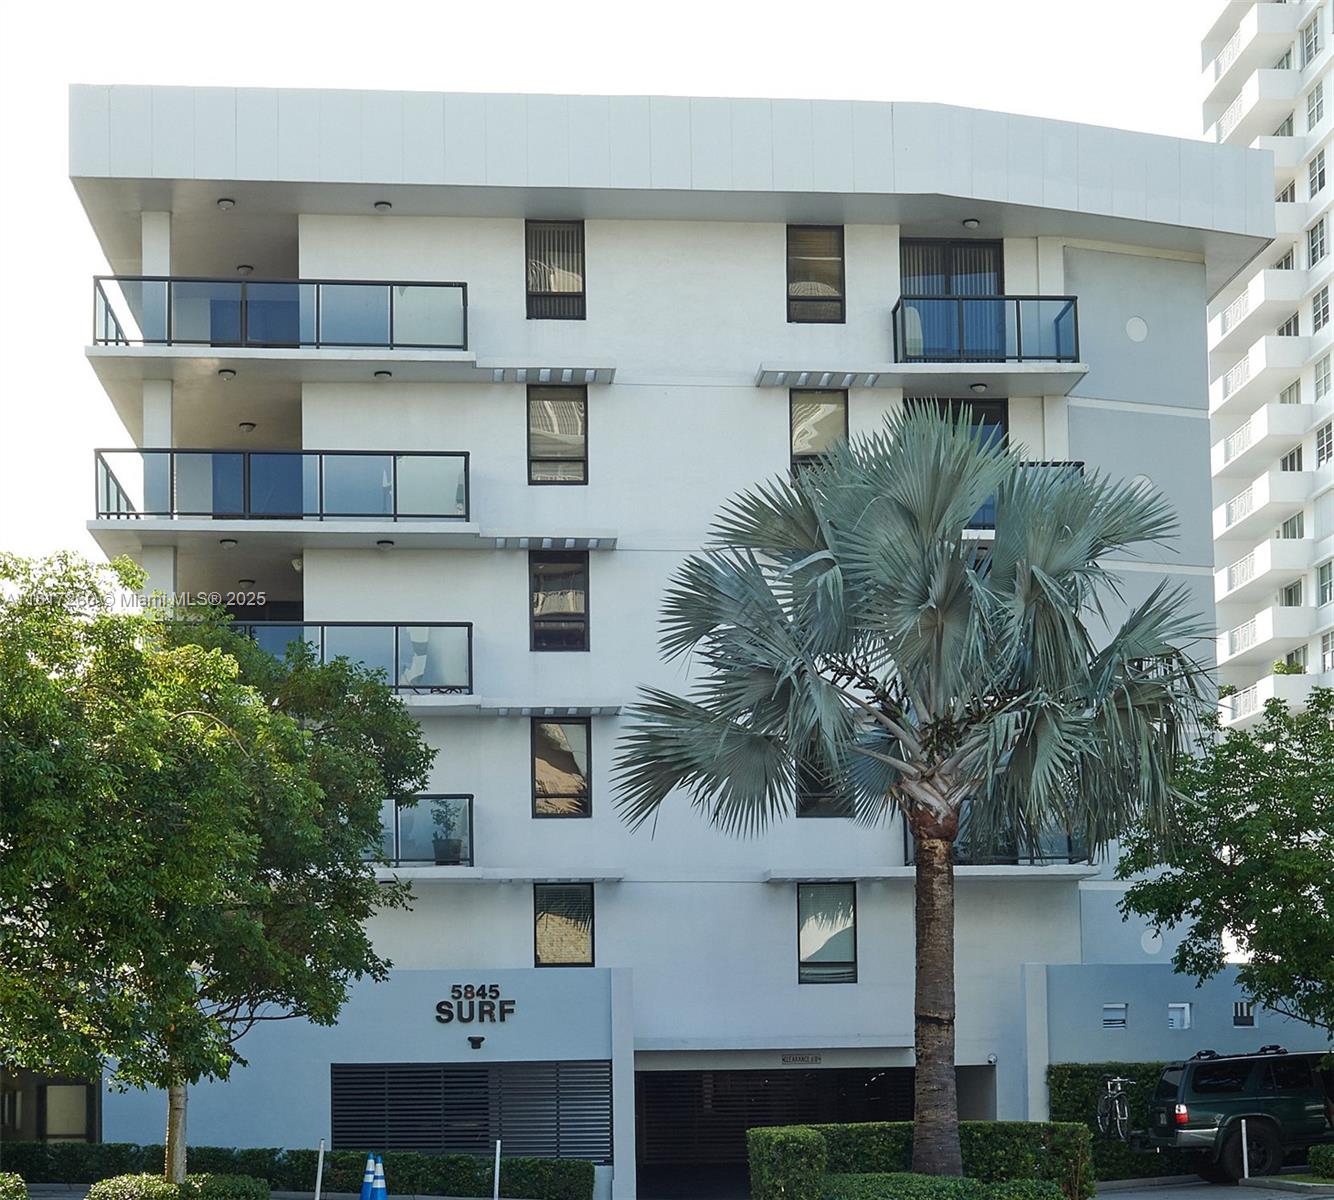
$1,099,900
2
bds
|
3
ba
|
1,723
sqft
|
built
1982
5845 Collins Ave, Miami Beach, FL 33140
$-4,363
Cash flow
-20.7%
Cash-on-Cash Return
1.5%
Cap rate
0.5%
Rent to Value Ratio
Active
$700,000
2
bds
|
2
ba
|
1,290
sqft
|
built
1971
6039 Collins Ave, Miami Beach, FL 33140
$-3,342
Cash flow
-24.9%
Cash-on-Cash Return
0.6%
Cap rate
0.5%
Rent to Value Ratio
Active
$589,000
1
bds
|
2
ba
|
856
sqft
|
built
1962
20 Island Ave, Miami Beach, FL 33139
$-2,333
Cash flow
-20.7%
Cash-on-Cash Return
1.5%
Cap rate
0.6%
Rent to Value Ratio
Active
$375,000
1
bds
|
2
ba
|
897
sqft
|
built
1972
1455 West Ave, Miami Beach, FL 33139
$-1,158
Cash flow
-16.1%
Cash-on-Cash Return
2.6%
Cap rate
0.7%
Rent to Value Ratio
Active
$1,875,000
3
bds
|
3
ba
|
1,481
sqft
|
built
2016
1201 20th St, Miami Beach, FL 33139
$-10,987
Cash flow
-30.6%
Cash-on-Cash Return
-0.7%
Cap rate
0.3%
Rent to Value Ratio
Active
$650,000
2
bds
|
2
ba
|
1,330
sqft
|
built
1995
6422 Collins Ave, Miami Beach, FL 33141
$-2,576
Cash flow
-20.7%
Cash-on-Cash Return
1.5%
Cap rate
0.6%
Rent to Value Ratio
Active
$340,000
1
bds
|
1
ba
|
720
sqft
|
built
1964
1100 11th St, Miami Beach, FL 33139
$-958
Cash flow
-14.7%
Cash-on-Cash Return
2.9%
Cap rate
0.7%
Rent to Value Ratio
Active
$5,690,000
4
bds
|
5
ba
|
3,640
sqft
|
built
2005
5959 Collins Ave, Miami Beach, FL 33140
$-33,152
Cash flow
-30.4%
Cash-on-Cash Return
-0.7%
Cap rate
0.2%
Rent to Value Ratio
Active
$369,000
1
bds
|
1
ba
|
656
sqft
|
built
1970
345 Ocean Dr, Miami Beach, FL 33139
$-1,402
Cash flow
-19.8%
Cash-on-Cash Return
1.7%
Cap rate
0.8%
Rent to Value Ratio

Active
$209,990
1
bds
|
1
ba
|
493
sqft
|
built
1940
7928 Harding Ave, Miami Beach, FL 33141
$-575
Cash flow
-14.3%
Cash-on-Cash Return
3.0%
Cap rate
0.8%
Rent to Value Ratio
Active
$218,000
1
bds
|
1
ba
|
445
sqft
|
built
1957
761 Euclid Ave, Miami Beach, FL 33139
$-534
Cash flow
-12.8%
Cash-on-Cash Return
3.3%
Cap rate
0.8%
Rent to Value Ratio
Active
$448,000
1
bds
|
1
ba
|
655
sqft
|
built
1970
401 Ocean Dr, Miami Beach, FL 33139
$-1,705
Cash flow
-19.9%
Cash-on-Cash Return
1.7%
Cap rate
0.7%
Rent to Value Ratio

Active
$3,300,000
4
bds
|
2
ba
|
1,696
sqft
|
built
1949
833 86th St, Miami Beach, FL 33141
$-15,151
Cash flow
-24.0%
Cash-on-Cash Return
0.8%
Cap rate
0.2%
Rent to Value Ratio
Active
$420,000
bds
|
1
ba
|
550
sqft
|
built
1965
100 Lincoln Rd, Miami Beach, FL 33139
$-1,576
Cash flow
-19.6%
Cash-on-Cash Return
1.8%
Cap rate
0.7%
Rent to Value Ratio
Active
$399,000
0
bds
|
0
ba
|
247
sqft
|
built
1963
900 Bay Dr, Miami Beach, FL 33141
$-543
Cash flow
-7.1%
Cash-on-Cash Return
4.6%
Cap rate
0.8%
Rent to Value Ratio
Active
$3,369,000
3
bds
|
3
ba
|
1,761
sqft
|
built
2004
6365 Collins Ave, Miami Beach, FL 33141
$-18,565
Cash flow
-28.8%
Cash-on-Cash Return
-0.3%
Cap rate
0.2%
Rent to Value Ratio
Active
$235,000
1
bds
|
1
ba
|
590
sqft
|
built
1925
1200 Euclid Ave, Miami Beach, FL 33139
$-452
Cash flow
-10.0%
Cash-on-Cash Return
4.0%
Cap rate
1.0%
Rent to Value Ratio
Active
$4,950,000
4
bds
|
5
ba
|
3,725
sqft
|
built
1937
841 19th St, Miami Beach, FL 33139
$-24,239
Cash flow
-25.5%
Cash-on-Cash Return
0.4%
Cap rate
0.2%
Rent to Value Ratio
Active
$825,000
1
bds
|
1
ba
|
776
sqft
|
built
1969
465 Ocean Dr, Miami Beach, FL 33139
$-2,475
Cash flow
-15.7%
Cash-on-Cash Return
2.7%
Cap rate
0.6%
Rent to Value Ratio
Active
$770,000
2
bds
|
2
ba
|
1,650
sqft
|
built
1967
5600 Collins Ave, Miami Beach, FL 33140
$-2,996
Cash flow
-20.3%
Cash-on-Cash Return
1.6%
Cap rate
0.6%
Rent to Value Ratio
Active
$427,000
1
bds
|
1
ba
|
535
sqft
|
built
1926
1619 Jefferson Ave, Miami Beach, FL 33139
$-1,567
Cash flow
-19.1%
Cash-on-Cash Return
1.9%
Cap rate
0.5%
Rent to Value Ratio
Active
$645,000
1
bds
|
1
ba
|
675
sqft
|
built
1965
100 Lincoln Rd, Miami Beach, FL 33139
$-2,918
Cash flow
-23.6%
Cash-on-Cash Return
0.9%
Cap rate
0.5%
Rent to Value Ratio