Miami Beach, FL Investment Properties for Sale
Browse homes for sale and investment properties in Miami Beach, FL. Refine your search by price, property type, or more.
Best cash flowing properties in Miami Beach, FL
Active
$225,000
1
bds
|
1
ba
|
540
sqft
|
built
1965
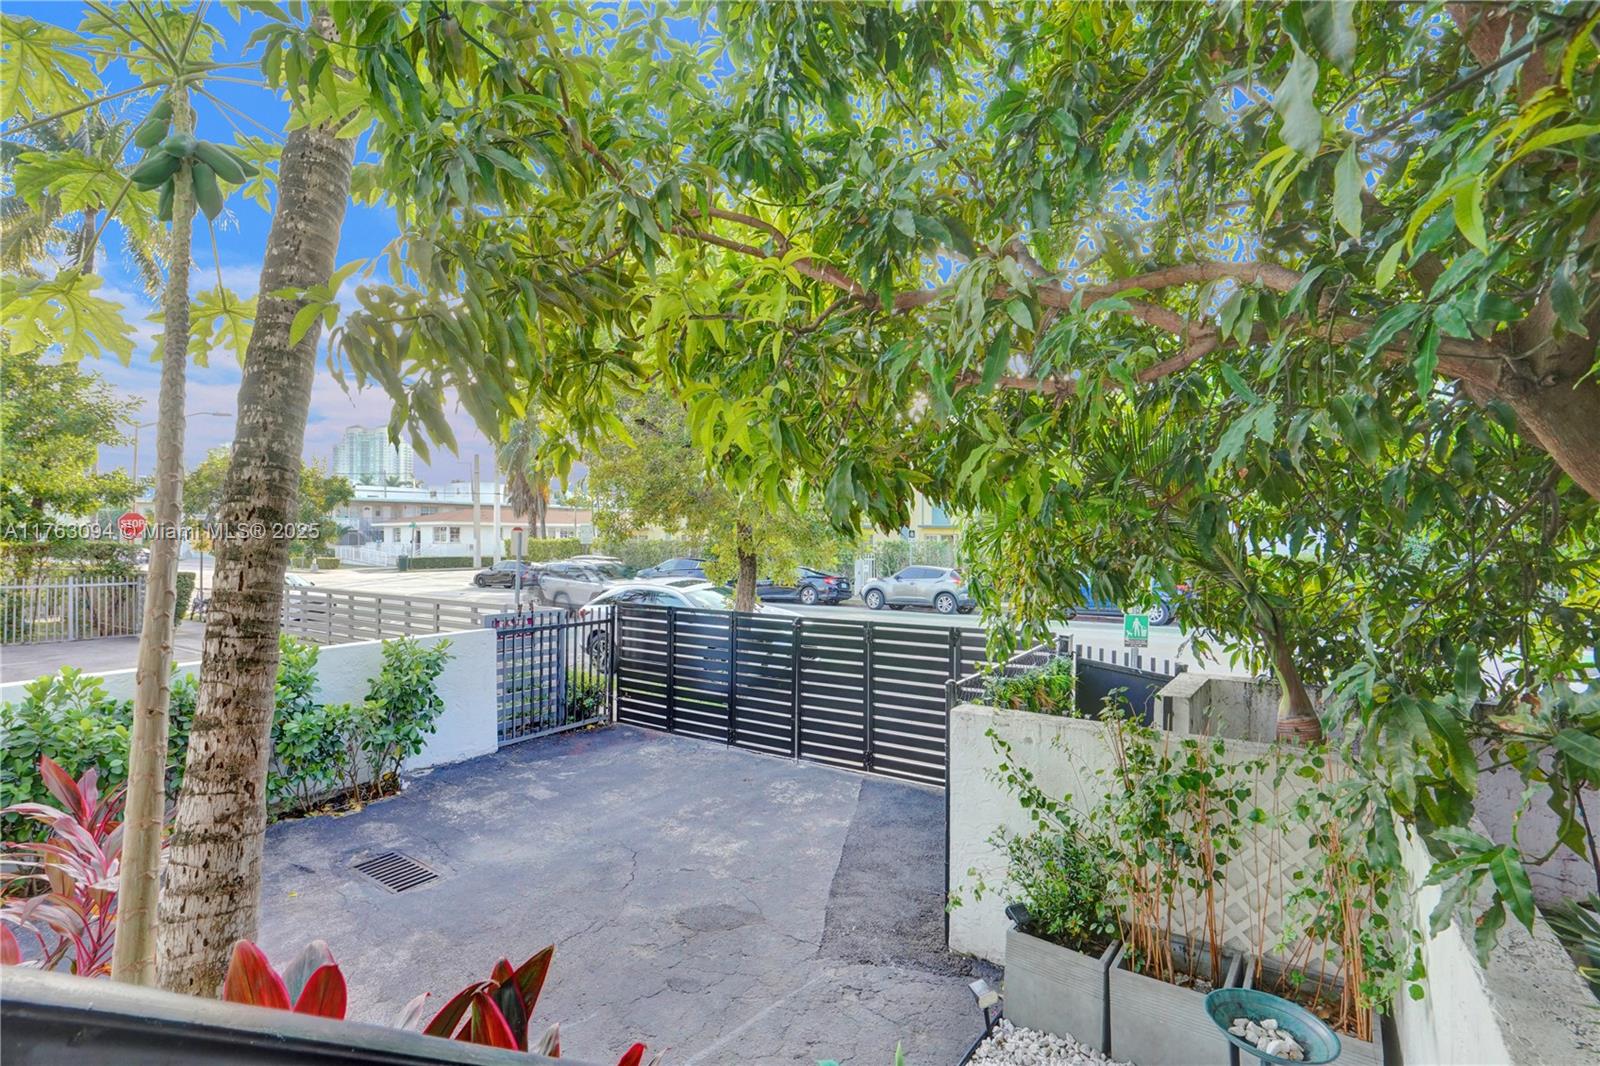
1498 Jefferson Ave, Miami Beach, FL 33139
$2
Cash flow
0.0%
Cash-on-Cash Return
6.2%
Cap rate
1.0%
Rent to Value Ratio
Active
$189,000
1
bds
|
1
ba
|
475
sqft
|
built
1966
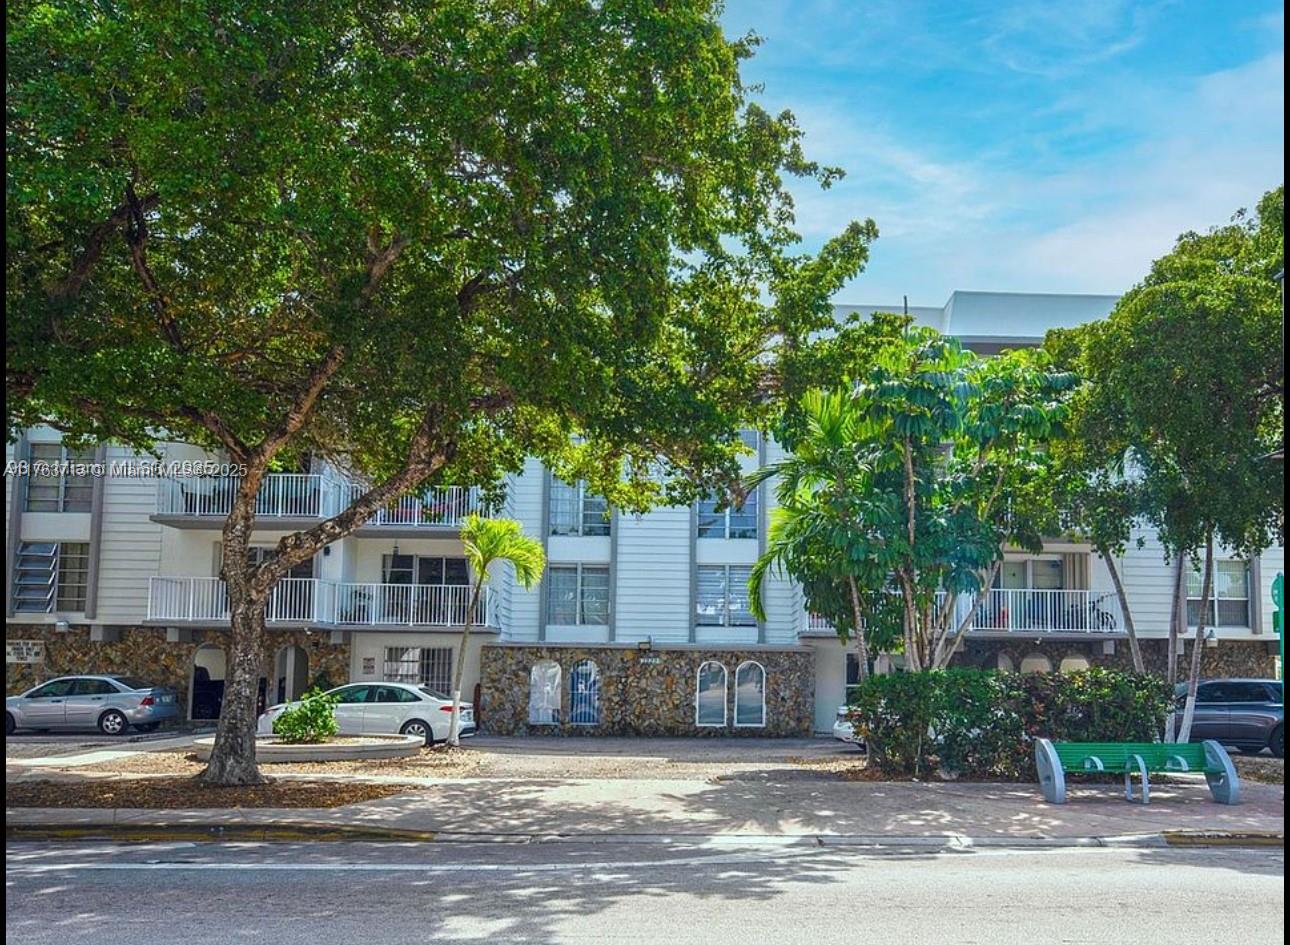
6856 Abbott Ave, Miami Beach, FL 33141
$-93
Cash flow
-2.6%
Cash-on-Cash Return
5.6%
Cap rate
1.1%
Rent to Value Ratio
1,950 out of 2,150 properties for sale in Miami Beach, FL
Limited Results Shown
Create a free account, or log in to reveal all property listings and enjoy the complete experience.
Active
$195,000
bds
|
1
ba
|
437
sqft
|
built
1940
1021 Euclid Ave, Miami Beach, FL 33139
$-720
Cash flow
-19.3%
Cash-on-Cash Return
1.7%
Cap rate
0.8%
Rent to Value Ratio
Active
$295,000
1
bds
|
1
ba
|
616
sqft
|
built
1958
1575 West Ave, Miami Beach, FL 33139
$-443
Cash flow
-7.8%
Cash-on-Cash Return
4.3%
Cap rate
0.8%
Rent to Value Ratio
Active
$450,000
0
bds
|
1
ba
|
493
sqft
|
built
2008
1100 West Ave, Miami Beach, FL 33139
$-1,821
Cash flow
-21.1%
Cash-on-Cash Return
1.3%
Cap rate
0.8%
Rent to Value Ratio
Active
$3,175,000
4
bds
|
3
ba
|
1,978
sqft
|
built
1949
7770 Hawthorne Ave, Miami Beach, FL 33141
$-11,340
Cash flow
-18.6%
Cash-on-Cash Return
1.9%
Cap rate
0.3%
Rent to Value Ratio
Active
$1,250,000
2
bds
|
2
ba
|
1,030
sqft
|
built
1966
5151 Collins Ave, Miami Beach, FL 33140
$-4,590
Cash flow
-19.2%
Cash-on-Cash Return
1.7%
Cap rate
0.5%
Rent to Value Ratio
Active
$495,000
1
bds
|
1
ba
|
873
sqft
|
built
2008
6801 Collins Ave, Miami Beach, FL 33141
$-3,762
Cash flow
-39.7%
Cash-on-Cash Return
-3.0%
Cap rate
0.7%
Rent to Value Ratio
Active
$2,100,000
2
bds
|
2
ba
|
1,463
sqft
|
built
2001
10 Venetian Way, Miami Beach, FL 33139
$-10,212
Cash flow
-25.4%
Cash-on-Cash Return
0.3%
Cap rate
0.3%
Rent to Value Ratio

Active
$499,000
1
bds
|
1
ba
|
850
sqft
|
built
1966
800 West Ave, Miami Beach, FL 33139
$-1,767
Cash flow
-18.5%
Cash-on-Cash Return
1.9%
Cap rate
0.7%
Rent to Value Ratio
Active
$289,999
1
bds
|
2
ba
|
887
sqft
|
built
1981
110 S Shore Dr, Miami Beach, FL 33141
$-640
Cash flow
-11.5%
Cash-on-Cash Return
3.5%
Cap rate
0.9%
Rent to Value Ratio
Active under contract
$410,000
2
bds
|
2
ba
|
671
sqft
|
built
2016
740 Meridian Ave, Miami Beach, FL 33139
$-883
Cash flow
-11.2%
Cash-on-Cash Return
3.6%
Cap rate
0.8%
Rent to Value Ratio
Active
$540,000
1
bds
|
2
ba
|
848
sqft
|
built
1982
2555 Collins Ave, Miami Beach, FL 33140
$-1,002
Cash flow
-9.7%
Cash-on-Cash Return
3.9%
Cap rate
0.6%
Rent to Value Ratio

Active
$525,000
2
bds
|
2
ba
|
1,088
sqft
|
built
1980
1623 Collins Ave, Miami Beach, FL 33139
$-2,427
Cash flow
-24.1%
Cash-on-Cash Return
0.6%
Cap rate
0.6%
Rent to Value Ratio
Active
$1,050,000
2
bds
|
2
ba
|
1,403
sqft
|
built
1962
20 Island Ave, Miami Beach, FL 33139
$-3,051
Cash flow
-15.2%
Cash-on-Cash Return
2.7%
Cap rate
0.8%
Rent to Value Ratio
Active
$595,000
2
bds
|
2
ba
|
1,190
sqft
|
built
1967
5600 Collins Ave, Miami Beach, FL 33140
$-2,487
Cash flow
-21.8%
Cash-on-Cash Return
1.1%
Cap rate
0.6%
Rent to Value Ratio
Active
$2,850,000
3
bds
|
3
ba
|
1,440
sqft
|
built
1960
405 N Hibiscus Dr, Miami Beach, FL 33139
$-12,521
Cash flow
-22.9%
Cash-on-Cash Return
0.9%
Cap rate
0.3%
Rent to Value Ratio
Active
$589,000
1
bds
|
2
ba
|
1,100
sqft
|
built
1963
5255 Collins Ave, Miami Beach, FL 33140
$-3,454
Cash flow
-30.6%
Cash-on-Cash Return
-0.9%
Cap rate
0.4%
Rent to Value Ratio

Active
$839,000
bds
|
1
ba
|
538
sqft
|
built
2008
4391 Collins Ave, Miami Beach, FL 33140
$-3,301
Cash flow
-20.5%
Cash-on-Cash Return
1.4%
Cap rate
0.5%
Rent to Value Ratio

Active
$2,350,000
2
bds
|
3
ba
|
1,556
sqft
|
built
2008
5875 Collins Ave, Miami Beach, FL 33140
$-9,836
Cash flow
-21.8%
Cash-on-Cash Return
1.1%
Cap rate
0.5%
Rent to Value Ratio
Active
$478,000
1
bds
|
1
ba
|
550
sqft
|
built
1965
100 Lincoln Rd, Miami Beach, FL 33139
$-1,800
Cash flow
-19.6%
Cash-on-Cash Return
1.6%
Cap rate
0.6%
Rent to Value Ratio

Active
$204,000
1
bds
|
1
ba
|
615
sqft
|
built
1966
6856 Abbott Ave, Miami Beach, FL 33141
$-321
Cash flow
-8.2%
Cash-on-Cash Return
4.3%
Cap rate
1.0%
Rent to Value Ratio

Active
$204,000
1
bds
|
1
ba
|
605
sqft
|
built
1966
6856 Abbott Ave, Miami Beach, FL 33141
$-273
Cash flow
-7.0%
Cash-on-Cash Return
4.5%
Cap rate
1.0%
Rent to Value Ratio
Active
$675,000
3
bds
|
2
ba
|
1,080
sqft
|
built
2005
7744 Collins Ave, Miami Beach, FL 33141
$-2,777
Cash flow
-21.5%
Cash-on-Cash Return
1.2%
Cap rate
0.6%
Rent to Value Ratio
Active
$189,000
1
bds
|
1
ba
|
475
sqft
|
built
1966
6856 Abbott Ave, Miami Beach, FL 33141
$-93
Cash flow
-2.6%
Cash-on-Cash Return
5.6%
Cap rate
1.1%
Rent to Value Ratio
Active
$299,000
1
bds
|
1
ba
|
443
sqft
|
built
1940
7326 Collins Ave, Miami Beach, FL 33141
$-653
Cash flow
-11.4%
Cash-on-Cash Return
3.5%
Cap rate
0.8%
Rent to Value Ratio
Active
$620,000
1
bds
|
1
ba
|
915
sqft
|
built
2005
2001 Meridian Ave, Miami Beach, FL 33139
$-2,388
Cash flow
-20.1%
Cash-on-Cash Return
1.5%
Cap rate
0.6%
Rent to Value Ratio

Active under contract
$189,000
1
bds
|
1
ba
|
475
sqft
|
built
1966
6856 Abbott Ave, Miami Beach, FL 33141
$-106
Cash flow
-2.9%
Cash-on-Cash Return
5.5%
Cap rate
1.1%
Rent to Value Ratio
Active
$1,499,000
1
bds
|
2
ba
|
1,008
sqft
|
built
2001
1000 S Pointe Dr, Miami Beach, FL 33139
$-2,863
Cash flow
-10.0%
Cash-on-Cash Return
3.9%
Cap rate
0.7%
Rent to Value Ratio
Active
$8,900,000
4
bds
|
5
ba
|
4,153
sqft
|
built
2019
4701 N Meridian Ave, Miami Beach, FL 33140
$-57,561
Cash flow
-33.7%
Cash-on-Cash Return
-1.6%
Cap rate
0.1%
Rent to Value Ratio
Active
$639,500
3
bds
|
2
ba
|
1,632
sqft
|
built
1956
7270 Gary Ave, Miami Beach, FL 33141
$-662
Cash flow
-5.4%
Cash-on-Cash Return
4.9%
Cap rate
0.8%
Rent to Value Ratio
Active
$3,999,999
5
bds
|
6
ba
|
3,581
sqft
|
built
1929
4430 Alton Rd, Miami Beach, FL 33140
$-17,660
Cash flow
-23.0%
Cash-on-Cash Return
0.8%
Cap rate
0.3%
Rent to Value Ratio
Active
$399,000
1
bds
|
1
ba
|
540
sqft
|
built
1975
619 Euclid Ave, Miami Beach, FL 33139
$-1,183
Cash flow
-15.5%
Cash-on-Cash Return
2.6%
Cap rate
0.6%
Rent to Value Ratio
Active
$599,000
1
bds
|
1
ba
|
837
sqft
|
built
1965
1200 West Ave, Miami Beach, FL 33139
$-2,257
Cash flow
-19.7%
Cash-on-Cash Return
1.6%
Cap rate
0.6%
Rent to Value Ratio
Active
$290,000
2
bds
|
2
ba
|
1,083
sqft
|
built
1970
1220 71st St, Miami Beach, FL 33141
$-711
Cash flow
-12.8%
Cash-on-Cash Return
3.2%
Cap rate
0.9%
Rent to Value Ratio

Active
$980,000
2
bds
|
2
ba
|
1,320
sqft
|
built
1968
5700 Collins Ave, Miami Beach, FL 33140
$-4,138
Cash flow
-22.0%
Cash-on-Cash Return
1.1%
Cap rate
0.5%
Rent to Value Ratio
Active
$2,100,000
2
bds
|
2
ba
|
1,230
sqft
|
built
1926
2301 Collins Ave, Miami Beach, FL 33139
$-9,022
Cash flow
-22.4%
Cash-on-Cash Return
1.0%
Cap rate
0.4%
Rent to Value Ratio
Active
$330,000
1
bds
|
2
ba
|
844
sqft
|
built
1967
5555 Collins Ave, Miami Beach, FL 33140
$-1,264
Cash flow
-20.0%
Cash-on-Cash Return
1.5%
Cap rate
0.8%
Rent to Value Ratio
Active under contract
$445,000
1
bds
|
1
ba
|
410
sqft
|
built
1939
335 Ocean Dr, Miami Beach, FL 33139
$-1,224
Cash flow
-14.4%
Cash-on-Cash Return
2.8%
Cap rate
0.7%
Rent to Value Ratio
Active
$225,000
1
bds
|
1
ba
|
540
sqft
|
built
1965
1498 Jefferson Ave, Miami Beach, FL 33139
$2
Cash flow
0.0%
Cash-on-Cash Return
6.2%
Cap rate
1.0%
Rent to Value Ratio
Active
$298,000
1
bds
|
1
ba
|
610
sqft
|
built
1947
1611 Euclid Ave, Miami Beach, FL 33139
$-902
Cash flow
-15.8%
Cash-on-Cash Return
2.5%
Cap rate
0.7%
Rent to Value Ratio
Active
$1,195,000
3
bds
|
2
ba
|
1,300
sqft
|
built
1999
125 Jefferson Ave, Miami Beach, FL 33139
$-4,053
Cash flow
-17.7%
Cash-on-Cash Return
2.1%
Cap rate
0.5%
Rent to Value Ratio