Miami Beach, FL Investment Properties for Sale
Browse homes for sale and investment properties in Miami Beach, FL. Refine your search by price, property type, or more.
Best cash flowing properties in Miami Beach, FL
Active
$230,000
1
bds
|
2
ba
|
875
sqft
|
built
1979
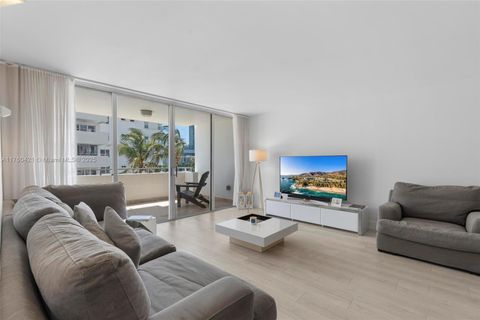
7150 Indian Creek Dr, Miami Beach, FL 33141
$-219
Cash flow
-5.0%
Cash-on-Cash Return
5.1%
Cap rate
1.0%
Rent to Value Ratio
Active
$229,000
0
bds
|
1
ba
|
500
sqft
|
built
1945
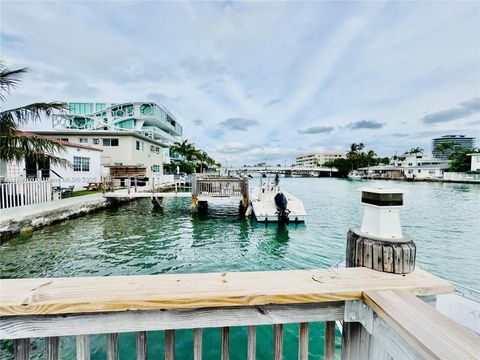
830 Euclid Ave, Miami Beach, FL 33139
$-237
Cash flow
-5.4%
Cash-on-Cash Return
5.0%
Cap rate
0.8%
Rent to Value Ratio
1,935 out of 2,133 properties for sale in Miami Beach, FL
Limited Results Shown
Create a free account, or log in to reveal all property listings and enjoy the complete experience.

Active
$750,000
2
bds
|
2
ba
|
1,081
sqft
|
built
1974
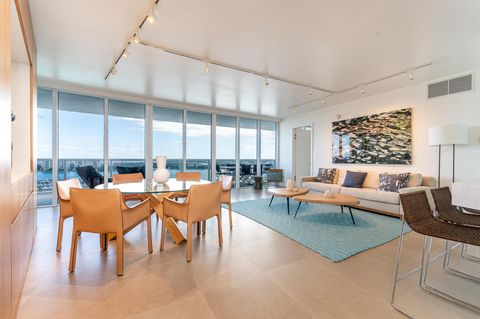
4101 Pine Tree Dr, Miami Beach, FL 33140
$-1,912
Cash flow
-13.3%
Cash-on-Cash Return
3.2%
Cap rate
0.5%
Rent to Value Ratio
Active
$10,488,000
4
bds
|
5
ba
|
3,745
sqft
|
built
2015
321 Ocean Dr, Miami Beach, FL 33139
$-73,739
Cash flow
-36.7%
Cash-on-Cash Return
-2.2%
Cap rate
0.1%
Rent to Value Ratio

Active
$389,000
1
bds
|
1
ba
|
737
sqft
|
built
1936
1600 Michigan Ave, Miami Beach, FL 33139
$-1,623
Cash flow
-21.8%
Cash-on-Cash Return
1.3%
Cap rate
0.6%
Rent to Value Ratio

Active
$350,000
1
bds
|
1
ba
|
850
sqft
|
built
1966
800 West Ave, Miami Beach, FL 33139
$-1,193
Cash flow
-17.8%
Cash-on-Cash Return
2.2%
Cap rate
0.9%
Rent to Value Ratio
Active
$6,930,000
4
bds
|
4
ba
|
4,315
sqft
|
built
1951
1690 Daytonia Rd, Miami Beach, FL 33141
$-32,602
Cash flow
-24.5%
Cash-on-Cash Return
0.6%
Cap rate
0.1%
Rent to Value Ratio

Active
$469,000
1
bds
|
1
ba
|
770
sqft
|
built
1959
4925 Collins Ave, Miami Beach, FL 33140
$-2,002
Cash flow
-22.3%
Cash-on-Cash Return
1.1%
Cap rate
0.6%
Rent to Value Ratio
Active
$1,999,999
4
bds
|
2
ba
|
0
sqft
|
built
1952
2054 Alton Rd, Miami Beach, FL 33140
$-6,685
Cash flow
-17.4%
Cash-on-Cash Return
2.3%
Cap rate
0.4%
Rent to Value Ratio
Active
$17,000,000
6
bds
|
7
ba
|
4,390
sqft
|
built
1990
7813 Fisher Island Dr, Miami Beach, FL 33109
$-97,032
Cash flow
-29.8%
Cash-on-Cash Return
-0.6%
Cap rate
0.0%
Rent to Value Ratio
Active
$5,990,000
4
bds
|
4
ba
|
3,647
sqft
|
built
1940
3738 Pine Tree Dr, Miami Beach, FL 33140
$-30,291
Cash flow
-26.4%
Cash-on-Cash Return
0.2%
Cap rate
0.1%
Rent to Value Ratio
Active
$230,000
1
bds
|
2
ba
|
875
sqft
|
built
1979
7150 Indian Creek Dr, Miami Beach, FL 33141
$-219
Cash flow
-5.0%
Cash-on-Cash Return
5.1%
Cap rate
1.0%
Rent to Value Ratio

Active
$1,050,000
2
bds
|
2
ba
|
1,320
sqft
|
built
1968
5601 Collins Ave, Miami Beach, FL 33140
$-3,036
Cash flow
-15.1%
Cash-on-Cash Return
2.8%
Cap rate
0.7%
Rent to Value Ratio

Active
$765,000
1
bds
|
2
ba
|
930
sqft
|
built
1968
5601 Collins Ave, Miami Beach, FL 33140
$-3,509
Cash flow
-23.9%
Cash-on-Cash Return
0.8%
Cap rate
0.5%
Rent to Value Ratio

Active
$365,000
1
bds
|
1
ba
|
850
sqft
|
built
1966
800 West Ave, Miami Beach, FL 33139
$-1,210
Cash flow
-17.3%
Cash-on-Cash Return
2.3%
Cap rate
0.8%
Rent to Value Ratio
Active
$1,250,000
1
bds
|
2
ba
|
900
sqft
|
built
1926
2301 Collins Ave, Miami Beach, FL 33139
$-5,858
Cash flow
-24.5%
Cash-on-Cash Return
0.6%
Cap rate
0.5%
Rent to Value Ratio

Active
$3,350,000
bds
|
0
ba
|
5,212
sqft
|
built
1952
745 Lenox Ave, Miami Beach, FL 33139
$-14,663
Cash flow
-22.8%
Cash-on-Cash Return
1.0%
Cap rate
0.2%
Rent to Value Ratio

Active
$525,000
1
bds
|
1
ba
|
662
sqft
|
built
1970
345 Ocean Dr, Miami Beach, FL 33139
$-2,023
Cash flow
-20.1%
Cash-on-Cash Return
1.6%
Cap rate
0.6%
Rent to Value Ratio
Active
$4,999,999
4
bds
|
4
ba
|
3,744
sqft
|
built
1938
5861 Lagorce Dr, Miami Beach, FL 33140
$-21,711
Cash flow
-22.7%
Cash-on-Cash Return
1.1%
Cap rate
0.2%
Rent to Value Ratio

Active
$1,950,000
2
bds
|
2
ba
|
1,380
sqft
|
built
2000
4775 Collins Ave, Miami Beach, FL 33140
$-7,976
Cash flow
-21.3%
Cash-on-Cash Return
1.4%
Cap rate
0.4%
Rent to Value Ratio

Active
$2,599,000
2
bds
|
2
ba
|
1,162
sqft
|
built
2004
101 20th St, Miami Beach, FL 33139
$-15,314
Cash flow
-30.7%
Cash-on-Cash Return
-0.8%
Cap rate
0.3%
Rent to Value Ratio

Active
$485,000
1
bds
|
1
ba
|
977
sqft
|
built
1964
5005 Collins Ave, Miami Beach, FL 33140
$-2,562
Cash flow
-27.6%
Cash-on-Cash Return
-0.1%
Cap rate
0.6%
Rent to Value Ratio

Active
$269,900
bds
|
1
ba
|
663
sqft
|
built
1968
1000 West Ave, Miami Beach, FL 33139
$-964
Cash flow
-18.6%
Cash-on-Cash Return
2.0%
Cap rate
0.8%
Rent to Value Ratio
Active
$430,000
1
bds
|
1
ba
|
837
sqft
|
built
1965
1200 West Ave, Miami Beach, FL 33139
$-1,294
Cash flow
-15.7%
Cash-on-Cash Return
2.7%
Cap rate
0.8%
Rent to Value Ratio
Active under contract
$1,850,000
2
bds
|
3
ba
|
1,324
sqft
|
built
2021
1300 Monad Ter, Miami Beach, FL 33139
$-6,938
Cash flow
-19.6%
Cash-on-Cash Return
1.8%
Cap rate
0.6%
Rent to Value Ratio

Active
$1,150,000
2
bds
|
3
ba
|
2,210
sqft
|
built
1970
5660 Collins Ave, Miami Beach, FL 33140
$-4,589
Cash flow
-20.8%
Cash-on-Cash Return
1.5%
Cap rate
0.6%
Rent to Value Ratio
Active
$229,000
0
bds
|
1
ba
|
500
sqft
|
built
1945
830 Euclid Ave, Miami Beach, FL 33139
$-237
Cash flow
-5.4%
Cash-on-Cash Return
5.0%
Cap rate
0.8%
Rent to Value Ratio
Active
$3,500,000
3
bds
|
4
ba
|
2,316
sqft
|
built
1940
725 W 49th St, Miami Beach, FL 33140
$-13,899
Cash flow
-20.7%
Cash-on-Cash Return
1.5%
Cap rate
0.3%
Rent to Value Ratio

Active
$350,000
1
bds
|
2
ba
|
715
sqft
|
built
1972
1610 Lenox Ave, Miami Beach, FL 33139
$-834
Cash flow
-12.4%
Cash-on-Cash Return
3.4%
Cap rate
0.8%
Rent to Value Ratio
Active
$2,175,000
3
bds
|
2
ba
|
1,361
sqft
|
built
1951
8533 Crespi Blvd, Miami Beach, FL 33141
$-9,330
Cash flow
-22.4%
Cash-on-Cash Return
1.1%
Cap rate
0.3%
Rent to Value Ratio
Active
$675,000
2
bds
|
3
ba
|
1,380
sqft
|
built
1968
6450 Collins Ave, Miami Beach, FL 33141
$-1,435
Cash flow
-11.1%
Cash-on-Cash Return
3.7%
Cap rate
0.6%
Rent to Value Ratio
Active
$9,250,000
4
bds
|
4
ba
|
2,914
sqft
|
built
1950
744 Lakeview Dr, Miami Beach, FL 33140
$-45,407
Cash flow
-25.6%
Cash-on-Cash Return
0.4%
Cap rate
0.1%
Rent to Value Ratio
Active
$679,900
2
bds
|
2
ba
|
1,127
sqft
|
built
2001
1330 West Ave, Miami Beach, FL 33139
$-2,143
Cash flow
-16.4%
Cash-on-Cash Return
2.5%
Cap rate
0.7%
Rent to Value Ratio
Active
$759,000
2
bds
|
2
ba
|
1,238
sqft
|
built
1972
11 Island Ave, Miami Beach, FL 33139
$-3,114
Cash flow
-21.4%
Cash-on-Cash Return
1.3%
Cap rate
0.7%
Rent to Value Ratio

Active
$289,000
1
bds
|
2
ba
|
920
sqft
|
built
1963
900 Bay Dr, Miami Beach, FL 33141
$-1,351
Cash flow
-24.4%
Cash-on-Cash Return
0.7%
Cap rate
0.9%
Rent to Value Ratio

Active
$469,000
1
bds
|
1
ba
|
719
sqft
|
built
1942
645 Michigan Ave, Miami Beach, FL 33139
$-920
Cash flow
-10.2%
Cash-on-Cash Return
3.9%
Cap rate
0.7%
Rent to Value Ratio
Active
$273,000
1
bds
|
1
ba
|
543
sqft
|
built
1948
8335 Crespi Blvd, Miami Beach, FL 33141
$-766
Cash flow
-14.6%
Cash-on-Cash Return
2.9%
Cap rate
0.8%
Rent to Value Ratio
Active
$2,800,000
2
bds
|
3
ba
|
1,600
sqft
|
built
2003
400 Alton Rd, Miami Beach, FL 33139
$-14,059
Cash flow
-26.2%
Cash-on-Cash Return
0.2%
Cap rate
0.3%
Rent to Value Ratio
Active
$799,800
2
bds
|
2
ba
|
1,078
sqft
|
built
1997
650 West Ave, Miami Beach, FL 33139
$-2,833
Cash flow
-18.5%
Cash-on-Cash Return
2.0%
Cap rate
0.6%
Rent to Value Ratio

Active
$990,000
2
bds
|
2
ba
|
1,143
sqft
|
built
2016
6620 Indian Creek Dr, Miami Beach, FL 33141
$-3,678
Cash flow
-19.4%
Cash-on-Cash Return
1.8%
Cap rate
0.6%
Rent to Value Ratio

Active
$4,200,000
3
bds
|
3
ba
|
2,082
sqft
|
built
1940
5925 Lagorce Dr, Miami Beach, FL 33140
$-19,218
Cash flow
-23.9%
Cash-on-Cash Return
0.8%
Cap rate
0.2%
Rent to Value Ratio

Active
$235,000
1
bds
|
1
ba
|
485
sqft
|
built
2015
918 Jefferson Ave, Miami Beach, FL 33139
$-615
Cash flow
-13.7%
Cash-on-Cash Return
3.1%
Cap rate
0.9%
Rent to Value Ratio