Miami Beach, FL Investment Properties for Sale
Browse homes for sale and investment properties in Miami Beach, FL. Refine your search by price, property type, or more.
Best cash flowing properties in Miami Beach, FL
Active
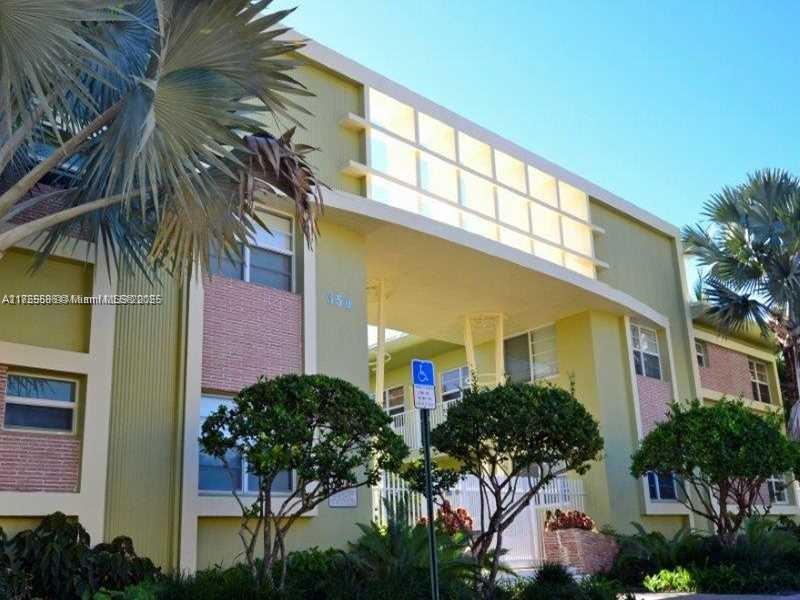
$320,000
2
bds
|
2
ba
|
1,030
sqft
|
built
1954
350 S Shore Dr, Miami Beach, FL 33141
$-347
Cash flow
-5.7%
Cash-on-Cash Return
4.8%
Cap rate
0.8%
Rent to Value Ratio
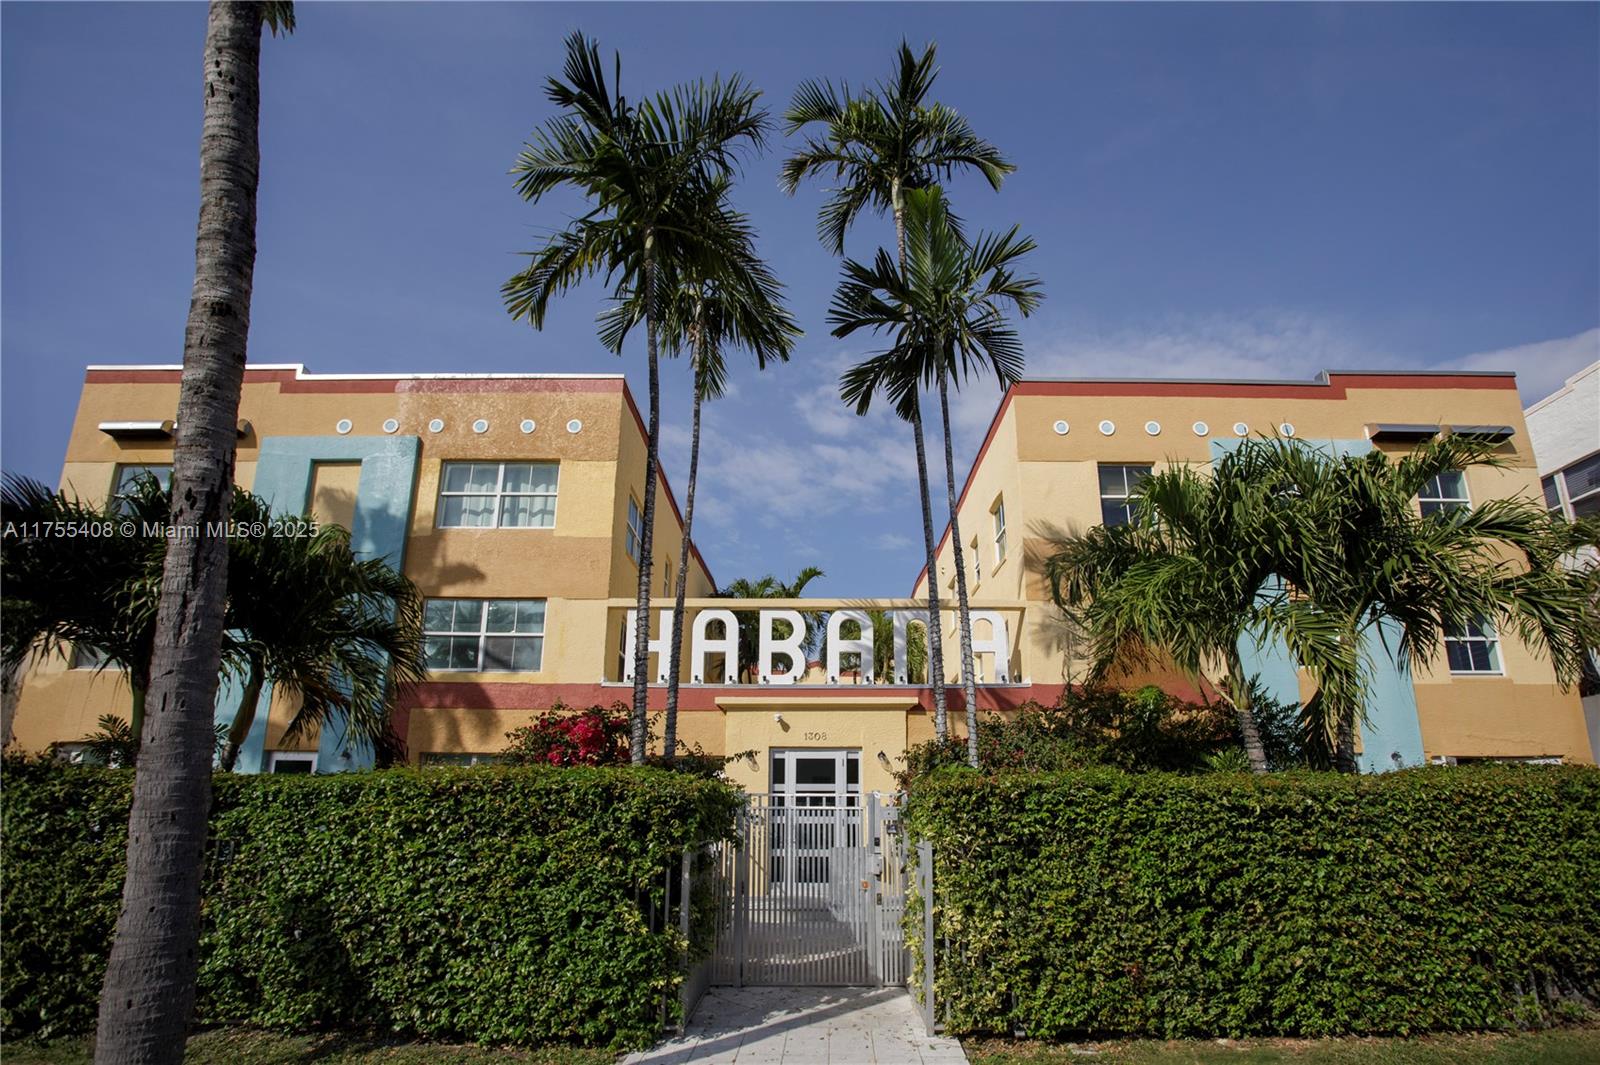
Active
$249,000
1
bds
|
1
ba
|
600
sqft
|
built
1925
1308 Drexel Ave, Miami Beach, FL 33139
$-405
Cash flow
-8.5%
Cash-on-Cash Return
4.2%
Cap rate
0.9%
Rent to Value Ratio
1,940 out of 2,138 properties for sale in Miami Beach, FL
Limited Results Shown
Create a free account, or log in to reveal all property listings and enjoy the complete experience.
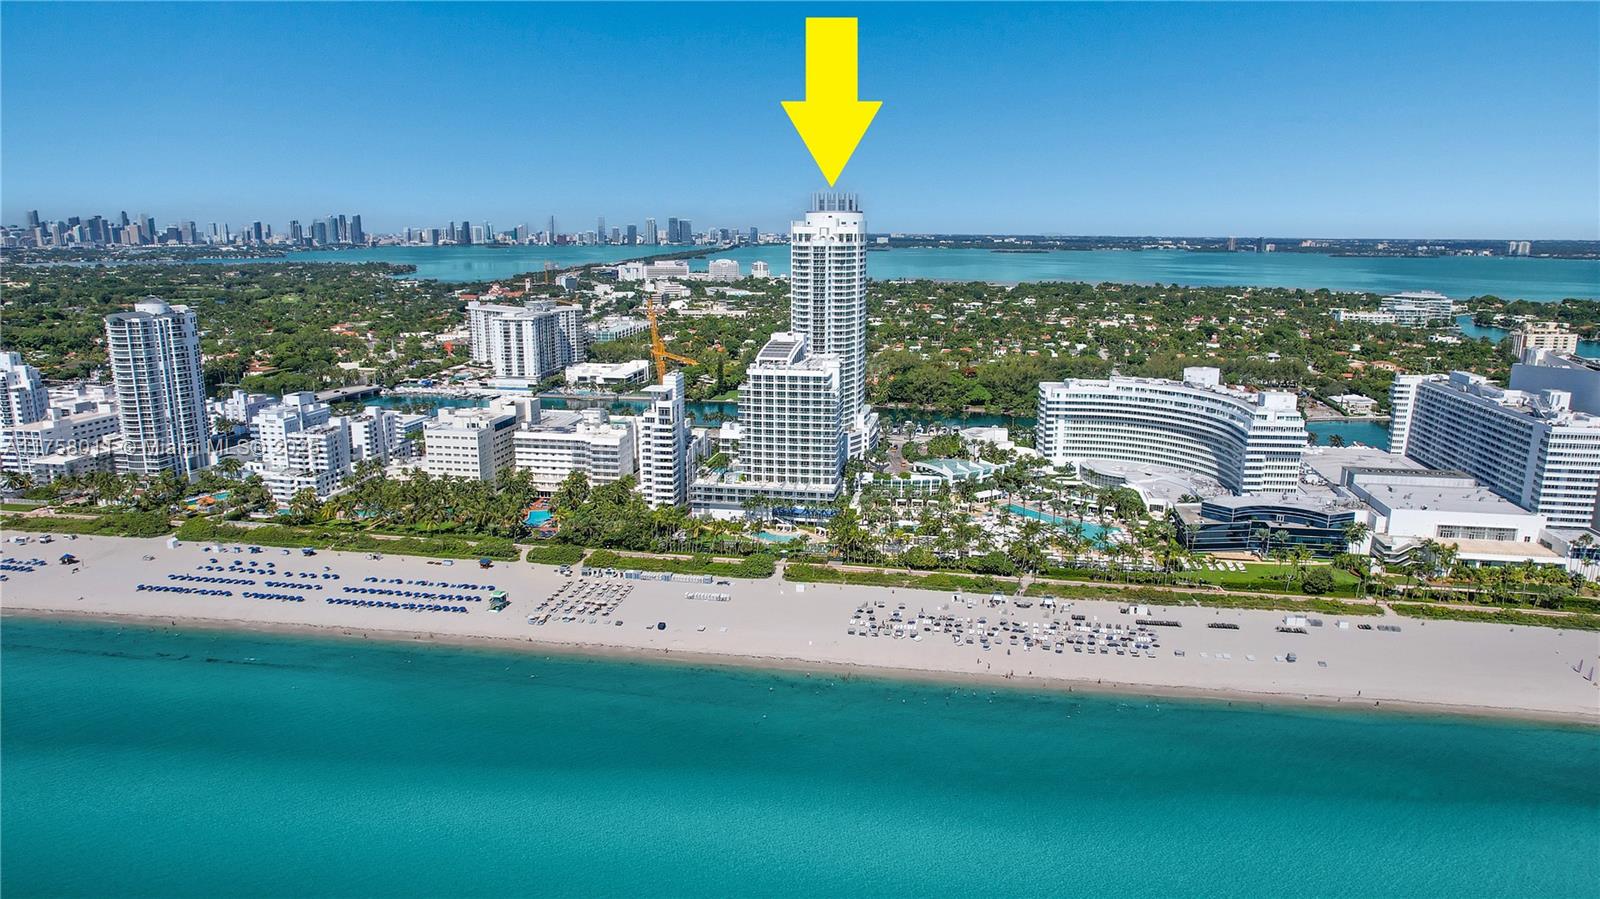
Active
$1,699,000
1
bds
|
2
ba
|
1,002
sqft
|
built
2005
4401 Collins Ave, Miami Beach, FL 33140
$-7,835
Cash flow
-24.1%
Cash-on-Cash Return
0.6%
Cap rate
0.3%
Rent to Value Ratio
Active
$249,000
1
bds
|
1
ba
|
600
sqft
|
built
1925
1308 Drexel Ave, Miami Beach, FL 33139
$-405
Cash flow
-8.5%
Cash-on-Cash Return
4.2%
Cap rate
0.9%
Rent to Value Ratio

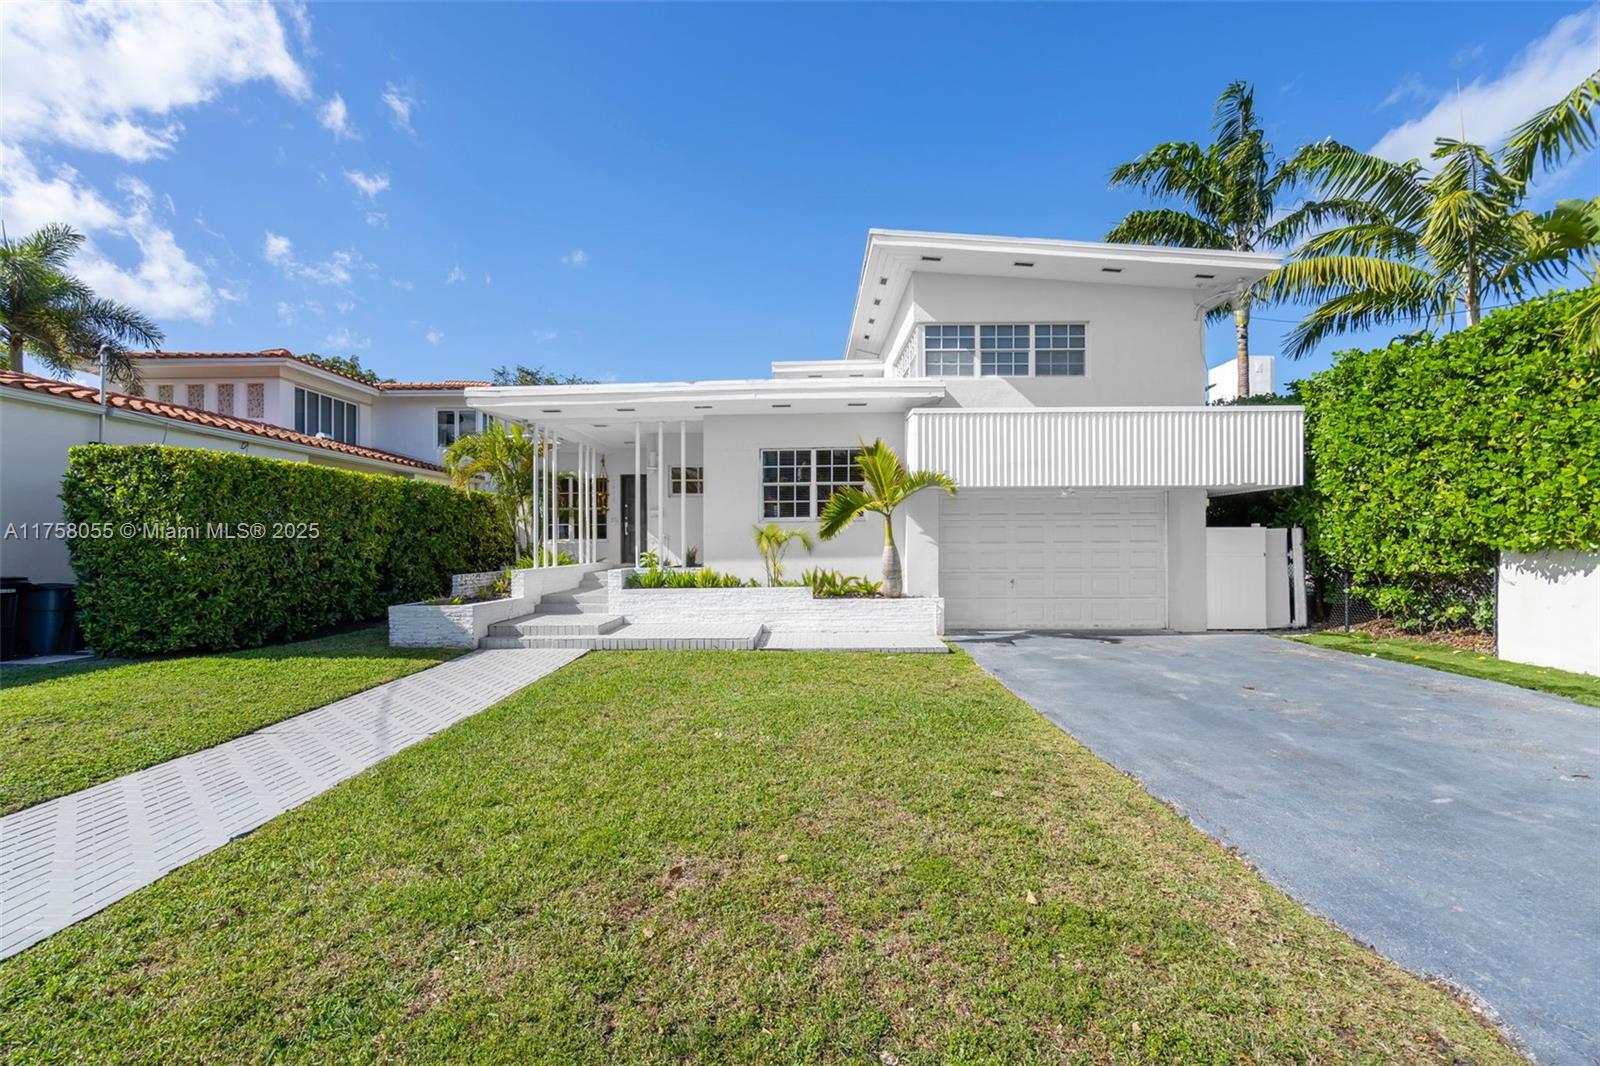
Active
$300,000
1
bds
|
1
ba
|
700
sqft
|
built
1937
1307 Euclid Ave, Miami Beach, FL 33139
$-1,199
Cash flow
-20.9%
Cash-on-Cash Return
1.4%
Cap rate
0.7%
Rent to Value Ratio
Active
$3,990,000
4
bds
|
3
ba
|
2,565
sqft
|
built
1950
5940 Lagorce Dr, Miami Beach, FL 33140
$-12,459
Cash flow
-16.3%
Cash-on-Cash Return
2.4%
Cap rate
0.3%
Rent to Value Ratio
Active
$4,980,000
5
bds
|
7
ba
|
4,599
sqft
|
built
2002
5801 Collins Ave, Miami Beach, FL 33140
$-24,890
Cash flow
-26.1%
Cash-on-Cash Return
0.1%
Cap rate
0.2%
Rent to Value Ratio

Active
$2,995,000
4
bds
|
5
ba
|
2,835
sqft
|
built
1951
720 N Shore Dr, Miami Beach, FL 33141
$-12,148
Cash flow
-21.2%
Cash-on-Cash Return
1.3%
Cap rate
0.2%
Rent to Value Ratio

Active
$699,000
2
bds
|
2
ba
|
1,270
sqft
|
built
1967
5600 Collins Ave, Miami Beach, FL 33140
$-2,956
Cash flow
-22.1%
Cash-on-Cash Return
1.1%
Cap rate
0.6%
Rent to Value Ratio
Active
$675,000
2
bds
|
2
ba
|
1,320
sqft
|
built
1969
5701 Collins Ave, Miami Beach, FL 33140
$-2,584
Cash flow
-20.0%
Cash-on-Cash Return
1.6%
Cap rate
0.7%
Rent to Value Ratio
Active
$365,000
2
bds
|
2
ba
|
1,100
sqft
|
built
1966
2016 Bay Dr, Miami Beach, FL 33141
$-1,788
Cash flow
-25.6%
Cash-on-Cash Return
0.3%
Cap rate
0.7%
Rent to Value Ratio
Active
$299,000
1
bds
|
1
ba
|
730
sqft
|
built
1966
1300 Lincoln Rd, Miami Beach, FL 33139
$-953
Cash flow
-16.6%
Cash-on-Cash Return
2.3%
Cap rate
0.8%
Rent to Value Ratio
Active
$925,000
2
bds
|
2
ba
|
1,305
sqft
|
built
1980
2625 Collins Ave, Miami Beach, FL 33140
$-1,594
Cash flow
-9.0%
Cash-on-Cash Return
4.1%
Cap rate
0.6%
Rent to Value Ratio
Active
$3,295,000
4
bds
|
2
ba
|
2,127
sqft
|
built
1945
7940 Hawthorne Ave, Miami Beach, FL 33141
$-11,225
Cash flow
-17.8%
Cash-on-Cash Return
2.1%
Cap rate
0.3%
Rent to Value Ratio
Active
$869,000
2
bds
|
3
ba
|
2,115
sqft
|
built
1970
5660 Collins Ave, Miami Beach, FL 33140
$-3,488
Cash flow
-20.9%
Cash-on-Cash Return
1.3%
Cap rate
0.8%
Rent to Value Ratio

Active
$650,000
2
bds
|
2
ba
|
1,187
sqft
|
built
1968
1000 West Ave, Miami Beach, FL 33139
$-1,942
Cash flow
-15.6%
Cash-on-Cash Return
2.6%
Cap rate
0.6%
Rent to Value Ratio
Active
$289,000
2
bds
|
1
ba
|
670
sqft
|
built
1969
821 Jefferson Ave, Miami Beach, FL 33139
$-640
Cash flow
-11.6%
Cash-on-Cash Return
3.5%
Cap rate
0.9%
Rent to Value Ratio
Active
$1,870,000
3
bds
|
3
ba
|
1,400
sqft
|
built
1996
6301 Collins Ave, Miami Beach, FL 33141
$-7,724
Cash flow
-21.6%
Cash-on-Cash Return
1.2%
Cap rate
0.4%
Rent to Value Ratio
Active
$920,000
0
bds
|
1
ba
|
600
sqft
|
built
1926
2301 Collins Ave, Miami Beach, FL 33139
$-4,760
Cash flow
-27.0%
Cash-on-Cash Return
-0.1%
Cap rate
0.3%
Rent to Value Ratio
Active
$25,900,000
3
bds
|
4
ba
|
4,776
sqft
|
built
2002
100 S Pointe Dr, Miami Beach, FL 33139
$-154,435
Cash flow
-31.1%
Cash-on-Cash Return
-1.0%
Cap rate
0.0%
Rent to Value Ratio
Active under contract
$600,000
3
bds
|
2
ba
|
1,290
sqft
|
built
1971
6039 Collins Ave, Miami Beach, FL 33140
$-1,833
Cash flow
-15.9%
Cash-on-Cash Return
2.5%
Cap rate
0.7%
Rent to Value Ratio

Active
$12,000,000
5
bds
|
4
ba
|
4,428
sqft
|
built
1959
1750 Bay Dr, Miami Beach, FL 33141
$-62,553
Cash flow
-27.2%
Cash-on-Cash Return
-0.1%
Cap rate
0.1%
Rent to Value Ratio

Active
$449,000
2
bds
|
2
ba
|
1,287
sqft
|
built
1970
401 69th St, Miami Beach, FL 33141
$-2,007
Cash flow
-23.3%
Cash-on-Cash Return
0.8%
Cap rate
0.7%
Rent to Value Ratio
Active
$549,000
1
bds
|
2
ba
|
906
sqft
|
built
1967
5555 Collins Ave, Miami Beach, FL 33140
$-2,291
Cash flow
-21.8%
Cash-on-Cash Return
1.1%
Cap rate
0.6%
Rent to Value Ratio

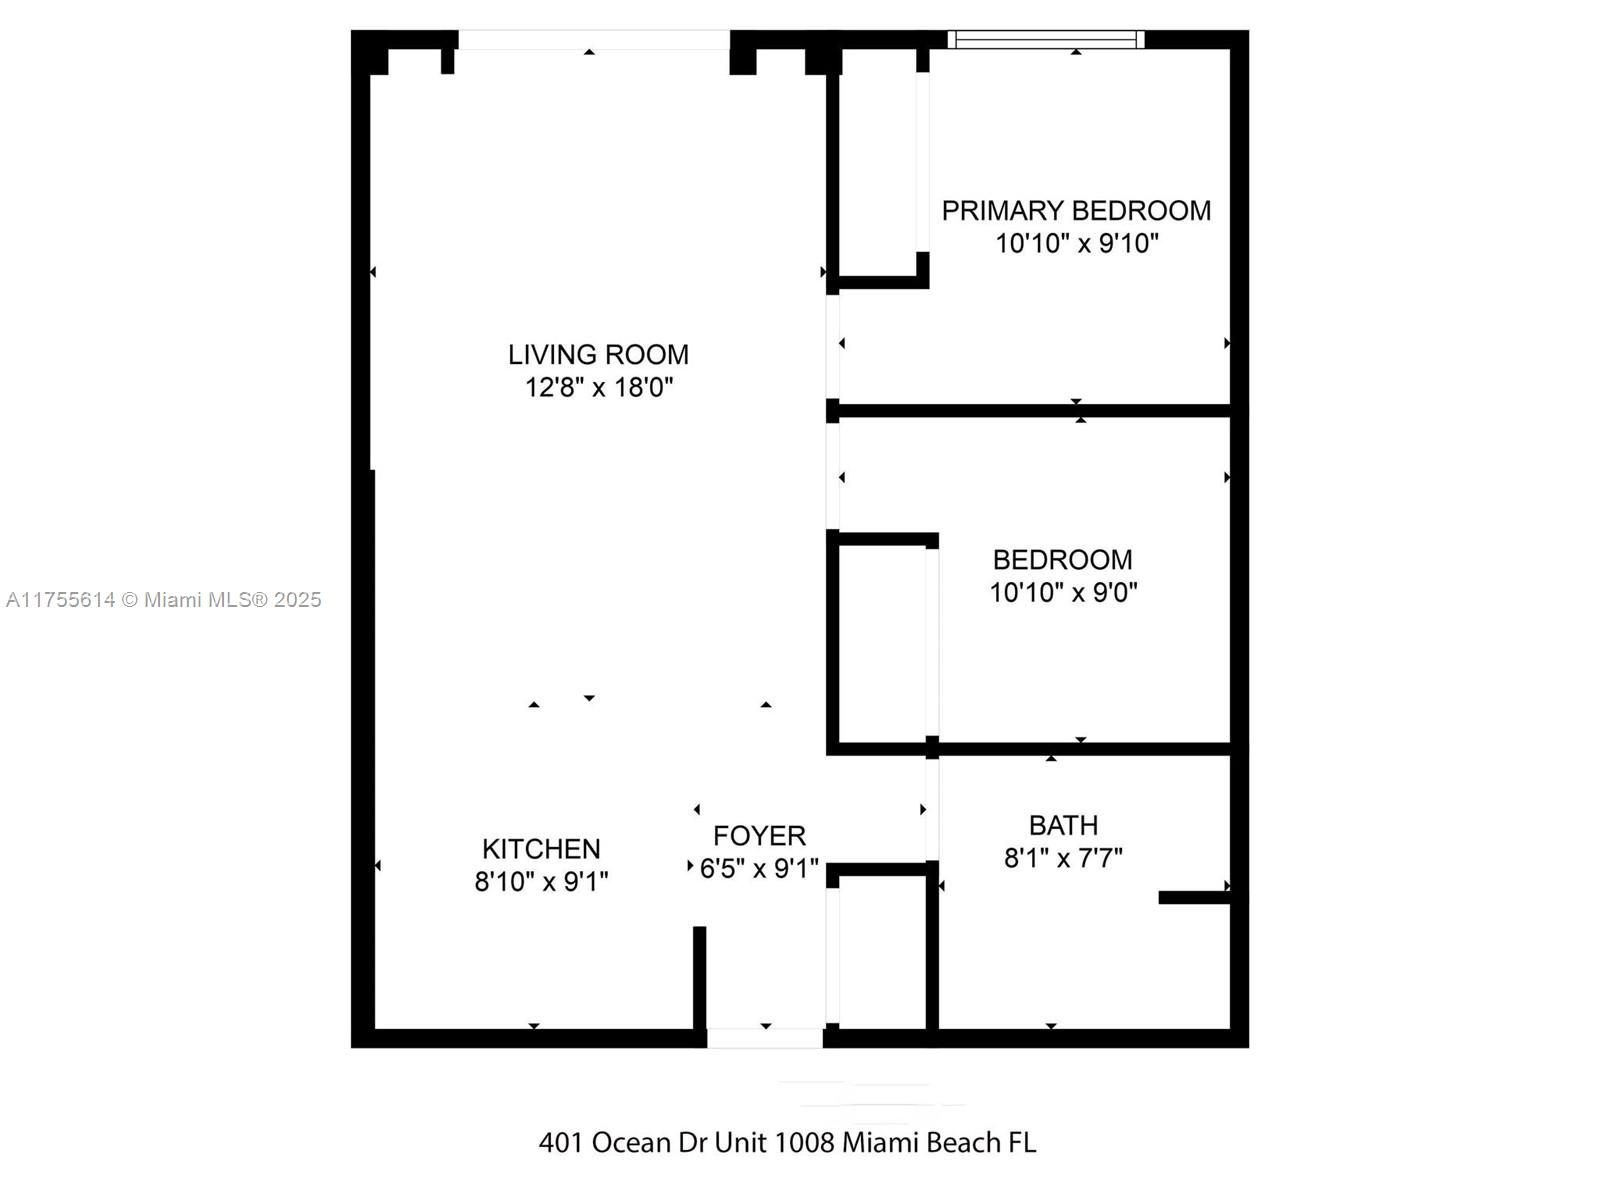
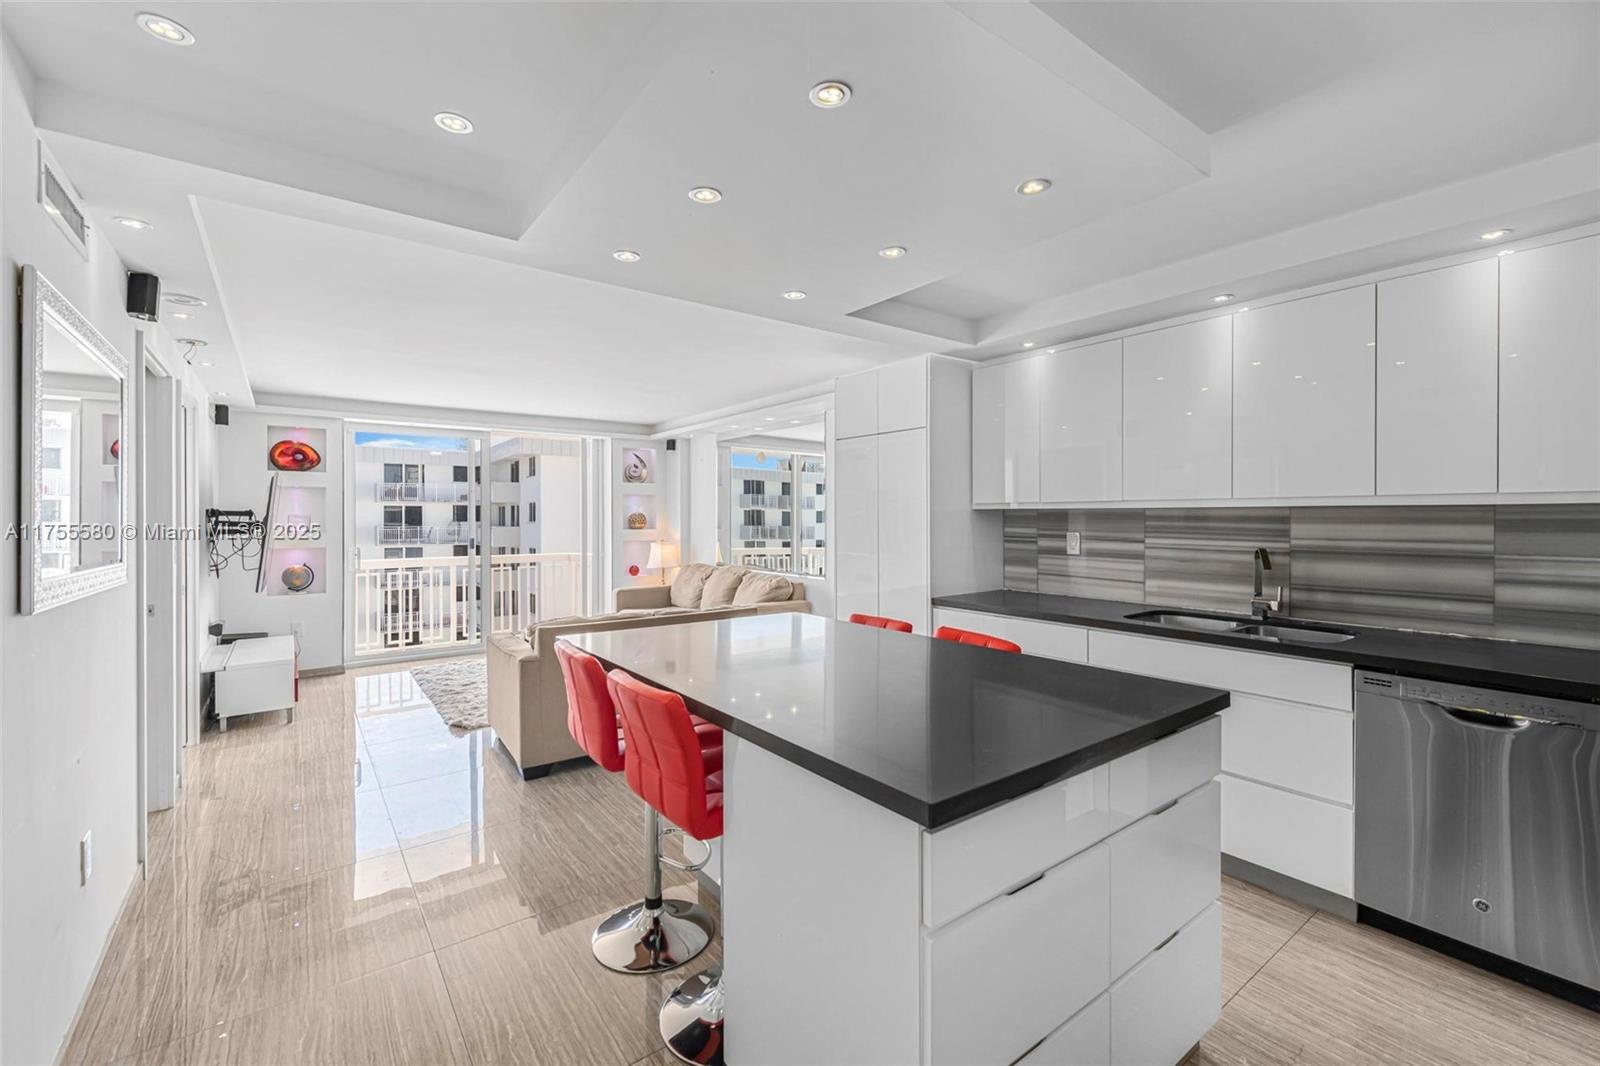
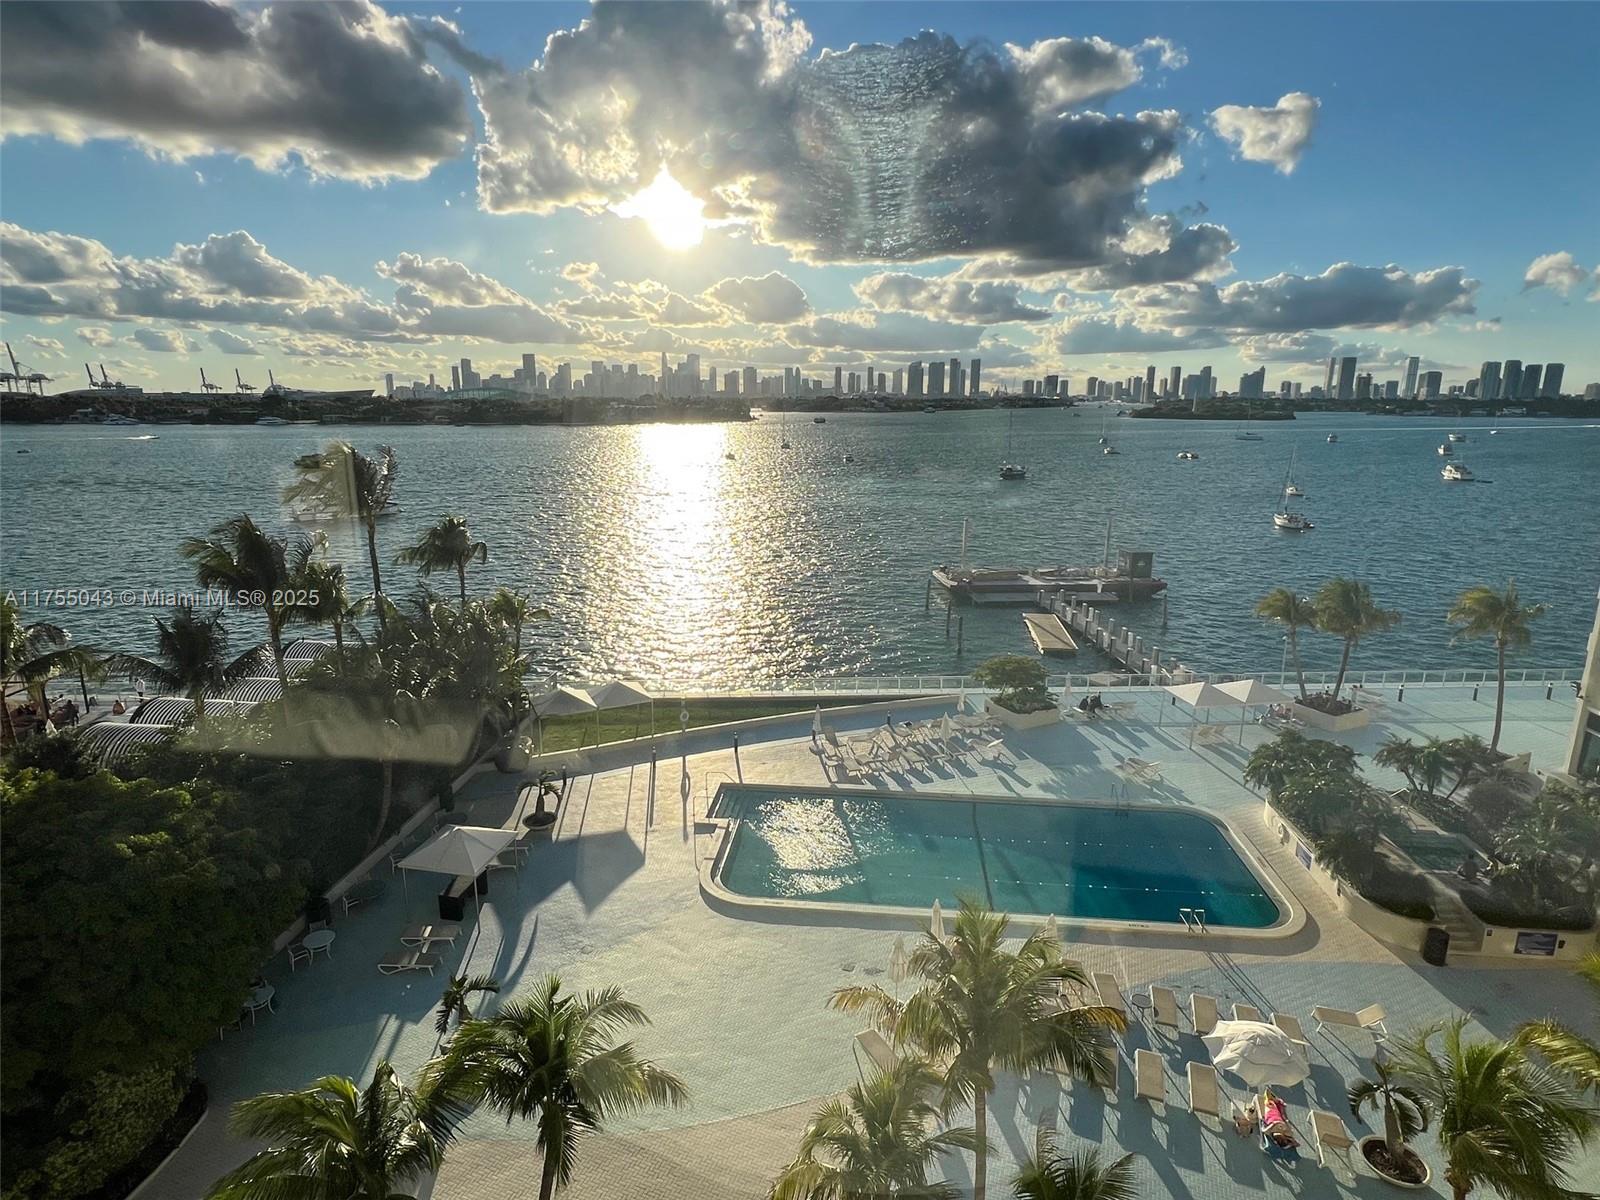
Pending
$405,000
1
bds
|
1
ba
|
659
sqft
|
built
1970
401 Ocean Dr, Miami Beach, FL 33139
$-1,690
Cash flow
-21.8%
Cash-on-Cash Return
1.1%
Cap rate
0.7%
Rent to Value Ratio
Active
$2,699,000
5
bds
|
4
ba
|
3,057
sqft
|
built
1932
5621 Alton Rd, Miami Beach, FL 33140
$-8,355
Cash flow
-16.2%
Cash-on-Cash Return
2.4%
Cap rate
0.4%
Rent to Value Ratio
Active
$1,450,000
2
bds
|
2
ba
|
1,322
sqft
|
built
2004
6365 Collins Ave, Miami Beach, FL 33141
$-5,986
Cash flow
-21.5%
Cash-on-Cash Return
1.2%
Cap rate
0.5%
Rent to Value Ratio
Active
$450,000
2
bds
|
1
ba
|
655
sqft
|
built
1970
401 Ocean Dr, Miami Beach, FL 33139
$-1,754
Cash flow
-20.3%
Cash-on-Cash Return
1.5%
Cap rate
0.7%
Rent to Value Ratio
Active
$900,000
1
bds
|
1
ba
|
760
sqft
|
built
1926
2301 Collins Ave, Miami Beach, FL 33139
$-1,086
Cash flow
-6.3%
Cash-on-Cash Return
4.7%
Cap rate
0.9%
Rent to Value Ratio
Active
$1,895,000
2
bds
|
3
ba
|
1,530
sqft
|
built
1998
1500 Ocean Dr, Miami Beach, FL 33139
$-6,258
Cash flow
-17.2%
Cash-on-Cash Return
2.2%
Cap rate
0.4%
Rent to Value Ratio

Active
$470,000
2
bds
|
2
ba
|
850
sqft
|
built
1980
6444 Collins Ave, Miami Beach, FL 33141
$-1,660
Cash flow
-18.4%
Cash-on-Cash Return
1.9%
Cap rate
0.6%
Rent to Value Ratio
Pending
$275,000
2
bds
|
2
ba
|
1,045
sqft
|
built
1964
7441 Wayne Ave, Miami Beach, FL 33141
$-909
Cash flow
-17.2%
Cash-on-Cash Return
2.2%
Cap rate
0.9%
Rent to Value Ratio
Active
$34,500,000
9
bds
|
10
ba
|
12,190
sqft
|
built
2009
1535 W 27th St, Miami Beach, FL 33140
$-179,205
Cash flow
-27.1%
Cash-on-Cash Return
-0.1%
Cap rate
0.0%
Rent to Value Ratio
Active
$320,000
2
bds
|
2
ba
|
1,030
sqft
|
built
1954
350 S Shore Dr, Miami Beach, FL 33141
$-347
Cash flow
-5.7%
Cash-on-Cash Return
4.8%
Cap rate
0.8%
Rent to Value Ratio

Active
$2,375,000
1
bds
|
2
ba
|
767
sqft
|
built
2004
101 20th St, Miami Beach, FL 33139
$-11,488
Cash flow
-25.2%
Cash-on-Cash Return
0.3%
Cap rate
0.3%
Rent to Value Ratio
Active
$525,000
2
bds
|
1
ba
|
655
sqft
|
built
1970
401 Ocean Dr, Miami Beach, FL 33139
$-1,862
Cash flow
-18.5%
Cash-on-Cash Return
1.9%
Cap rate
0.7%
Rent to Value Ratio
Active
$549,000
2
bds
|
1
ba
|
655
sqft
|
built
1970
401 Ocean Dr, Miami Beach, FL 33139
$-2,192
Cash flow
-20.8%
Cash-on-Cash Return
1.4%
Cap rate
0.6%
Rent to Value Ratio
Active
$680,000
1
bds
|
2
ba
|
994
sqft
|
built
1965
1200 West Ave, Miami Beach, FL 33139
$-2,591
Cash flow
-19.9%
Cash-on-Cash Return
1.6%
Cap rate
0.6%
Rent to Value Ratio
Active
$399,000
1
bds
|
1
ba
|
650
sqft
|
built
1925
929 Michigan Ave, Miami Beach, FL 33139
$-1,386
Cash flow
-18.1%
Cash-on-Cash Return
2.0%
Cap rate
0.6%
Rent to Value Ratio

Active
$1,099,000
1
bds
|
2
ba
|
880
sqft
|
built
1965
100 Lincoln Rd, Miami Beach, FL 33139
$-5,072
Cash flow
-24.1%
Cash-on-Cash Return
0.6%
Cap rate
0.3%
Rent to Value Ratio
Active
$690,000
1
bds
|
2
ba
|
1,122
sqft
|
built
1975
2655 Collins Ave, Miami Beach, FL 33140
$-2,301
Cash flow
-17.4%
Cash-on-Cash Return
2.1%
Cap rate
0.7%
Rent to Value Ratio
Active
$2,099,000
2
bds
|
2
ba
|
1,380
sqft
|
built
2000
4775 Collins Ave, Miami Beach, FL 33140
$-8,870
Cash flow
-22.0%
Cash-on-Cash Return
1.1%
Cap rate
0.4%
Rent to Value Ratio