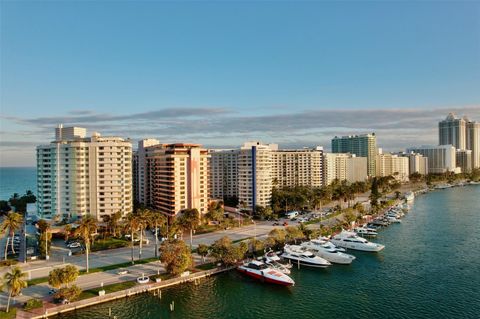
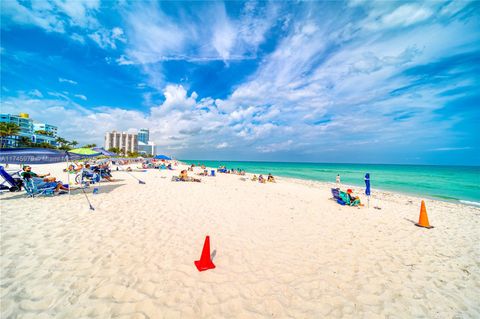
Miami Beach, FL Investment Properties for Sale
Browse homes for sale and investment properties in Miami Beach, FL. Refine your search by price, property type, or more.
Best cash flowing properties in Miami Beach, FL

Active
$290,000
1
bds
|
1
ba
|
519
sqft
|
built
1945
1560 Meridian Ave, Miami Beach, FL 33139
$-367
Cash flow
-6.6%
Cash-on-Cash Return
4.6%
Cap rate
1.0%
Rent to Value Ratio

Active
$299,000
1
bds
|
1
ba
|
790
sqft
|
built
1966
1662 Lincoln Ct, Miami Beach, FL 33139
$-713
Cash flow
-12.4%
Cash-on-Cash Return
3.3%
Cap rate
0.9%
Rent to Value Ratio
1,940 out of 2,138 properties for sale in Miami Beach, FL
Limited Results Shown
Create a free account, or log in to reveal all property listings and enjoy the complete experience.
Active
$525,000
2
bds
|
2
ba
|
960
sqft
|
built
1962
5225 Collins Ave, Miami Beach, FL 33140
$-2,155
Cash flow
-21.4%
Cash-on-Cash Return
1.2%
Cap rate
0.8%
Rent to Value Ratio

Active
$340,000
1
bds
|
1
ba
|
556
sqft
|
built
1936
435 21st St, Miami Beach, FL 33139
$-1,314
Cash flow
-20.2%
Cash-on-Cash Return
1.5%
Cap rate
0.7%
Rent to Value Ratio

Active
$235,000
1
bds
|
1
ba
|
453
sqft
|
built
2015
801 8th St, Miami Beach, FL 33139
$-835
Cash flow
-18.5%
Cash-on-Cash Return
1.9%
Cap rate
0.9%
Rent to Value Ratio
Active
$2,295,000
3
bds
|
3
ba
|
1,580
sqft
|
built
1967
5555 Collins Ave, Miami Beach, FL 33140
$-10,615
Cash flow
-24.1%
Cash-on-Cash Return
0.6%
Cap rate
0.3%
Rent to Value Ratio

Active
$4,600,000
4
bds
|
4
ba
|
3,539
sqft
|
built
2010
114 4th Rivo Alto Ter, Miami Beach, FL 33139
$-21,745
Cash flow
-24.7%
Cash-on-Cash Return
0.5%
Cap rate
0.2%
Rent to Value Ratio
Active
$425,000
1
bds
|
1
ba
|
665
sqft
|
built
1969
465 Ocean Dr, Miami Beach, FL 33139
$-888
Cash flow
-10.9%
Cash-on-Cash Return
3.6%
Cap rate
0.8%
Rent to Value Ratio
Active
$299,000
1
bds
|
1
ba
|
450
sqft
|
built
1937
1460 Ocean Dr, Miami Beach, FL 33139
$-724
Cash flow
-12.6%
Cash-on-Cash Return
3.2%
Cap rate
0.9%
Rent to Value Ratio
Active
$299,000
1
bds
|
1
ba
|
790
sqft
|
built
1966
1662 Lincoln Ct, Miami Beach, FL 33139
$-713
Cash flow
-12.4%
Cash-on-Cash Return
3.3%
Cap rate
0.9%
Rent to Value Ratio
Active
$325,000
1
bds
|
1
ba
|
810
sqft
|
built
1969
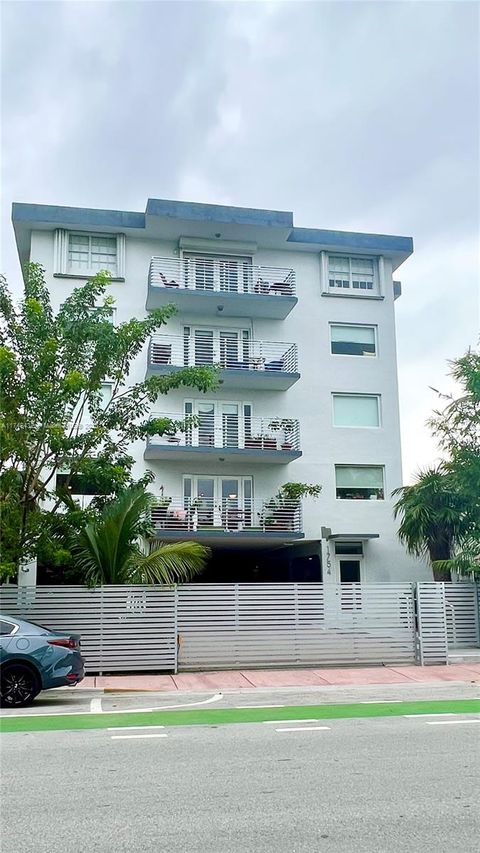
1754 Meridian Ave, Miami Beach, FL 33139
$-919
Cash flow
-14.8%
Cash-on-Cash Return
2.8%
Cap rate
0.8%
Rent to Value Ratio

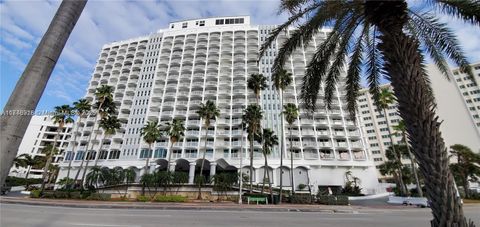
Active
$560,000
1
bds
|
2
ba
|
890
sqft
|
built
1965
100 Lincoln Rd, Miami Beach, FL 33139
$-2,552
Cash flow
-23.8%
Cash-on-Cash Return
0.7%
Cap rate
0.6%
Rent to Value Ratio
Active
$675,000
2
bds
|
3
ba
|
980
sqft
|
built
1967
5401 Collins Ave, Miami Beach, FL 33140
$-2,974
Cash flow
-23.0%
Cash-on-Cash Return
0.9%
Cap rate
0.5%
Rent to Value Ratio
Active
$448,000
2
bds
|
2
ba
|
1,262
sqft
|
built
1968
6450 Collins Ave, Miami Beach, FL 33141
$-2,912
Cash flow
-33.9%
Cash-on-Cash Return
-1.7%
Cap rate
0.3%
Rent to Value Ratio

Active
$750,000
1
bds
|
2
ba
|
1,109
sqft
|
built
2004
7600 Collins Ave, Miami Beach, FL 33141
$-3,205
Cash flow
-22.3%
Cash-on-Cash Return
1.0%
Cap rate
0.5%
Rent to Value Ratio

Active
$400,000
bds
|
1
ba
|
400
sqft
|
built
1966
5445 Collins Ave, Miami Beach, FL 33140
$-1,870
Cash flow
-24.4%
Cash-on-Cash Return
0.5%
Cap rate
0.6%
Rent to Value Ratio

Active
$6,550,000
4
bds
|
3
ba
|
3,650
sqft
|
built
1953
765 N Shore Dr, Miami Beach, FL 33141
$-28,277
Cash flow
-22.5%
Cash-on-Cash Return
1.0%
Cap rate
0.1%
Rent to Value Ratio
Active
$4,900,000
4
bds
|
5
ba
|
3,280
sqft
|
built
2015
335 W 46th St, Miami Beach, FL 33140
$-22,178
Cash flow
-23.6%
Cash-on-Cash Return
0.7%
Cap rate
0.2%
Rent to Value Ratio

Active
$5,600,000
4
bds
|
5
ba
|
3,807
sqft
|
built
2005
5959 Collins Ave, Miami Beach, FL 33140
$-33,540
Cash flow
-31.2%
Cash-on-Cash Return
-1.0%
Cap rate
0.2%
Rent to Value Ratio

Active
$400,000
bds
|
1
ba
|
400
sqft
|
built
1966
5445 Collins Ave, Miami Beach, FL 33140
$-1,851
Cash flow
-24.1%
Cash-on-Cash Return
0.6%
Cap rate
0.7%
Rent to Value Ratio

Active
$799,000
2
bds
|
2
ba
|
1,070
sqft
|
built
1997
1621 Bay Rd, Miami Beach, FL 33139
$-2,840
Cash flow
-18.5%
Cash-on-Cash Return
1.9%
Cap rate
0.6%
Rent to Value Ratio

Active
$315,000
1
bds
|
2
ba
|
750
sqft
|
built
1973
1821 Jefferson Ave, Miami Beach, FL 33139
$-882
Cash flow
-14.6%
Cash-on-Cash Return
2.8%
Cap rate
0.7%
Rent to Value Ratio

Active
$529,900
2
bds
|
2
ba
|
840
sqft
|
built
1940
930 10th St, Miami Beach, FL 33139
$-1,406
Cash flow
-13.8%
Cash-on-Cash Return
3.0%
Cap rate
0.7%
Rent to Value Ratio

Active
$400,000
bds
|
1
ba
|
400
sqft
|
built
1966
5445 Collins Ave, Miami Beach, FL 33140
$-1,703
Cash flow
-22.2%
Cash-on-Cash Return
1.0%
Cap rate
0.7%
Rent to Value Ratio

Active
$269,000
bds
|
1
ba
|
340
sqft
|
built
1966
5445 Collins Ave, Miami Beach, FL 33140
$-1,477
Cash flow
-28.6%
Cash-on-Cash Return
-0.4%
Cap rate
0.7%
Rent to Value Ratio

Active
$269,000
bds
|
1
ba
|
400
sqft
|
built
1966
5445 Collins Ave, Miami Beach, FL 33140
$-1,398
Cash flow
-27.1%
Cash-on-Cash Return
-0.1%
Cap rate
0.7%
Rent to Value Ratio
Active
$290,000
1
bds
|
1
ba
|
519
sqft
|
built
1945
1560 Meridian Ave, Miami Beach, FL 33139
$-367
Cash flow
-6.6%
Cash-on-Cash Return
4.6%
Cap rate
1.0%
Rent to Value Ratio

Active
$4,995,000
5
bds
|
5
ba
|
3,274
sqft
|
built
1934
2153 N Bay Rd, Miami Beach, FL 33140
$-23,226
Cash flow
-24.3%
Cash-on-Cash Return
0.6%
Cap rate
0.2%
Rent to Value Ratio

Active
$1,390,000
2
bds
|
2
ba
|
1,410
sqft
|
built
1999
7330 Ocean Ter, Miami Beach, FL 33141
$-5,135
Cash flow
-19.3%
Cash-on-Cash Return
1.7%
Cap rate
0.5%
Rent to Value Ratio

Active
$2,300,000
3
bds
|
3
ba
|
2,254
sqft
|
built
1950
900 N Shore Dr, Miami Beach, FL 33141
$-7,189
Cash flow
-16.3%
Cash-on-Cash Return
2.4%
Cap rate
0.3%
Rent to Value Ratio

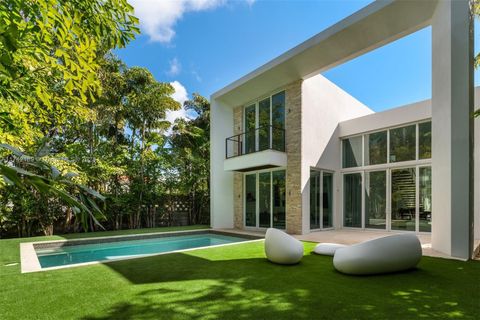
Active
$2,750,000
4
bds
|
4
ba
|
2,977
sqft
|
built
1938
4421 Post Ave, Miami Beach, FL 33140
$-7,661
Cash flow
-14.5%
Cash-on-Cash Return
2.8%
Cap rate
0.4%
Rent to Value Ratio

Active
$355,000
2
bds
|
2
ba
|
700
sqft
|
built
1931
750 Pennsylvania Ave, Miami Beach, FL 33139
$-905
Cash flow
-13.3%
Cash-on-Cash Return
3.1%
Cap rate
0.8%
Rent to Value Ratio

Active
$345,000
1
bds
|
2
ba
|
770
sqft
|
built
1969
1340 Lincoln Rd, Miami Beach, FL 33139
$-801
Cash flow
-12.1%
Cash-on-Cash Return
3.4%
Cap rate
0.8%
Rent to Value Ratio
Active
$854,000
2
bds
|
2
ba
|
1,190
sqft
|
built
1991
6767 Collins Ave, Miami Beach, FL 33141
$-2,201
Cash flow
-13.4%
Cash-on-Cash Return
3.1%
Cap rate
0.7%
Rent to Value Ratio
Active
$380,000
1
bds
|
2
ba
|
885
sqft
|
built
1980
6445 Indian Creek Dr, Miami Beach, FL 33141
$-1,308
Cash flow
-18.0%
Cash-on-Cash Return
2.0%
Cap rate
0.6%
Rent to Value Ratio
Active
$305,000
1
bds
|
1
ba
|
607
sqft
|
built
1951
1341 15th St, Miami Beach, FL 33139
$-774
Cash flow
-13.2%
Cash-on-Cash Return
3.1%
Cap rate
0.8%
Rent to Value Ratio

Active
$1,390,000
bds
|
1
ba
|
491
sqft
|
built
2009
2201 Collins Ave, Miami Beach, FL 33139
$-7,225
Cash flow
-27.1%
Cash-on-Cash Return
-0.1%
Cap rate
0.4%
Rent to Value Ratio

Active
$4,500,000
3
bds
|
4
ba
|
2,570
sqft
|
built
2016
1 Collins Ave, Miami Beach, FL 33139
$-29,031
Cash flow
-33.7%
Cash-on-Cash Return
-1.6%
Cap rate
0.2%
Rent to Value Ratio

Active
$499,990
2
bds
|
2
ba
|
1,362
sqft
|
built
1968
5750 Collins Ave, Miami Beach, FL 33140
$-1,222
Cash flow
-12.8%
Cash-on-Cash Return
3.2%
Cap rate
0.7%
Rent to Value Ratio

Active
$299,900
1
bds
|
1
ba
|
667
sqft
|
built
1965
1620 West Ave, Miami Beach, FL 33139
$-1,108
Cash flow
-19.3%
Cash-on-Cash Return
1.7%
Cap rate
0.7%
Rent to Value Ratio

Active
$3,950,000
4
bds
|
4
ba
|
2,842
sqft
|
built
1959
1155 S Biscayne Point Rd, Miami Beach, FL 33141
$-14,018
Cash flow
-18.5%
Cash-on-Cash Return
1.9%
Cap rate
0.3%
Rent to Value Ratio
Active
$1,350,000
1
bds
|
2
ba
|
880
sqft
|
built
1926
2301 Collins Ave, Miami Beach, FL 33139
$-5,302
Cash flow
-20.5%
Cash-on-Cash Return
1.4%
Cap rate
0.5%
Rent to Value Ratio