Miami Beach, FL Investment Properties for Sale
Browse homes for sale and investment properties in Miami Beach, FL. Refine your search by price, property type, or more.
Best cash flowing properties in Miami Beach, FL
Active
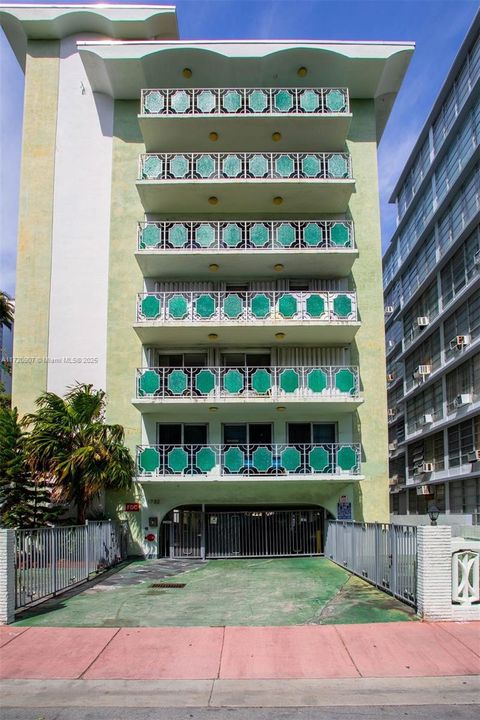
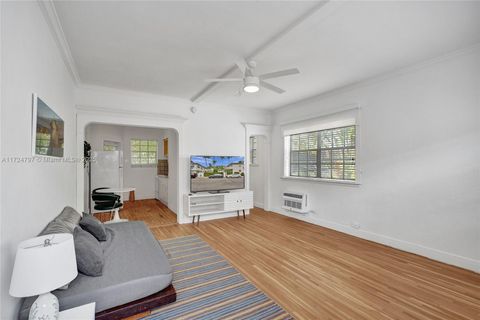
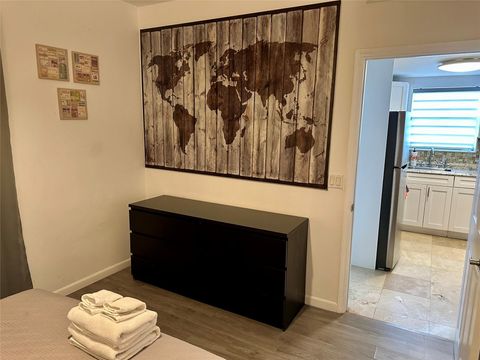
$325,000
1
bds
|
1
ba
|
694
sqft
|
built
1965
1732 Meridian Ave, Miami Beach, FL 33139
$-482
Cash flow
-7.7%
Cash-on-Cash Return
4.4%
Cap rate
0.7%
Rent to Value Ratio
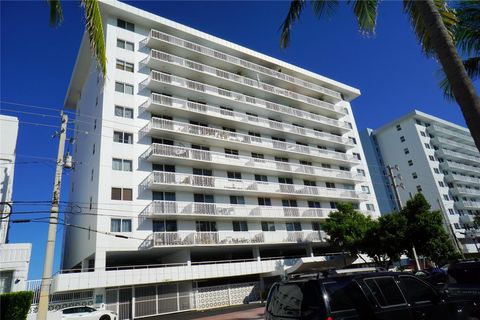
Active
$238,500
bds
|
1
ba
|
398
sqft
|
built
1959
717 Espanola Way, Miami Beach, FL 33139
$-536
Cash flow
-11.7%
Cash-on-Cash Return
3.5%
Cap rate
0.8%
Rent to Value Ratio
1,927 out of 2,124 properties for sale in Miami Beach, FL
Limited Results Shown
Create a free account, or log in to reveal all property listings and enjoy the complete experience.

Active
$335,000
1
bds
|
2
ba
|
718
sqft
|
built
1980
1612 Jefferson Ave, Miami Beach, FL 33139
$-694
Cash flow
-10.8%
Cash-on-Cash Return
3.7%
Cap rate
0.6%
Rent to Value Ratio

Active
$1,750,000
1
bds
|
1
ba
|
880
sqft
|
built
1926
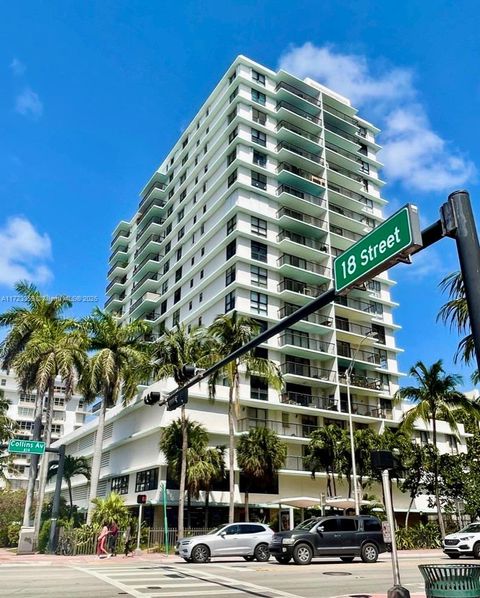
2301 Collins Ave, Miami Beach, FL 33139
$-6,019
Cash flow
-17.9%
Cash-on-Cash Return
2.0%
Cap rate
0.5%
Rent to Value Ratio

Active
$925,000
1
bds
|
1
ba
|
892
sqft
|
built
1940
8101 Harding Ave, Miami Beach, FL 33141
$-3,538
Cash flow
-20.0%
Cash-on-Cash Return
1.6%
Cap rate
0.3%
Rent to Value Ratio

Active
$452,000
1
bds
|
2
ba
|
824
sqft
|
built
1969
5701 Collins Ave, Miami Beach, FL 33140
$-2,044
Cash flow
-23.6%
Cash-on-Cash Return
0.7%
Cap rate
0.6%
Rent to Value Ratio

Active
$310,999
1
bds
|
1
ba
|
678
sqft
|
built
1963
900 Bay Dr, Miami Beach, FL 33141
$-812
Cash flow
-13.6%
Cash-on-Cash Return
3.0%
Cap rate
0.8%
Rent to Value Ratio
Active
$475,000
2
bds
|
1
ba
|
840
sqft
|
built
1935
2615 Collins Ave, Miami Beach, FL 33140
$-1,640
Cash flow
-18.0%
Cash-on-Cash Return
2.0%
Cap rate
0.7%
Rent to Value Ratio
Active
$399,000
1
bds
|
1
ba
|
667
sqft
|
built
1970
401 Ocean Dr, Miami Beach, FL 33139
$-1,580
Cash flow
-20.7%
Cash-on-Cash Return
1.4%
Cap rate
0.7%
Rent to Value Ratio
Active
$238,500
bds
|
1
ba
|
398
sqft
|
built
1959
717 Espanola Way, Miami Beach, FL 33139
$-536
Cash flow
-11.7%
Cash-on-Cash Return
3.5%
Cap rate
0.8%
Rent to Value Ratio
Active
$399,000
2
bds
|
2
ba
|
890
sqft
|
built
1983
1775 Washington Ave, Miami Beach, FL 33139
$-1,810
Cash flow
-23.7%
Cash-on-Cash Return
0.7%
Cap rate
0.8%
Rent to Value Ratio
Active
$379,900
2
bds
|
2
ba
|
890
sqft
|
built
1937
1460 Ocean Dr, Miami Beach, FL 33139
$-1,569
Cash flow
-21.5%
Cash-on-Cash Return
1.2%
Cap rate
0.8%
Rent to Value Ratio
Active
$750,000
1
bds
|
2
ba
|
808
sqft
|
built
2004
6365 Collins Ave, Miami Beach, FL 33141
$-3,016
Cash flow
-21.0%
Cash-on-Cash Return
1.3%
Cap rate
0.5%
Rent to Value Ratio
Active
$800,000
2
bds
|
2
ba
|
1,084
sqft
|
built
2001
1330 West Ave, Miami Beach, FL 33139
$-1,201
Cash flow
-7.8%
Cash-on-Cash Return
4.3%
Cap rate
0.7%
Rent to Value Ratio
Active
$1,695,000
2
bds
|
2
ba
|
1,151
sqft
|
built
1999
90 Alton Rd, Miami Beach, FL 33139
$-4,589
Cash flow
-14.1%
Cash-on-Cash Return
2.9%
Cap rate
0.5%
Rent to Value Ratio
Active
$1,375,000
2
bds
|
2
ba
|
1,410
sqft
|
built
1999
7330 Ocean Ter, Miami Beach, FL 33141
$-4,932
Cash flow
-18.7%
Cash-on-Cash Return
1.8%
Cap rate
0.5%
Rent to Value Ratio

Active
$899,000
2
bds
|
2
ba
|
1,078
sqft
|
built
1997
650 West Ave, Miami Beach, FL 33139
$-3,195
Cash flow
-18.5%
Cash-on-Cash Return
1.9%
Cap rate
0.6%
Rent to Value Ratio
Active
$324,900
1
bds
|
1
ba
|
739
sqft
|
built
1965
900 Euclid Ave, Miami Beach, FL 33139
$-964
Cash flow
-15.5%
Cash-on-Cash Return
2.6%
Cap rate
0.8%
Rent to Value Ratio

Active
$259,000
2
bds
|
2
ba
|
975
sqft
|
built
1978
7125 Bonita Dr, Miami Beach, FL 33141
$-641
Cash flow
-12.9%
Cash-on-Cash Return
3.2%
Cap rate
1.0%
Rent to Value Ratio
Active
$259,000
1
bds
|
1
ba
|
922
sqft
|
built
1970
401 69th St, Miami Beach, FL 33141
$-957
Cash flow
-19.3%
Cash-on-Cash Return
1.7%
Cap rate
1.0%
Rent to Value Ratio

Active
$1,500,000
2
bds
|
2
ba
|
1,280
sqft
|
built
2006
3801 Collins Ave, Miami Beach, FL 33140
$-6,953
Cash flow
-24.2%
Cash-on-Cash Return
0.6%
Cap rate
0.5%
Rent to Value Ratio
Active
$1,950,000
2
bds
|
2
ba
|
1,392
sqft
|
built
2004
6365 Collins Ave, Miami Beach, FL 33141
$-8,137
Cash flow
-21.8%
Cash-on-Cash Return
1.1%
Cap rate
0.4%
Rent to Value Ratio

Active
$715,000
1
bds
|
2
ba
|
808
sqft
|
built
2004
6365 Collins Ave, Miami Beach, FL 33141
$-2,027
Cash flow
-14.8%
Cash-on-Cash Return
2.7%
Cap rate
0.7%
Rent to Value Ratio
Active
$525,000
1
bds
|
2
ba
|
950
sqft
|
built
1967
5 Island Ave, Miami Beach, FL 33139
$-2,202
Cash flow
-21.9%
Cash-on-Cash Return
1.1%
Cap rate
0.8%
Rent to Value Ratio
Active
$675,000
3
bds
|
2
ba
|
1,385
sqft
|
built
1964
5005 Collins Ave, Miami Beach, FL 33140
$-2,977
Cash flow
-23.0%
Cash-on-Cash Return
0.9%
Cap rate
0.7%
Rent to Value Ratio

Active
$545,000
bds
|
1
ba
|
525
sqft
|
built
1965
100 Lincoln Rd, Miami Beach, FL 33139
$-2,412
Cash flow
-23.1%
Cash-on-Cash Return
0.8%
Cap rate
0.5%
Rent to Value Ratio
Active
$325,000
1
bds
|
1
ba
|
694
sqft
|
built
1965
1732 Meridian Ave, Miami Beach, FL 33139
$-482
Cash flow
-7.7%
Cash-on-Cash Return
4.4%
Cap rate
0.7%
Rent to Value Ratio
Active
$1,175,000
2
bds
|
2
ba
|
1,250
sqft
|
built
1996
6301 Collins Ave, Miami Beach, FL 33141
$-3,765
Cash flow
-16.7%
Cash-on-Cash Return
2.3%
Cap rate
0.6%
Rent to Value Ratio
Active
$3,100,000
2
bds
|
3
ba
|
1,421
sqft
|
built
2008
3737 Collins Ave, Miami Beach, FL 33140
$-14,454
Cash flow
-24.3%
Cash-on-Cash Return
0.6%
Cap rate
0.3%
Rent to Value Ratio
Active
$598,900
1
bds
|
2
ba
|
1,225
sqft
|
built
1967
5001 Collins Ave, Miami Beach, FL 33140
$-2,904
Cash flow
-25.3%
Cash-on-Cash Return
0.3%
Cap rate
0.6%
Rent to Value Ratio

Active
$15,900,000
5
bds
|
7
ba
|
5,406
sqft
|
built
2014
528 Lakeview Ct, Miami Beach, FL 33140
$-87,927
Cash flow
-28.9%
Cash-on-Cash Return
-0.5%
Cap rate
0.1%
Rent to Value Ratio
Active
$530,000
1
bds
|
1
ba
|
694
sqft
|
built
2008
1100 West Ave, Miami Beach, FL 33139
$-2,527
Cash flow
-24.9%
Cash-on-Cash Return
0.4%
Cap rate
0.8%
Rent to Value Ratio
Active
$280,000
2
bds
|
2
ba
|
870
sqft
|
built
1979
1960 Marseille Dr, Miami Beach, FL 33141
$-651
Cash flow
-12.1%
Cash-on-Cash Return
3.4%
Cap rate
0.9%
Rent to Value Ratio
Active
$450,000
1
bds
|
2
ba
|
876
sqft
|
built
1975
1800 Collins Ave, Miami Beach, FL 33139
$-766
Cash flow
-8.9%
Cash-on-Cash Return
4.1%
Cap rate
0.6%
Rent to Value Ratio
Active
$349,000
1
bds
|
1
ba
|
596
sqft
|
built
1936
435 21st St, Miami Beach, FL 33139
$-1,294
Cash flow
-19.3%
Cash-on-Cash Return
1.7%
Cap rate
0.8%
Rent to Value Ratio
Active
$4,450,000
3
bds
|
4
ba
|
2,843
sqft
|
built
1946
200 E Rivo Alto Dr, Miami Beach, FL 33139
$-20,456
Cash flow
-24.0%
Cash-on-Cash Return
0.6%
Cap rate
0.2%
Rent to Value Ratio
Active
$373,000
1
bds
|
1
ba
|
942
sqft
|
built
1964
5005 Collins Ave, Miami Beach, FL 33140
$-2,197
Cash flow
-30.7%
Cash-on-Cash Return
-0.9%
Cap rate
0.7%
Rent to Value Ratio

Active
$999,999
1
bds
|
2
ba
|
833
sqft
|
built
2008
5875 Collins Ave, Miami Beach, FL 33140
$-4,701
Cash flow
-24.5%
Cash-on-Cash Return
0.5%
Cap rate
0.5%
Rent to Value Ratio

Active
$870,000
1
bds
|
2
ba
|
861
sqft
|
built
1982
2555 Collins Ave, Miami Beach, FL 33140
$-3,113
Cash flow
-18.7%
Cash-on-Cash Return
1.9%
Cap rate
0.5%
Rent to Value Ratio

Active
$389,900
1
bds
|
2
ba
|
917
sqft
|
built
1975
1800 Collins Ave, Miami Beach, FL 33139
$-1,068
Cash flow
-14.3%
Cash-on-Cash Return
2.9%
Cap rate
0.8%
Rent to Value Ratio

Active
$299,000
bds
|
1
ba
|
543
sqft
|
built
1968
1000 West Ave, Miami Beach, FL 33139
$-1,045
Cash flow
-18.2%
Cash-on-Cash Return
2.0%
Cap rate
0.8%
Rent to Value Ratio
Active
$275,000
1
bds
|
1
ba
|
454
sqft
|
built
1952
1840 James Ave, Miami Beach, FL 33139
$-686
Cash flow
-13.0%
Cash-on-Cash Return
3.2%
Cap rate
0.8%
Rent to Value Ratio