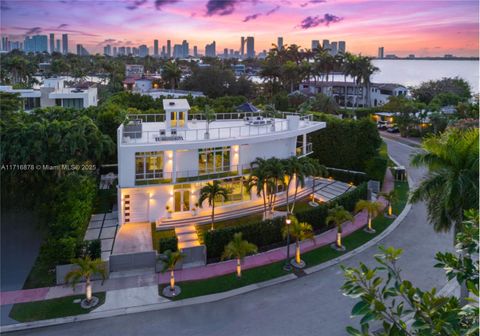
Miami Beach, FL Investment Properties for Sale
Browse homes for sale and investment properties in Miami Beach, FL. Refine your search by price, property type, or more.
Best cash flowing properties in Miami Beach, FL

Active
$230,000
bds
|
1
ba
|
401
sqft
|
built
1960
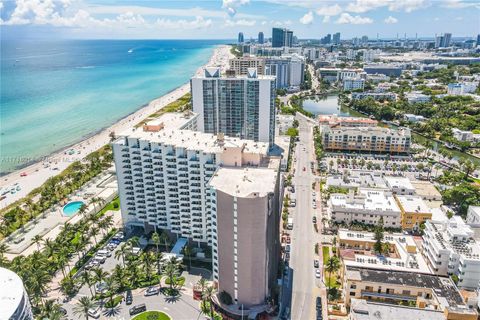
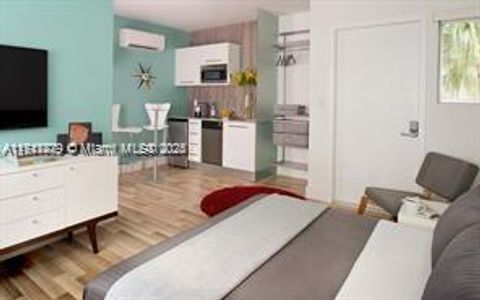
4015 Indian Creek Dr, Miami Beach, FL 33140
$78
Cash flow
1.8%
Cash-on-Cash Return
6.6%
Cap rate
1.1%
Rent to Value Ratio
Active
$275,000
bds
|
1
ba
|
0
sqft
|
built
1936
721 14th Pl, Miami Beach, FL 33139
$-487
Cash flow
-9.2%
Cash-on-Cash Return
4.0%
Cap rate
0.7%
Rent to Value Ratio
2,024 out of 2,234 properties for sale in Miami Beach, FL
Limited Results Shown
Create a free account, or log in to reveal all property listings and enjoy the complete experience.

Active
$320,000
1
bds
|
1
ba
|
737
sqft
|
built
1945
1000 Meridian Ave, Miami Beach, FL 33139
$-820
Cash flow
-13.4%
Cash-on-Cash Return
3.1%
Cap rate
0.8%
Rent to Value Ratio
Active
$400,000
2
bds
|
2
ba
|
930
sqft
|
built
1925
1027 Pennsylvania Ave, Miami Beach, FL 33139
$-1,159
Cash flow
-15.1%
Cash-on-Cash Return
2.7%
Cap rate
0.8%
Rent to Value Ratio

Active
$689,000
1
bds
|
2
ba
|
962
sqft
|
built
1968
1000 West Ave, Miami Beach, FL 33139
$-1,989
Cash flow
-15.1%
Cash-on-Cash Return
2.7%
Cap rate
0.6%
Rent to Value Ratio

Active
$1,890,000
2
bds
|
2
ba
|
1,490
sqft
|
built
2000
4779 Collins Ave, Miami Beach, FL 33140
$-7,391
Cash flow
-20.4%
Cash-on-Cash Return
1.5%
Cap rate
0.5%
Rent to Value Ratio

Active
$1,750,000
2
bds
|
2
ba
|
1,147
sqft
|
built
1997
650 West Ave, Miami Beach, FL 33139
$-6,534
Cash flow
-19.5%
Cash-on-Cash Return
1.7%
Cap rate
0.4%
Rent to Value Ratio

Active
$839,000
1
bds
|
2
ba
|
894
sqft
|
built
1941
1250 Ocean Dr, Miami Beach, FL 33139
$-3,366
Cash flow
-20.9%
Cash-on-Cash Return
1.3%
Cap rate
0.6%
Rent to Value Ratio
Active
$275,000
bds
|
1
ba
|
0
sqft
|
built
1936
721 14th Pl, Miami Beach, FL 33139
$-487
Cash flow
-9.2%
Cash-on-Cash Return
4.0%
Cap rate
0.7%
Rent to Value Ratio
Active
$1,500,000
3
bds
|
2
ba
|
1,372
sqft
|
built
1997
650 West Ave, Miami Beach, FL 33139
$-4,945
Cash flow
-17.2%
Cash-on-Cash Return
2.2%
Cap rate
0.6%
Rent to Value Ratio
Active
$38,000,000
6
bds
|
7
ba
|
6,701
sqft
|
built
2022
1061 N Venetian Dr, Miami Beach, FL 33139
$-203,277
Cash flow
-27.9%
Cash-on-Cash Return
-0.3%
Cap rate
0.0%
Rent to Value Ratio
Active
$389,000
2
bds
|
2
ba
|
1,180
sqft
|
built
1945
1980 Bay Dr, Miami Beach, FL 33141
$-798
Cash flow
-10.7%
Cash-on-Cash Return
3.7%
Cap rate
0.9%
Rent to Value Ratio
Active
$349,500
1
bds
|
2
ba
|
1,003
sqft
|
built
1963
900 Bay Dr, Miami Beach, FL 33141
$-1,420
Cash flow
-21.2%
Cash-on-Cash Return
1.3%
Cap rate
0.8%
Rent to Value Ratio
Active
$375,000
1
bds
|
1
ba
|
633
sqft
|
built
1971
6969 Collins Ave, Miami Beach, FL 33141
$-903
Cash flow
-12.6%
Cash-on-Cash Return
3.3%
Cap rate
0.7%
Rent to Value Ratio

Active
$875,000
2
bds
|
2
ba
|
1,455
sqft
|
built
1970
7135 Collins Ave, Miami Beach, FL 33141
$-3,388
Cash flow
-20.2%
Cash-on-Cash Return
1.5%
Cap rate
0.5%
Rent to Value Ratio
Active
$665,000
2
bds
|
2
ba
|
1,320
sqft
|
built
1969
5701 Collins Ave, Miami Beach, FL 33140
$-3,129
Cash flow
-24.5%
Cash-on-Cash Return
0.5%
Cap rate
0.6%
Rent to Value Ratio
Active
$555,000
2
bds
|
2
ba
|
1,286
sqft
|
built
1966
2899 Collins Ave, Miami Beach, FL 33140
$-1,895
Cash flow
-17.8%
Cash-on-Cash Return
2.0%
Cap rate
0.7%
Rent to Value Ratio

Active
$499,000
2
bds
|
1
ba
|
851
sqft
|
built
1956
1816 Meridian Ave, Miami Beach, FL 33139
$-1,716
Cash flow
-17.9%
Cash-on-Cash Return
2.0%
Cap rate
0.7%
Rent to Value Ratio
Active
$599,000
2
bds
|
1
ba
|
812
sqft
|
built
1956
1816 Meridian Ave, Miami Beach, FL 33139
$-2,109
Cash flow
-18.4%
Cash-on-Cash Return
1.9%
Cap rate
0.6%
Rent to Value Ratio

Active
$499,000
2
bds
|
1
ba
|
820
sqft
|
built
1956
1816 Meridian Ave, Miami Beach, FL 33139
$-1,675
Cash flow
-17.5%
Cash-on-Cash Return
2.1%
Cap rate
0.7%
Rent to Value Ratio
Active
$430,000
2
bds
|
2
ba
|
940
sqft
|
built
1966
1881 Washington Ave, Miami Beach, FL 33139
$-1,423
Cash flow
-17.3%
Cash-on-Cash Return
2.2%
Cap rate
0.8%
Rent to Value Ratio
Active
$375,000
2
bds
|
1
ba
|
720
sqft
|
built
1936
1219 Meridian Ave, Miami Beach, FL 33139
$-1,448
Cash flow
-20.1%
Cash-on-Cash Return
1.5%
Cap rate
0.7%
Rent to Value Ratio

Active
$3,750,000
3
bds
|
4
ba
|
2,643
sqft
|
built
2003
400 Alton Rd, Miami Beach, FL 33139
$-18,324
Cash flow
-25.5%
Cash-on-Cash Return
0.3%
Cap rate
0.3%
Rent to Value Ratio

Active
$1,550,000
3
bds
|
2
ba
|
1,234
sqft
|
built
1997
650 West Ave, Miami Beach, FL 33139
$-5,751
Cash flow
-19.4%
Cash-on-Cash Return
1.7%
Cap rate
0.6%
Rent to Value Ratio
Active
$6,299,000
5
bds
|
6
ba
|
3,406
sqft
|
built
2014
412 E Rivo Alto Dr, Miami Beach, FL 33139
$-28,645
Cash flow
-23.7%
Cash-on-Cash Return
0.7%
Cap rate
0.2%
Rent to Value Ratio
Active
$355,000
1
bds
|
1
ba
|
810
sqft
|
built
1969
1754 Meridian Ave, Miami Beach, FL 33139
$-1,046
Cash flow
-15.4%
Cash-on-Cash Return
2.6%
Cap rate
0.7%
Rent to Value Ratio

Active
$1,250,000
2
bds
|
2
ba
|
1,200
sqft
|
built
2008
6801 Collins Ave, Miami Beach, FL 33141
$-4,665
Cash flow
-19.5%
Cash-on-Cash Return
1.7%
Cap rate
0.4%
Rent to Value Ratio

Active
$745,000
2
bds
|
2
ba
|
914
sqft
|
built
1926
130 3rd St, Miami Beach, FL 33139
$-1,912
Cash flow
-13.4%
Cash-on-Cash Return
3.1%
Cap rate
0.6%
Rent to Value Ratio
Active
$540,000
1
bds
|
1
ba
|
852
sqft
|
built
1968
1000 West Ave, Miami Beach, FL 33139
$-1,892
Cash flow
-18.3%
Cash-on-Cash Return
1.9%
Cap rate
0.6%
Rent to Value Ratio
Active
$480,000
1
bds
|
1
ba
|
723
sqft
|
built
1966
1670 Lincoln Ct, Miami Beach, FL 33139
$-1,595
Cash flow
-17.3%
Cash-on-Cash Return
2.2%
Cap rate
0.7%
Rent to Value Ratio

Active
$399,000
1
bds
|
1
ba
|
437
sqft
|
built
2019
6080 Collins Ave, Miami Beach, FL 33140
$-1,349
Cash flow
-17.6%
Cash-on-Cash Return
2.1%
Cap rate
0.8%
Rent to Value Ratio
Active
$575,000
1
bds
|
2
ba
|
750
sqft
|
built
1995
1688 West Ave, Miami Beach, FL 33139
$-2,098
Cash flow
-19.0%
Cash-on-Cash Return
1.8%
Cap rate
0.5%
Rent to Value Ratio

Active
$314,900
bds
|
1
ba
|
781
sqft
|
built
1968
1000 West Ave, Miami Beach, FL 33139
$-1,181
Cash flow
-19.6%
Cash-on-Cash Return
1.6%
Cap rate
0.8%
Rent to Value Ratio
Active
$1,495,000
2
bds
|
3
ba
|
1,733
sqft
|
built
1972
11 Island Ave, Miami Beach, FL 33139
$-5,015
Cash flow
-17.5%
Cash-on-Cash Return
2.1%
Cap rate
0.5%
Rent to Value Ratio

Active
$899,000
1
bds
|
2
ba
|
778
sqft
|
built
2008
5875 Collins Ave, Miami Beach, FL 33140
$-3,552
Cash flow
-20.6%
Cash-on-Cash Return
1.4%
Cap rate
0.6%
Rent to Value Ratio
Active
$230,000
bds
|
1
ba
|
401
sqft
|
built
1960
4015 Indian Creek Dr, Miami Beach, FL 33140
$78
Cash flow
1.8%
Cash-on-Cash Return
6.6%
Cap rate
1.1%
Rent to Value Ratio
Active
$298,000
bds
|
1
ba
|
331
sqft
|
built
2019
6080 Collins Ave, Miami Beach, FL 33140
$-762
Cash flow
-13.3%
Cash-on-Cash Return
3.1%
Cap rate
0.9%
Rent to Value Ratio
Active
$2,800,000
4
bds
|
5
ba
|
1,908
sqft
|
built
1940
3760 Royal Palm Ave, Miami Beach, FL 33140
$-11,581
Cash flow
-21.6%
Cash-on-Cash Return
1.2%
Cap rate
0.3%
Rent to Value Ratio

Active
$1,530,000
1
bds
|
2
ba
|
980
sqft
|
built
2005
4401 Collins Ave, Miami Beach, FL 33140
$-6,446
Cash flow
-22.0%
Cash-on-Cash Return
1.1%
Cap rate
0.4%
Rent to Value Ratio
Active
$749,000
2
bds
|
2
ba
|
1,680
sqft
|
built
1967
5640 Collins Ave, Miami Beach, FL 33140
$-2,089
Cash flow
-14.6%
Cash-on-Cash Return
2.8%
Cap rate
0.8%
Rent to Value Ratio

Active
$2,998,000
3
bds
|
3
ba
|
1,740
sqft
|
built
1998
1500 Ocean Dr, Miami Beach, FL 33139
$-10,655
Cash flow
-18.5%
Cash-on-Cash Return
1.9%
Cap rate
0.3%
Rent to Value Ratio
Active
$360,000
2
bds
|
1
ba
|
816
sqft
|
built
1956
1816 Meridian Ave, Miami Beach, FL 33139
$-1,540
Cash flow
-22.3%
Cash-on-Cash Return
1.0%
Cap rate
0.8%
Rent to Value Ratio