Miami Beach, FL Investment Properties for Sale
Browse homes for sale and investment properties in Miami Beach, FL. Refine your search by price, property type, or more.
Best cash flowing properties in Miami Beach, FL
Active
$189,003
1
bds
|
1
ba
|
465
sqft
|
built
1966
1140 71st St, Miami Beach, FL 33141
$-228
Cash flow
-6.3%
Cash-on-Cash Return
4.8%
Cap rate
1.0%
Rent to Value Ratio
Active
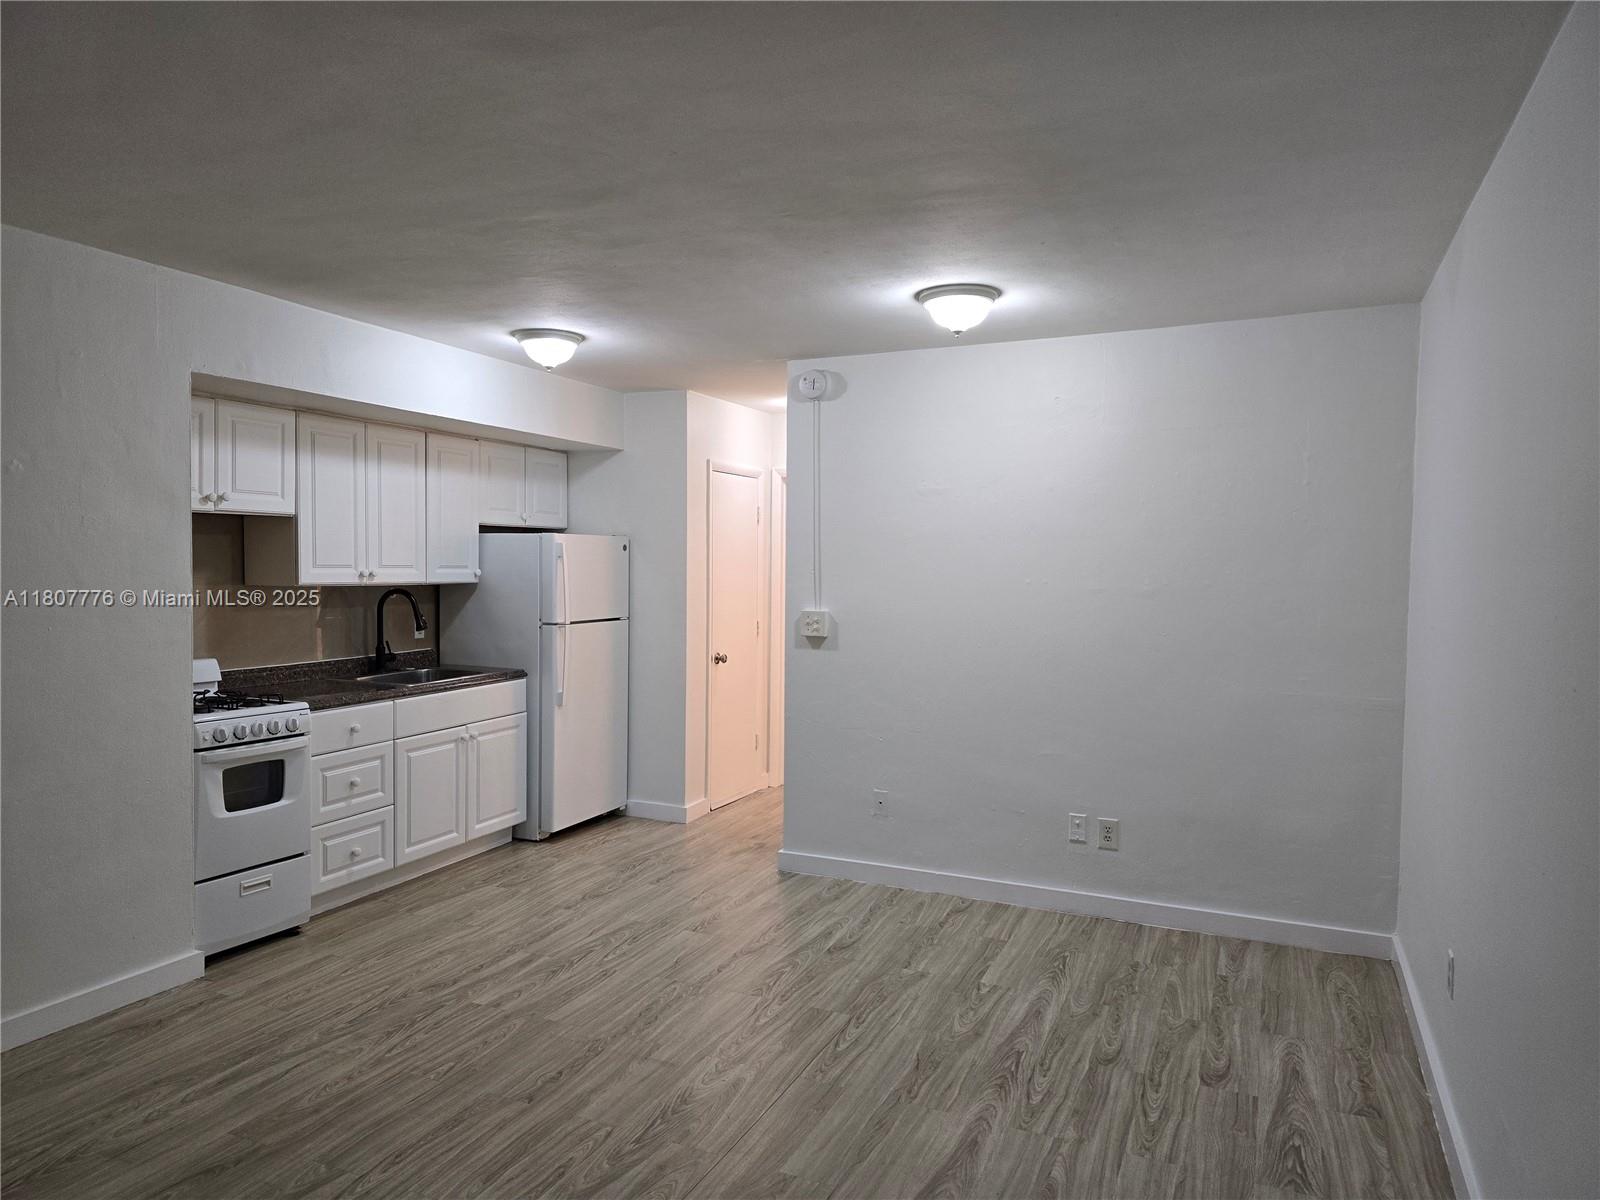
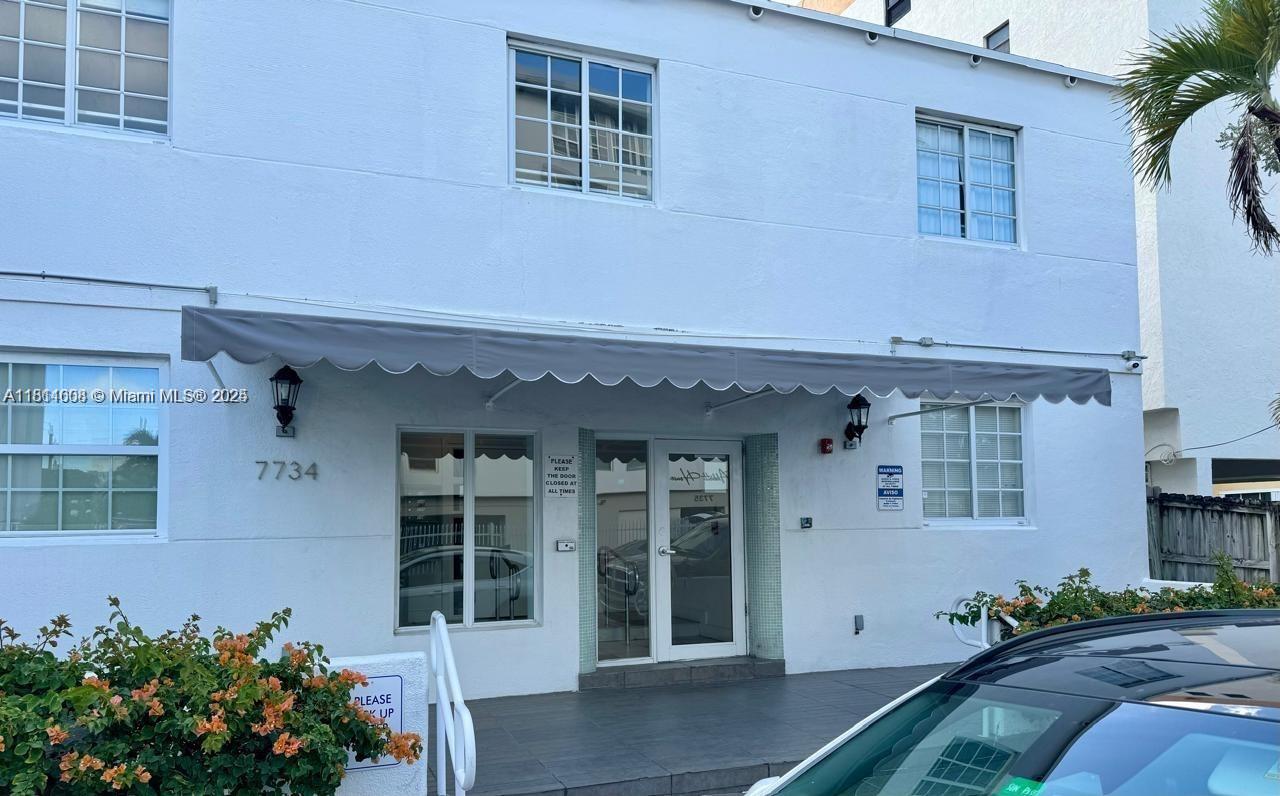
$198,000
1
bds
|
1
ba
|
570
sqft
|
built
1940
7734 Abbott Ave, Miami Beach, FL 33141
$-452
Cash flow
-11.9%
Cash-on-Cash Return
3.5%
Cap rate
0.9%
Rent to Value Ratio
1,992 out of 2,195 properties for sale in Miami Beach, FL
Limited Results Shown
Create a free account, or log in to reveal all property listings and enjoy the complete experience.
Active
$235,000
1
bds
|
1
ba
|
639
sqft
|
built
1963
8040 Tatum Waterway Dr, Miami Beach, FL 33141
$-601
Cash flow
-13.3%
Cash-on-Cash Return
3.2%
Cap rate
0.9%
Rent to Value Ratio
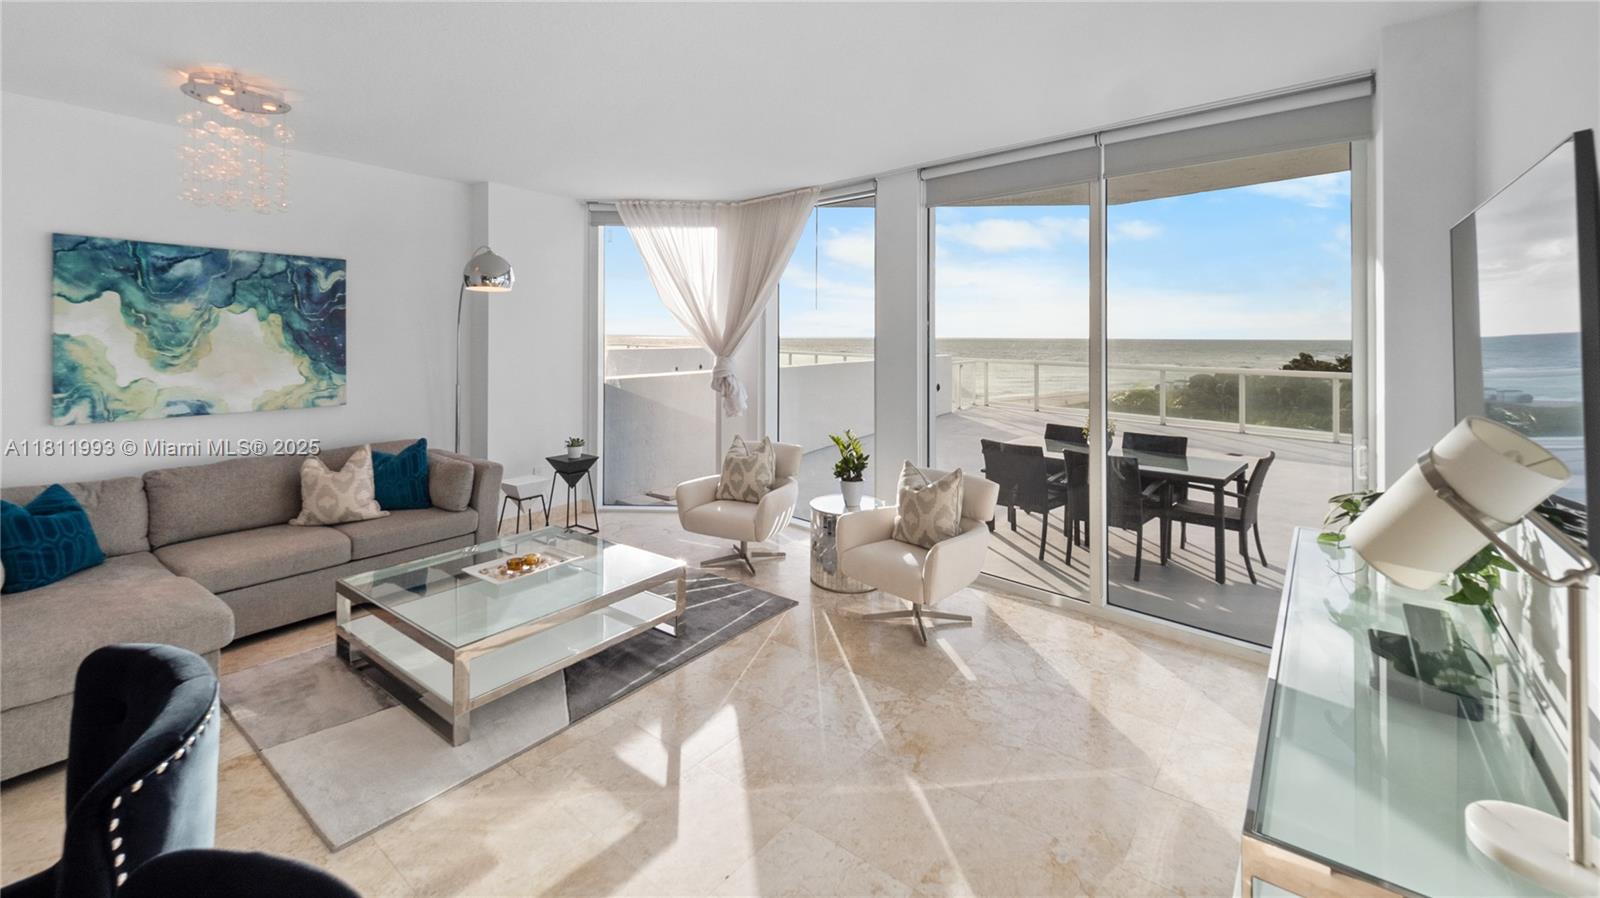
Active
$2,120,000
3
bds
|
3
ba
|
2,120
sqft
|
built
1967
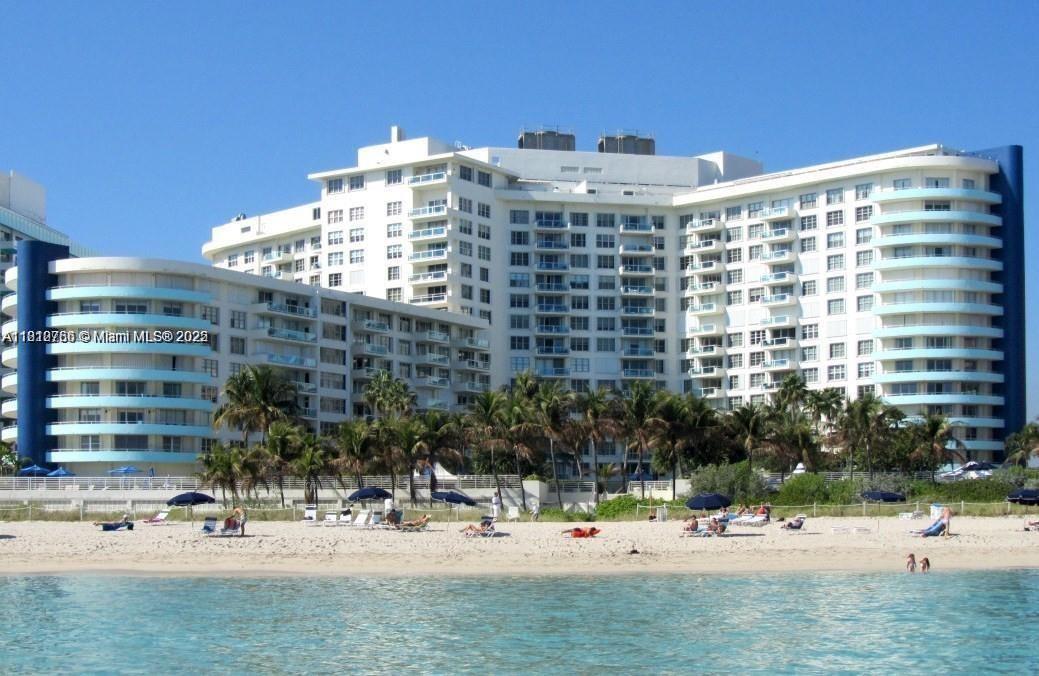
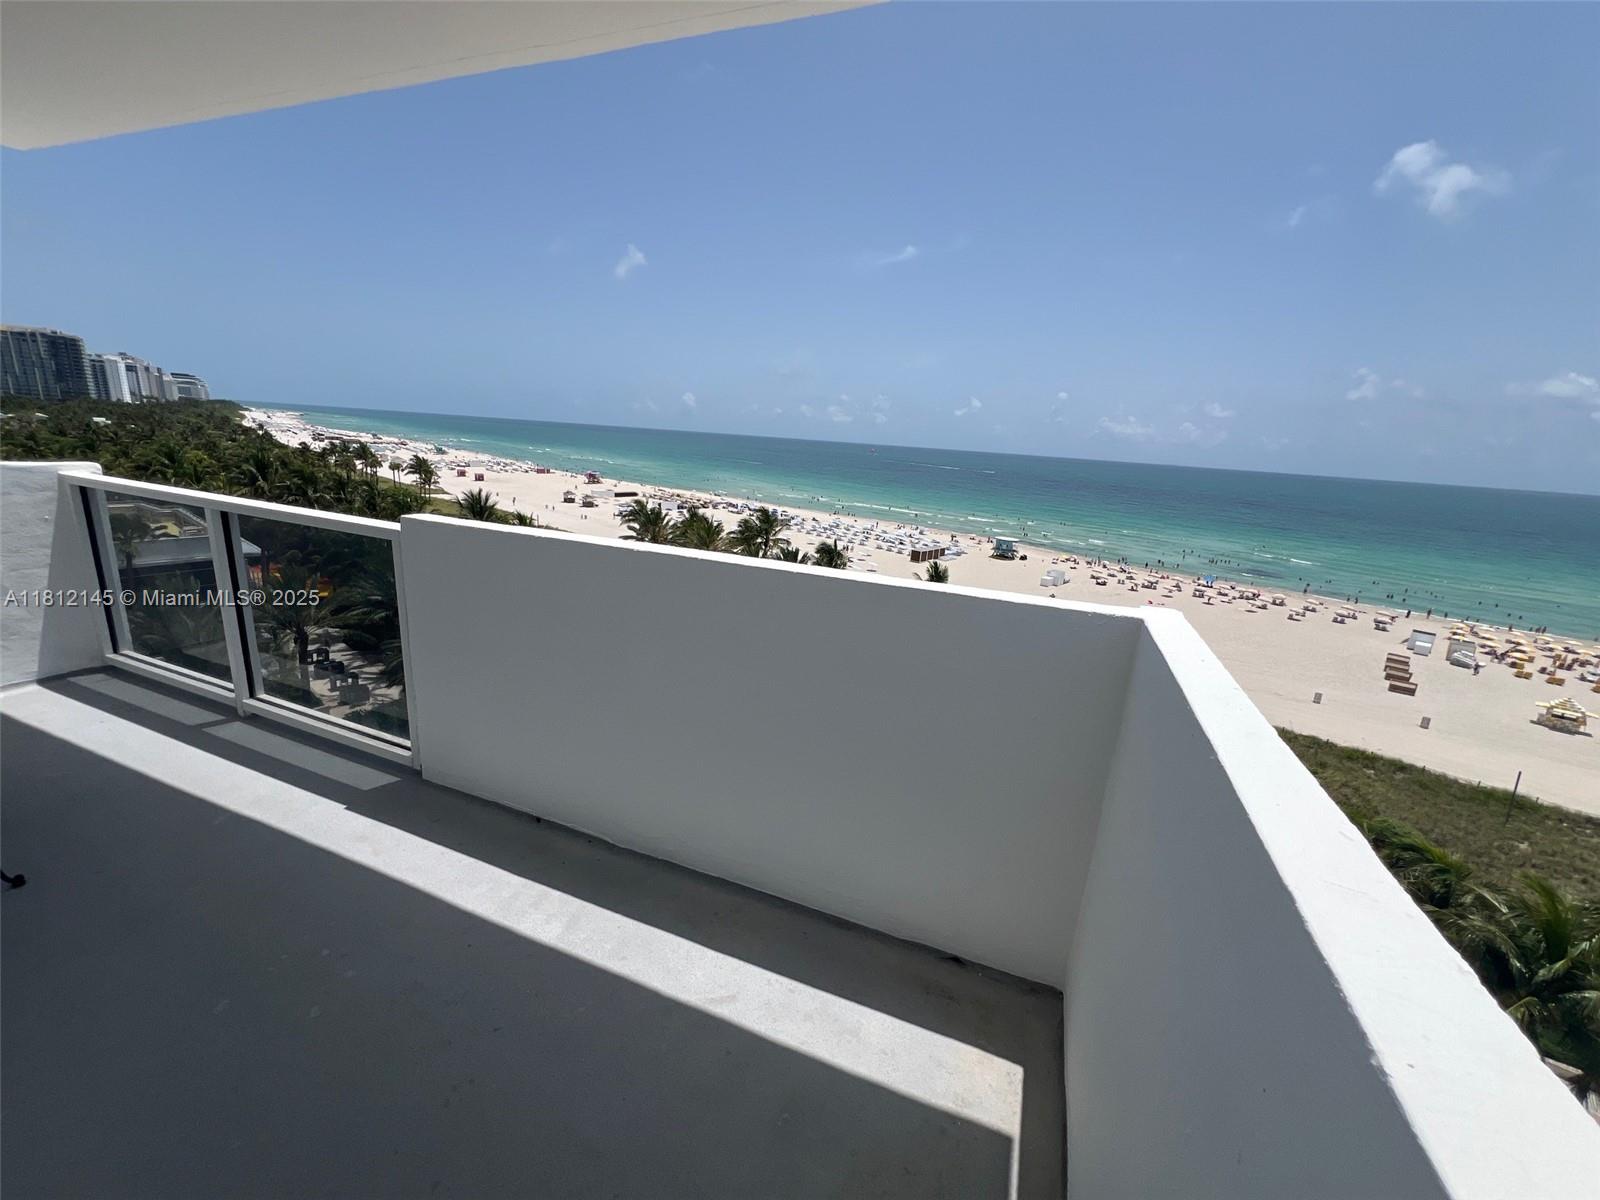
5600 Collins Ave, Miami Beach, FL 33140
$-9,644
Cash flow
-23.7%
Cash-on-Cash Return
0.8%
Cap rate
0.4%
Rent to Value Ratio

Active
$14,900,000
4
bds
|
5
ba
|
3,092
sqft
|
built
1934
56 S Hibiscus Dr, Miami Beach, FL 33139
$-82,260
Cash flow
-28.8%
Cash-on-Cash Return
-0.3%
Cap rate
0.1%
Rent to Value Ratio
Active
$850,000
2
bds
|
2
ba
|
1,030
sqft
|
built
1966
5161 Collins Ave, Miami Beach, FL 33140
$-3,820
Cash flow
-23.4%
Cash-on-Cash Return
0.9%
Cap rate
0.5%
Rent to Value Ratio
Active
$5,800,000
4
bds
|
5
ba
|
3,185
sqft
|
built
2004
450 Alton Rd, Miami Beach, FL 33139
$-34,161
Cash flow
-30.7%
Cash-on-Cash Return
-0.8%
Cap rate
0.1%
Rent to Value Ratio
Active
$340,000
1
bds
|
2
ba
|
792
sqft
|
built
1968
1130 11th St, Miami Beach, FL 33139
$-1,033
Cash flow
-15.9%
Cash-on-Cash Return
2.6%
Cap rate
0.8%
Rent to Value Ratio
Active
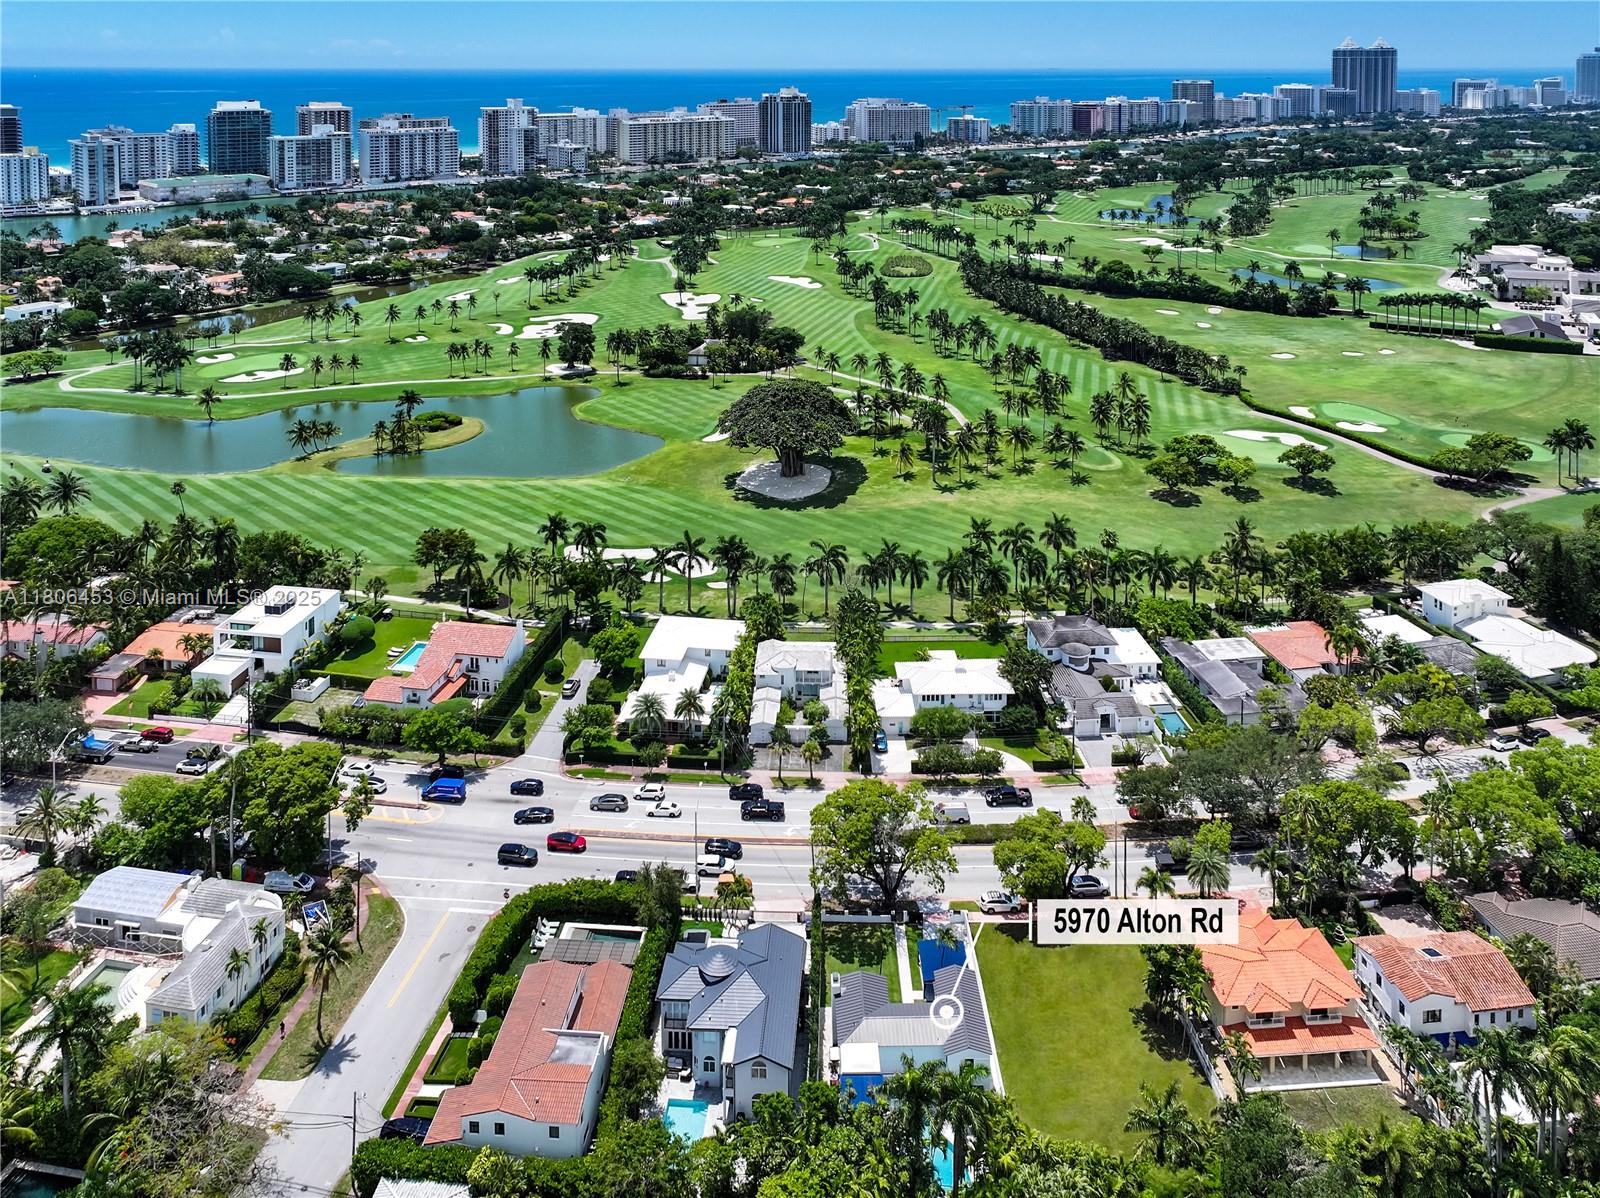
$2,975,000
4
bds
|
4
ba
|
3,153
sqft
|
built
1935
5970 Alton Rd, Miami Beach, FL 33140
$-11,114
Cash flow
-19.5%
Cash-on-Cash Return
1.8%
Cap rate
0.3%
Rent to Value Ratio
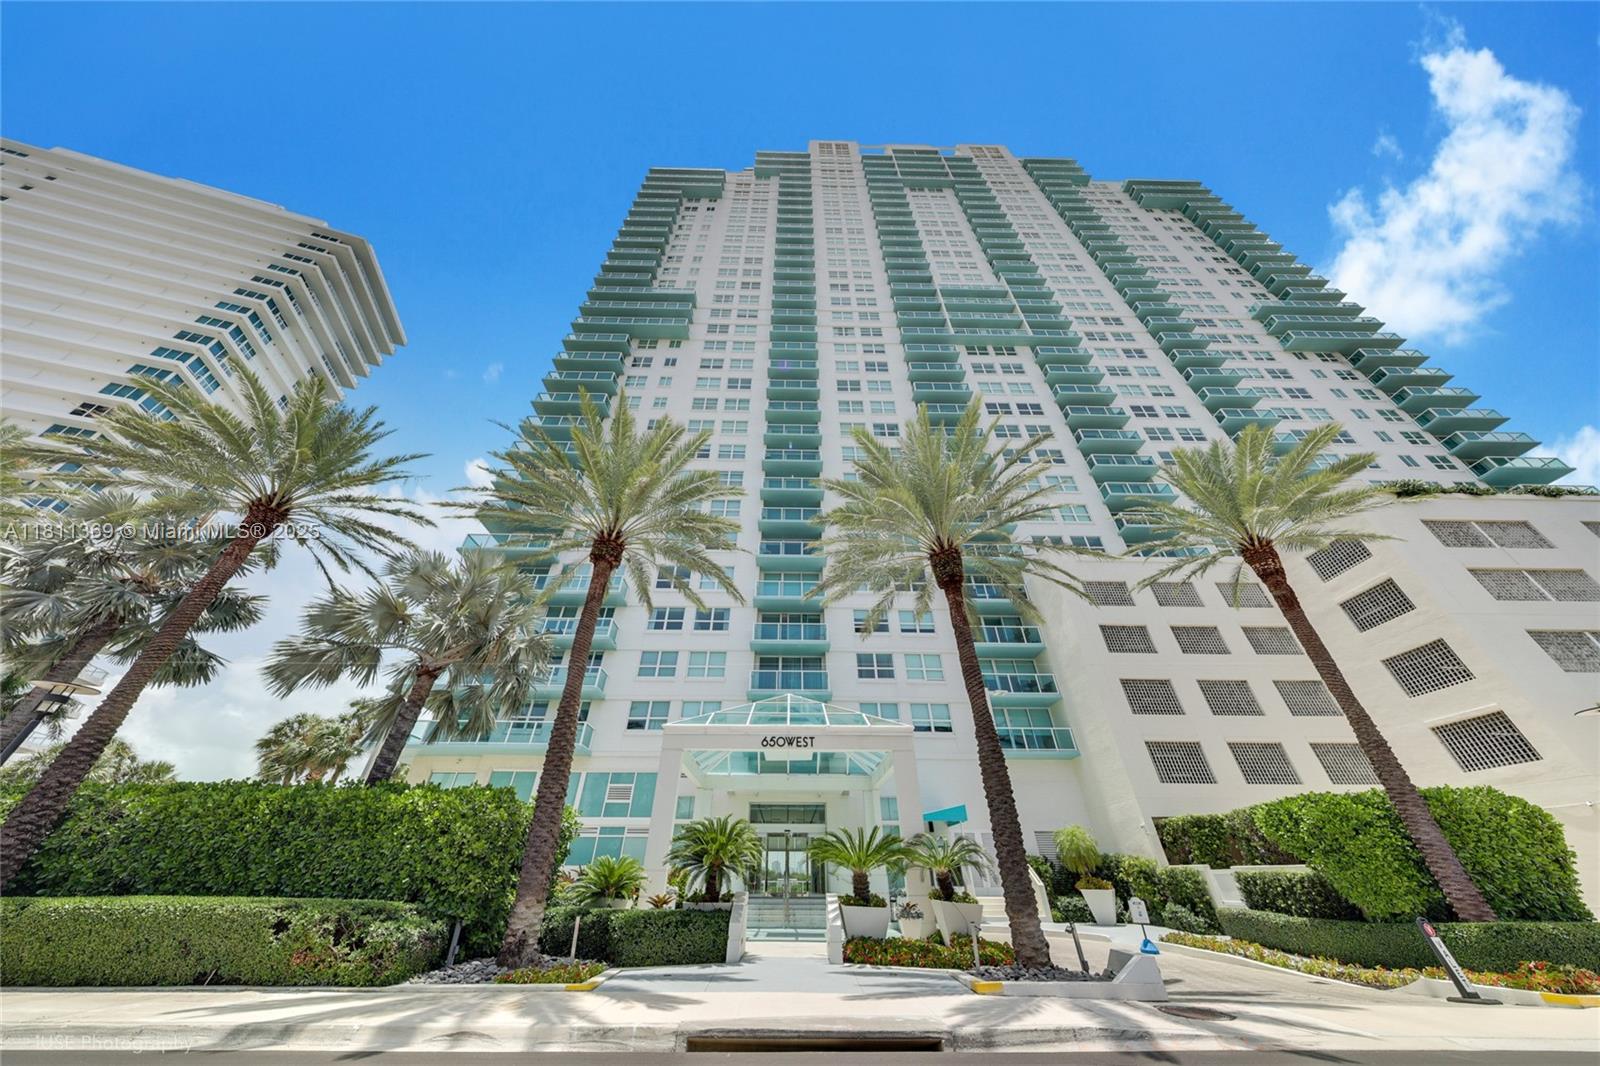
Active
$2,295,000
2
bds
|
3
ba
|
1,351
sqft
|
built
1997
650 West Ave, Miami Beach, FL 33139
$-10,258
Cash flow
-23.3%
Cash-on-Cash Return
0.9%
Cap rate
0.4%
Rent to Value Ratio

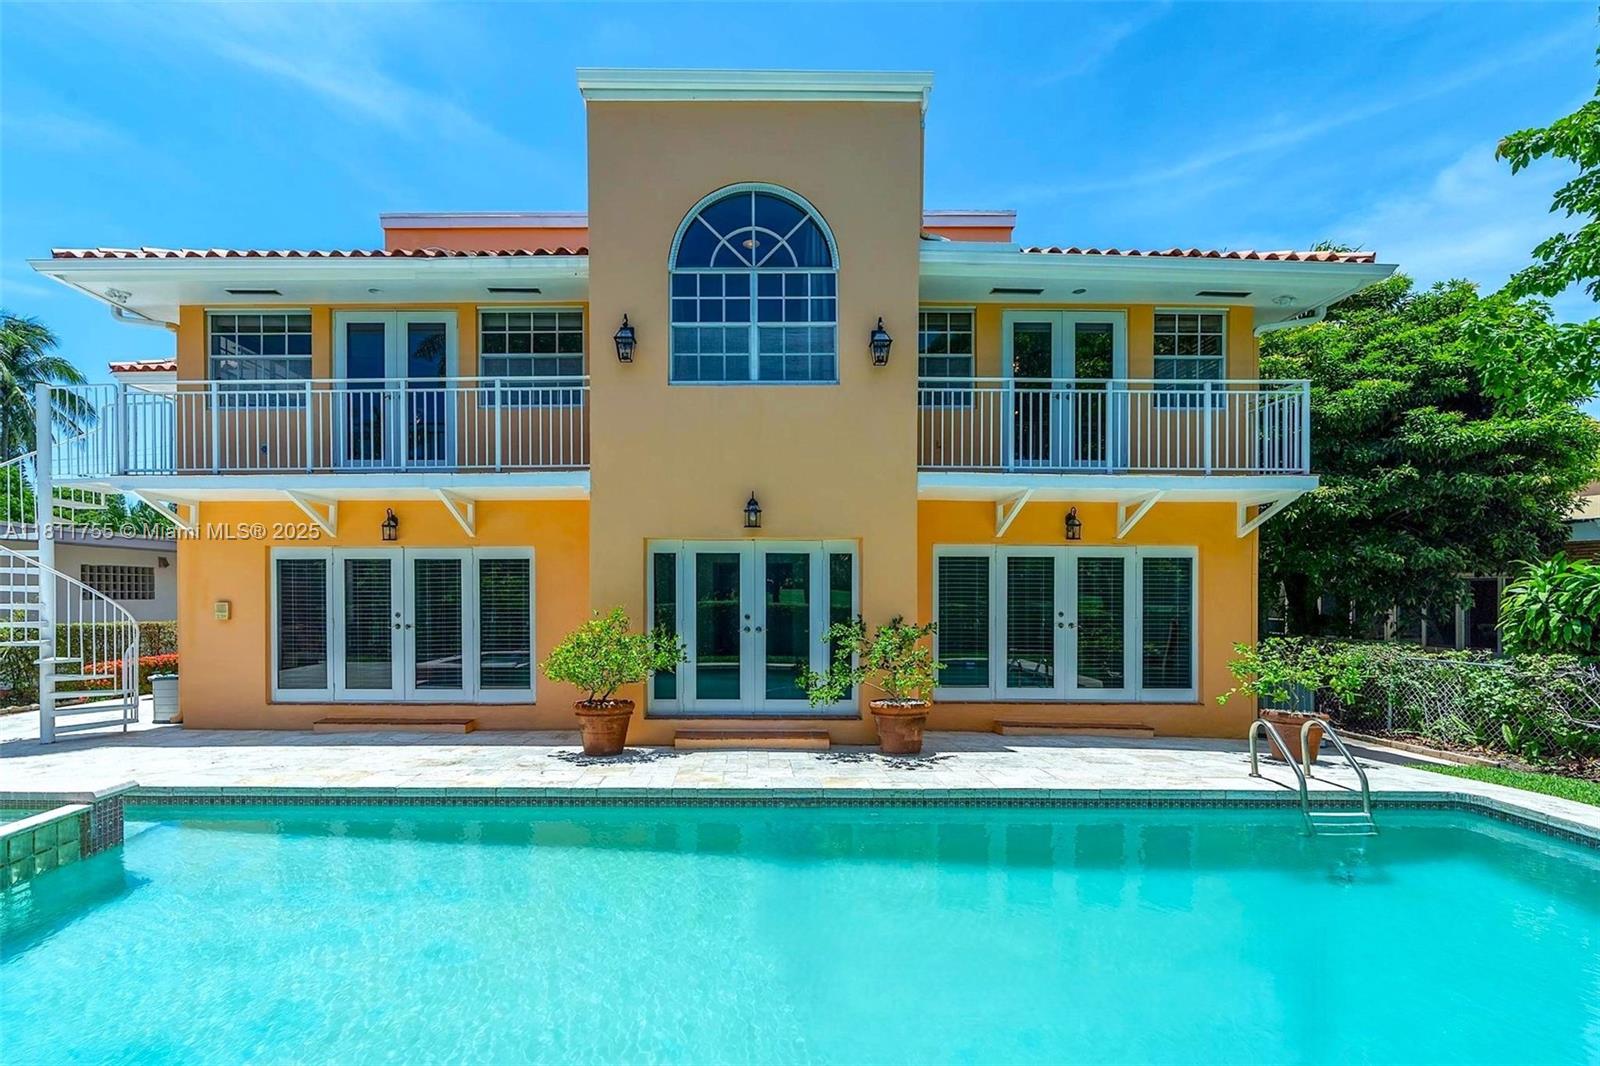
Active
$1,750,000
3
bds
|
2
ba
|
1,484
sqft
|
built
1934
1339 14th Ter, Miami Beach, FL 33139
$-7,002
Cash flow
-20.9%
Cash-on-Cash Return
1.5%
Cap rate
0.3%
Rent to Value Ratio
Active
$5,390,000
5
bds
|
6
ba
|
6,011
sqft
|
built
1935
5309 Alton Rd, Miami Beach, FL 33140
$-26,061
Cash flow
-25.2%
Cash-on-Cash Return
0.5%
Cap rate
0.1%
Rent to Value Ratio
Active
$879,000
1
bds
|
2
ba
|
819
sqft
|
built
2004
6515 Collins Ave, Miami Beach, FL 33141
$-4,005
Cash flow
-23.8%
Cash-on-Cash Return
0.8%
Cap rate
0.5%
Rent to Value Ratio
Active
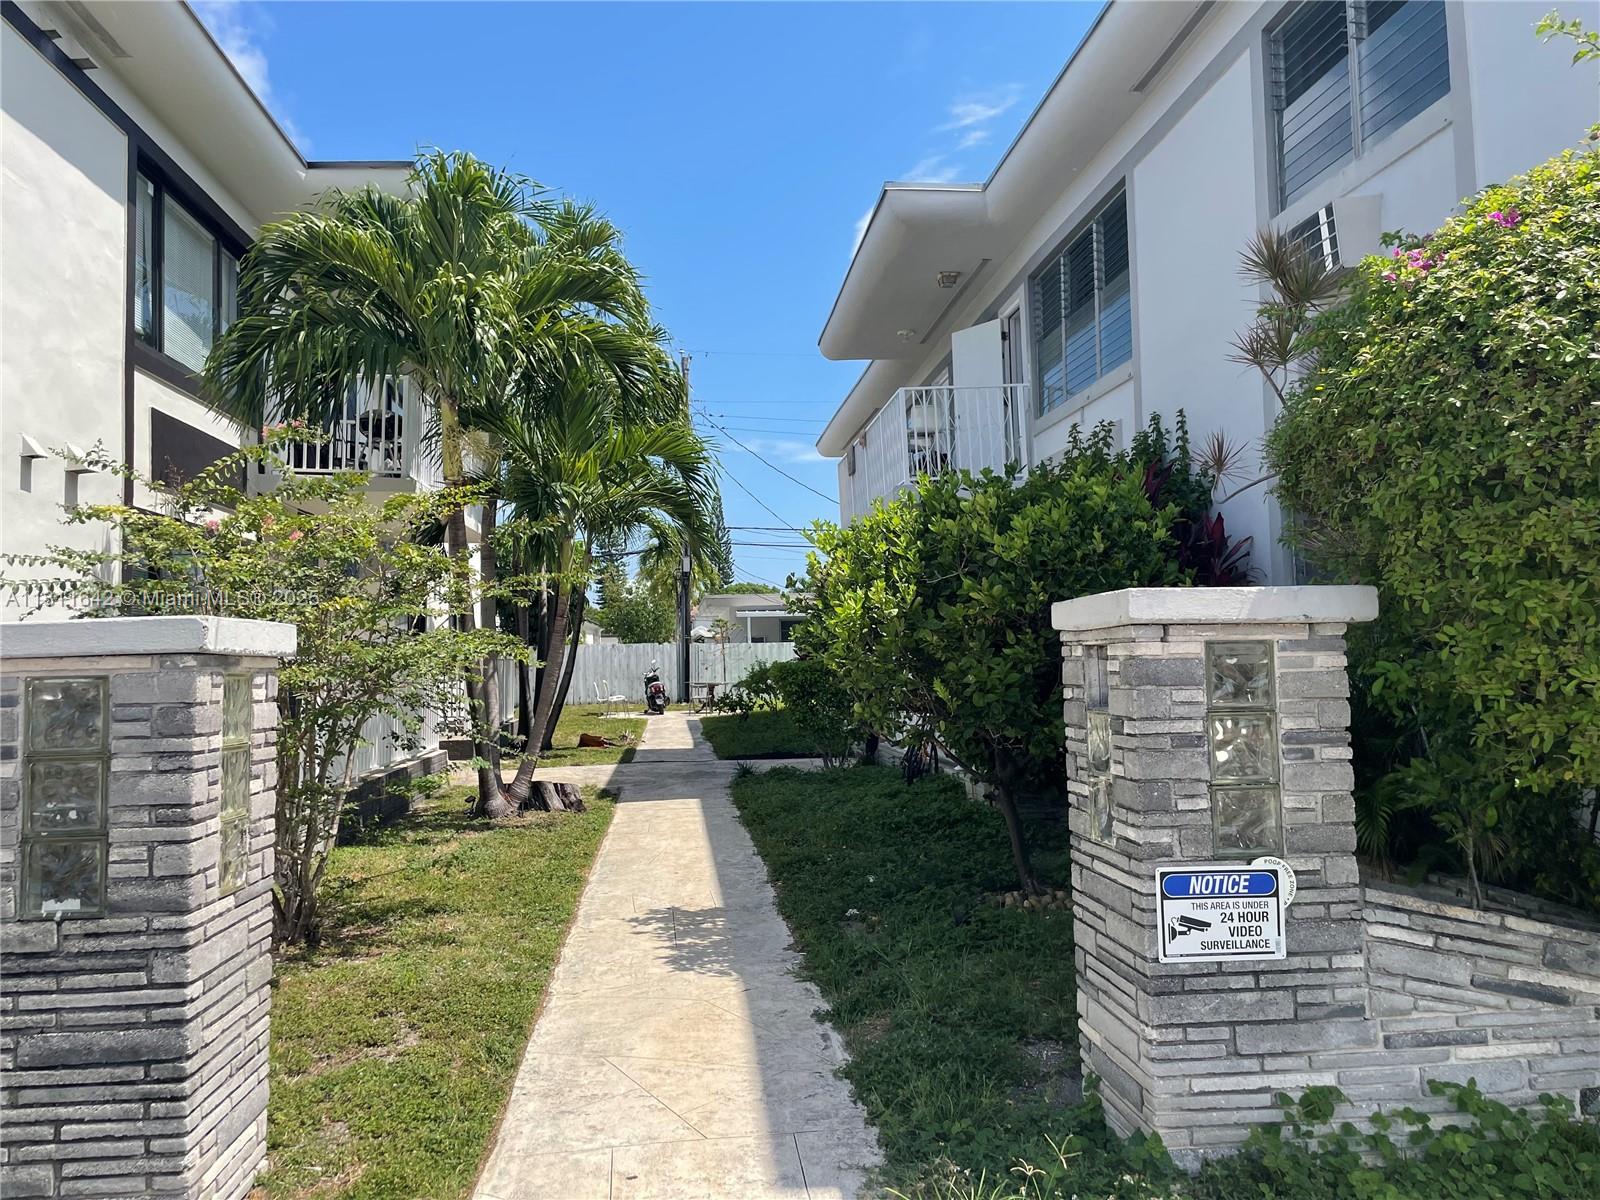
$1,900,000
8
bds
|
0
ba
|
4,905
sqft
|
built
1956
865 80th St, Miami Beach, FL 33141
$-9,397
Cash flow
-25.8%
Cash-on-Cash Return
0.3%
Cap rate
0.1%
Rent to Value Ratio
Active under contract
$1,799,000
2
bds
|
2
ba
|
1,190
sqft
|
built
1965
100 Lincoln Rd, Miami Beach, FL 33139
$-8,219
Cash flow
-23.8%
Cash-on-Cash Return
0.8%
Cap rate
0.4%
Rent to Value Ratio
Active
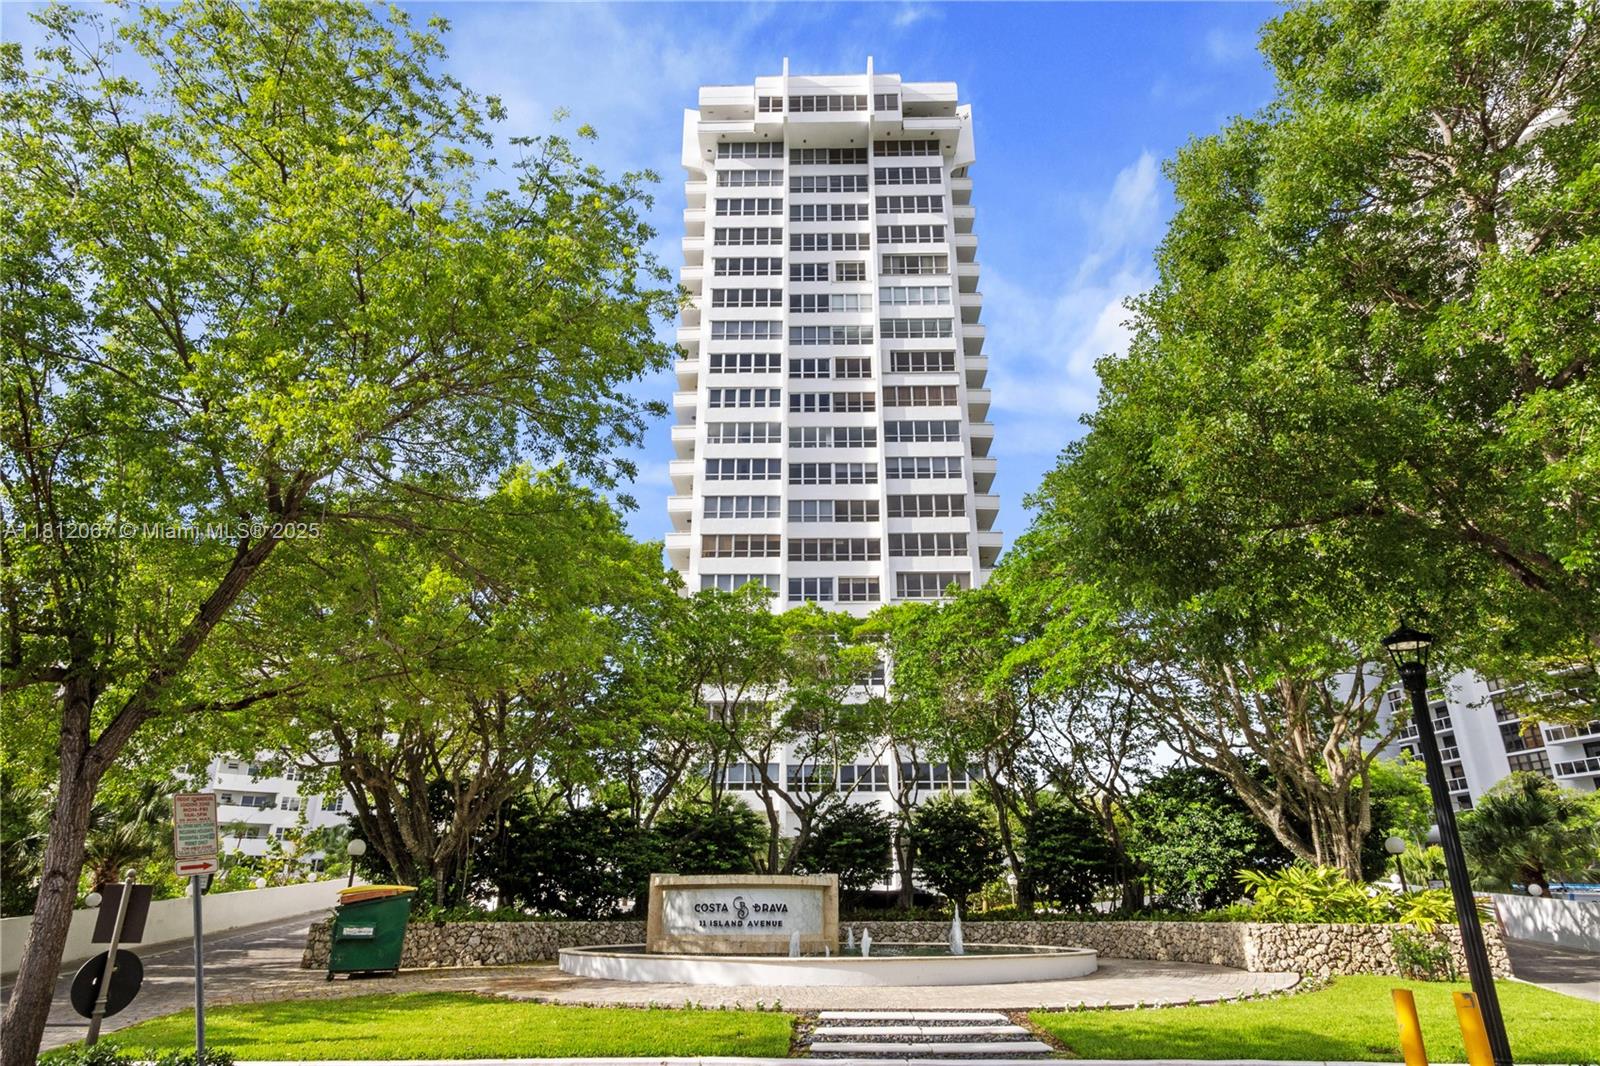
$935,000
2
bds
|
2
ba
|
1,238
sqft
|
built
1972
11 Island Ave, Miami Beach, FL 33139
$-3,373
Cash flow
-18.8%
Cash-on-Cash Return
2.0%
Cap rate
0.7%
Rent to Value Ratio
Active
$198,000
1
bds
|
1
ba
|
570
sqft
|
built
1940
7734 Abbott Ave, Miami Beach, FL 33141
$-452
Cash flow
-11.9%
Cash-on-Cash Return
3.5%
Cap rate
0.9%
Rent to Value Ratio

Active
$2,500,000
2
bds
|
3
ba
|
2,464
sqft
|
built
1983
1000 Venetian Way, Miami Beach, FL 33139
$-11,621
Cash flow
-24.3%
Cash-on-Cash Return
0.7%
Cap rate
0.3%
Rent to Value Ratio
Active
$685,000
2
bds
|
2
ba
|
1,018
sqft
|
built
2005
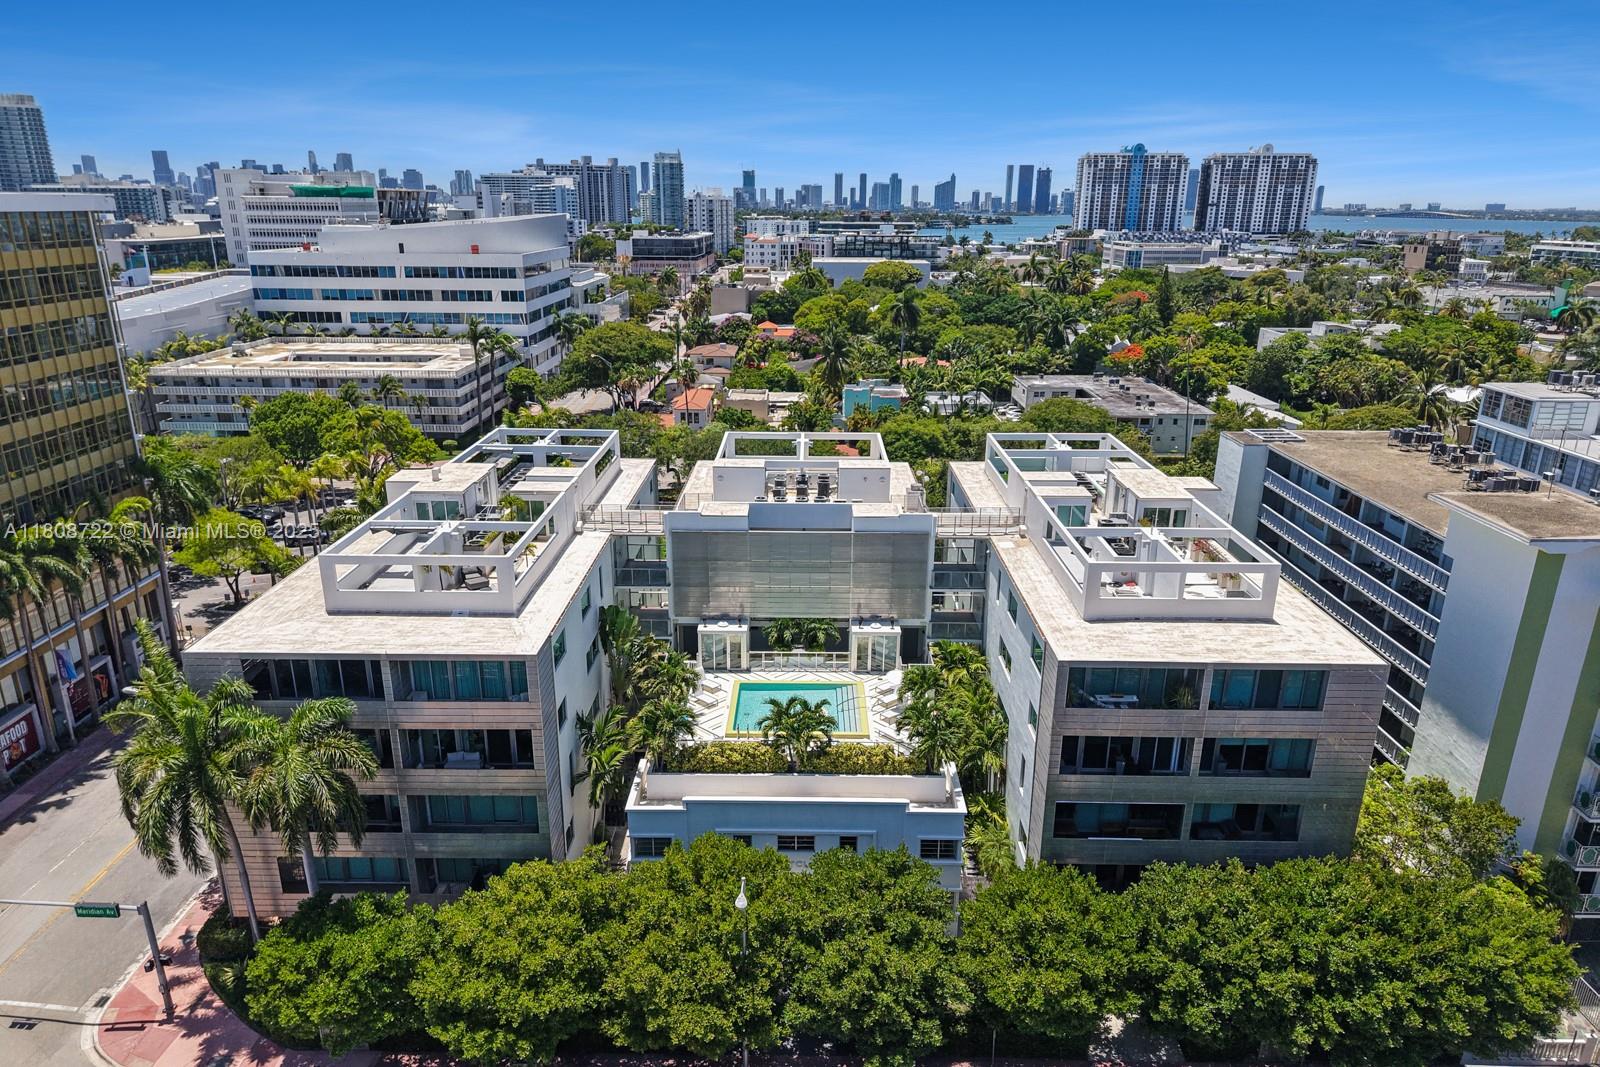
1700 Meridian Ave, Miami Beach, FL 33139
$-944
Cash flow
-7.2%
Cash-on-Cash Return
4.6%
Cap rate
0.7%
Rent to Value Ratio
Active
$1,250,000
1
bds
|
2
ba
|
1,030
sqft
|
built
1983
1000 Venetian Way, Miami Beach, FL 33139
$-5,278
Cash flow
-22.0%
Cash-on-Cash Return
1.2%
Cap rate
0.5%
Rent to Value Ratio
Active
$6,750,000
4
bds
|
4
ba
|
4,502
sqft
|
built
1951
425 N Shore Dr, Miami Beach, FL 33141
$-33,790
Cash flow
-26.1%
Cash-on-Cash Return
0.3%
Cap rate
0.1%
Rent to Value Ratio

Active
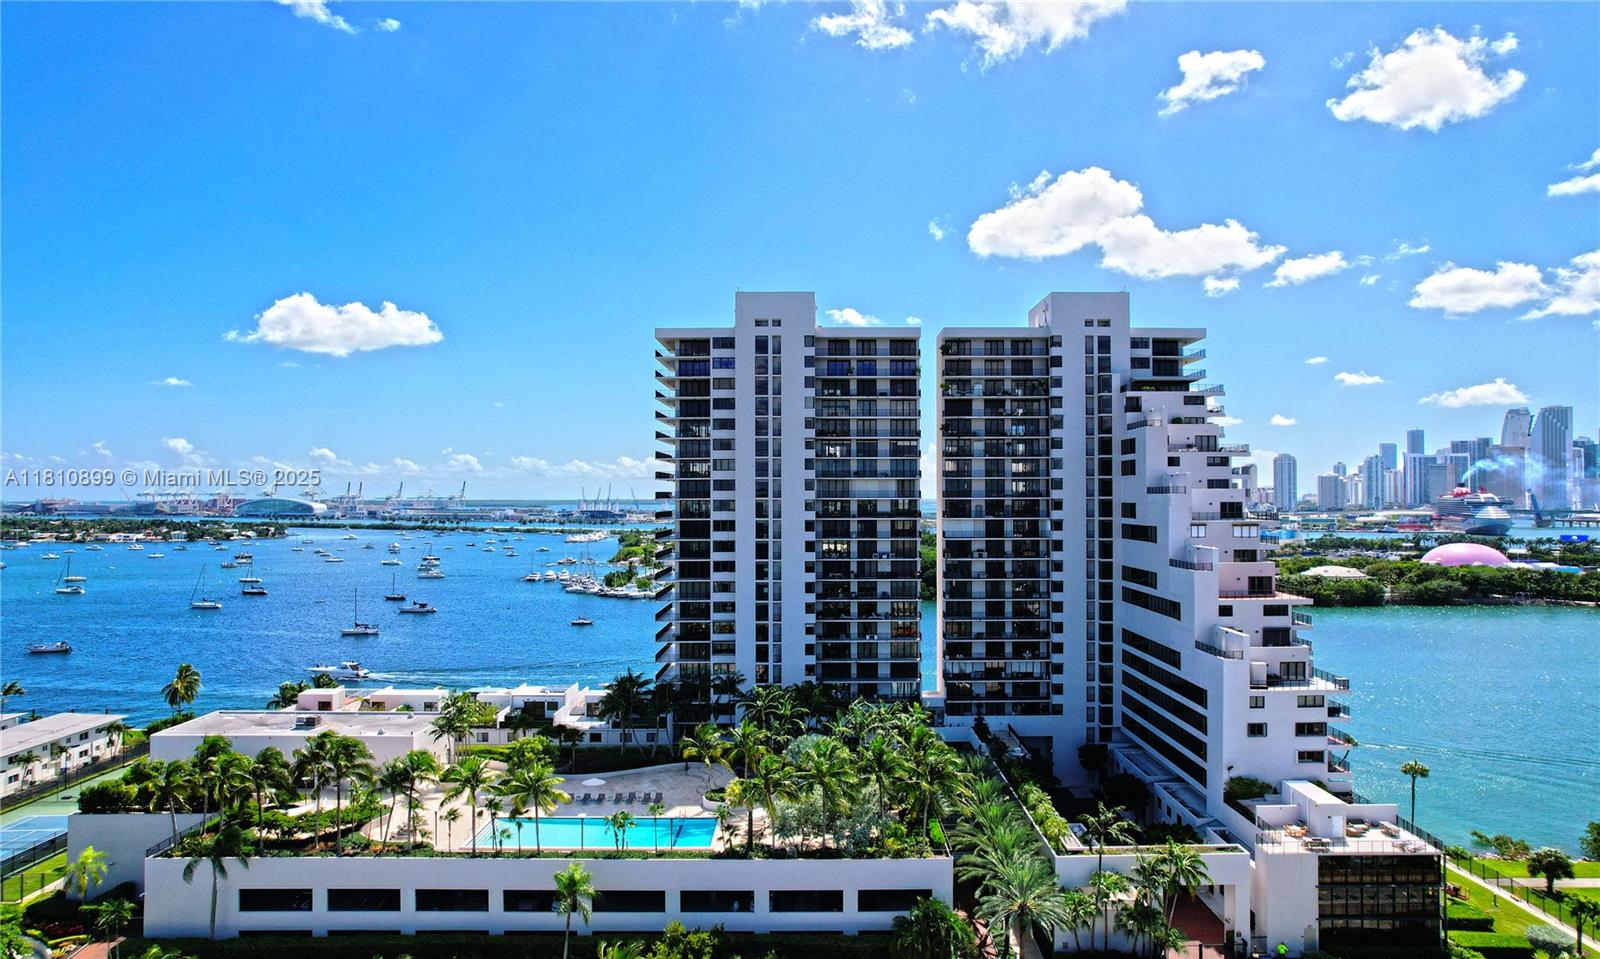
$1,215,000
2
bds
|
2
ba
|
1,440
sqft
|
built
1981
9 Island Ave, Miami Beach, FL 33139
$-4,209
Cash flow
-18.1%
Cash-on-Cash Return
2.1%
Cap rate
0.6%
Rent to Value Ratio
Active
$1,799,000
2
bds
|
2
ba
|
1,190
sqft
|
built
1965
100 Lincoln Rd, Miami Beach, FL 33139
$-7,025
Cash flow
-20.4%
Cash-on-Cash Return
1.6%
Cap rate
0.5%
Rent to Value Ratio
Active
$233,000
bds
|
1
ba
|
594
sqft
|
built
1970
401 69th St, Miami Beach, FL 33141
$-880
Cash flow
-19.7%
Cash-on-Cash Return
1.8%
Cap rate
0.8%
Rent to Value Ratio
Active
$575,000
1
bds
|
2
ba
|
906
sqft
|
built
1967
5555 Collins Ave, Miami Beach, FL 33140
$-2,903
Cash flow
-26.3%
Cash-on-Cash Return
0.2%
Cap rate
0.6%
Rent to Value Ratio
Active
$189,003
1
bds
|
1
ba
|
465
sqft
|
built
1966
1140 71st St, Miami Beach, FL 33141
$-228
Cash flow
-6.3%
Cash-on-Cash Return
4.8%
Cap rate
1.0%
Rent to Value Ratio
Active
$1,500,000
2
bds
|
2
ba
|
900
sqft
|
built
1926
2301 Collins Ave, Miami Beach, FL 33139
$-7,343
Cash flow
-25.5%
Cash-on-Cash Return
0.4%
Cap rate
0.4%
Rent to Value Ratio

Active
$329,000
1
bds
|
1
ba
|
850
sqft
|
built
1966
800 West Ave, Miami Beach, FL 33139
$-841
Cash flow
-13.3%
Cash-on-Cash Return
3.2%
Cap rate
0.9%
Rent to Value Ratio

Active
$490,000
2
bds
|
1
ba
|
612
sqft
|
built
1935
750 Collins Ave, Miami Beach, FL 33139
$-1,125
Cash flow
-12.0%
Cash-on-Cash Return
3.5%
Cap rate
0.6%
Rent to Value Ratio
Active
$400,000
2
bds
|
2
ba
|
1,147
sqft
|
built
1963
900 Bay Dr, Miami Beach, FL 33141
$-1,570
Cash flow
-20.5%
Cash-on-Cash Return
1.6%
Cap rate
0.8%
Rent to Value Ratio
Active
$1,888,000
bds
|
1
ba
|
699
sqft
|
built
2008
50 S Pointe Dr, Miami Beach, FL 33139
$-8,896
Cash flow
-24.6%
Cash-on-Cash Return
0.6%
Cap rate
0.4%
Rent to Value Ratio

Active
$468,000
2
bds
|
2
ba
|
1,271
sqft
|
built
1971
6039 Collins Ave, Miami Beach, FL 33140
$-1,663
Cash flow
-18.5%
Cash-on-Cash Return
2.0%
Cap rate
0.7%
Rent to Value Ratio
Active
$299,000
1
bds
|
2
ba
|
792
sqft
|
built
1968
1130 11th St, Miami Beach, FL 33139
$-1,053
Cash flow
-18.4%
Cash-on-Cash Return
2.1%
Cap rate
0.8%
Rent to Value Ratio
Active
$345,000
1
bds
|
2
ba
|
815
sqft
|
built
1970
5838 Collins Ave, Miami Beach, FL 33140
$-1,208
Cash flow
-18.3%
Cash-on-Cash Return
2.1%
Cap rate
0.8%
Rent to Value Ratio
Active
$850,000
1
bds
|
2
ba
|
975
sqft
|
built
1974
4101 Pine Tree Dr, Miami Beach, FL 33140
$-2,839
Cash flow
-17.4%
Cash-on-Cash Return
2.3%
Cap rate
0.5%
Rent to Value Ratio
Active
$325,000
1
bds
|
1
ba
|
921
sqft
|
built
1970
401 69th St, Miami Beach, FL 33141
$-1,346
Cash flow
-21.6%
Cash-on-Cash Return
1.3%
Cap rate
0.8%
Rent to Value Ratio
Active
$2,690,000
2
bds
|
2
ba
|
1,290
sqft
|
built
2008
6899 Collins Ave, Miami Beach, FL 33141
$-11,620
Cash flow
-22.5%
Cash-on-Cash Return
1.1%
Cap rate
0.4%
Rent to Value Ratio
Active
$2,200,000
2
bds
|
2
ba
|
1,290
sqft
|
built
2008
6899 Collins Ave, Miami Beach, FL 33141
$-11,403
Cash flow
-27.0%
Cash-on-Cash Return
0.1%
Cap rate
0.4%
Rent to Value Ratio
Active
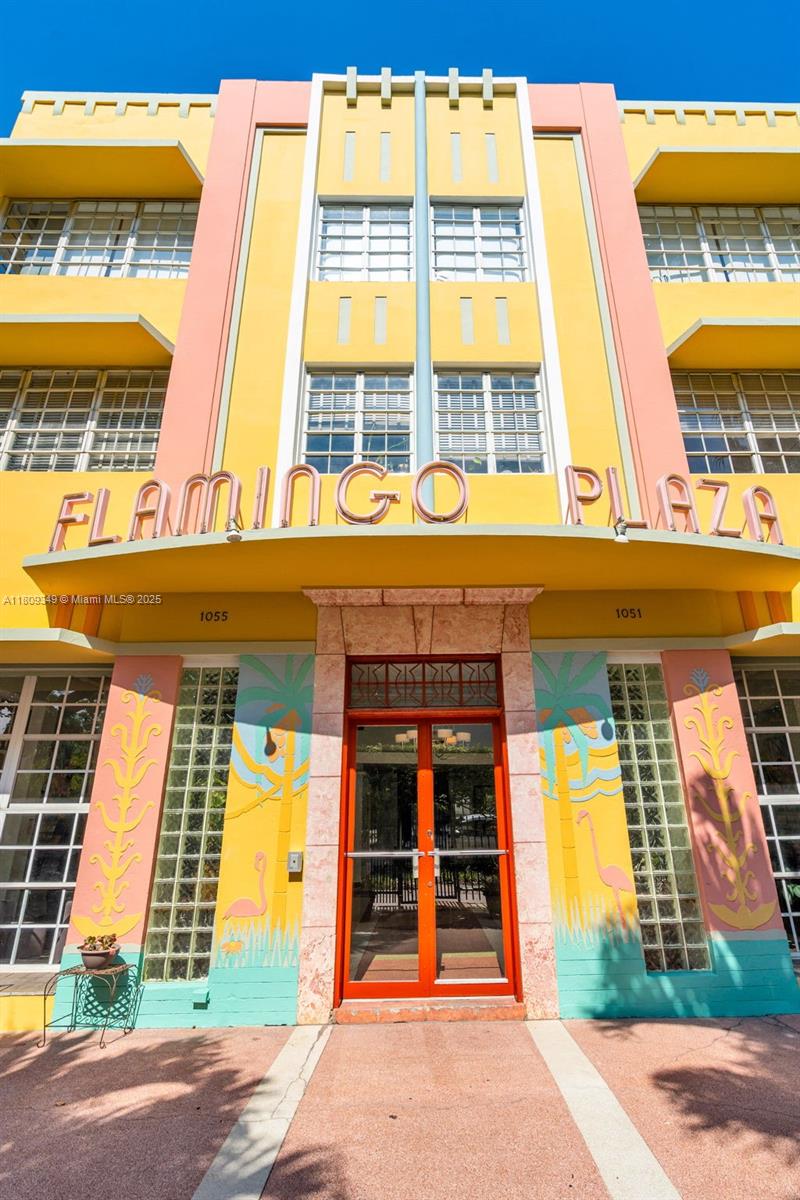
$255,000
1
bds
|
1
ba
|
540
sqft
|
built
1937
1051 Meridian Ave, Miami Beach, FL 33139
$-922
Cash flow
-18.9%
Cash-on-Cash Return
1.9%
Cap rate
0.8%
Rent to Value Ratio
Active
$450,000
1
bds
|
2
ba
|
820
sqft
|
built
1995
1688 West Ave, Miami Beach, FL 33139
$-1,961
Cash flow
-22.7%
Cash-on-Cash Return
1.1%
Cap rate
0.6%
Rent to Value Ratio
Active
$349,000
1
bds
|
1
ba
|
845
sqft
|
built
1970
245 18th St, Miami Beach, FL 33139
$-769
Cash flow
-11.5%
Cash-on-Cash Return
3.6%
Cap rate
0.8%
Rent to Value Ratio

Active
$341,000
1
bds
|
1
ba
|
914
sqft
|
built
2007
945 Michigan Ave, Miami Beach, FL 33139
$-1,519
Cash flow
-23.2%
Cash-on-Cash Return
0.9%
Cap rate
0.9%
Rent to Value Ratio