Miami Beach, FL Investment Properties for Sale
Browse homes for sale and investment properties in Miami Beach, FL. Refine your search by price, property type, or more.
Best cash flowing properties in Miami Beach, FL
Active
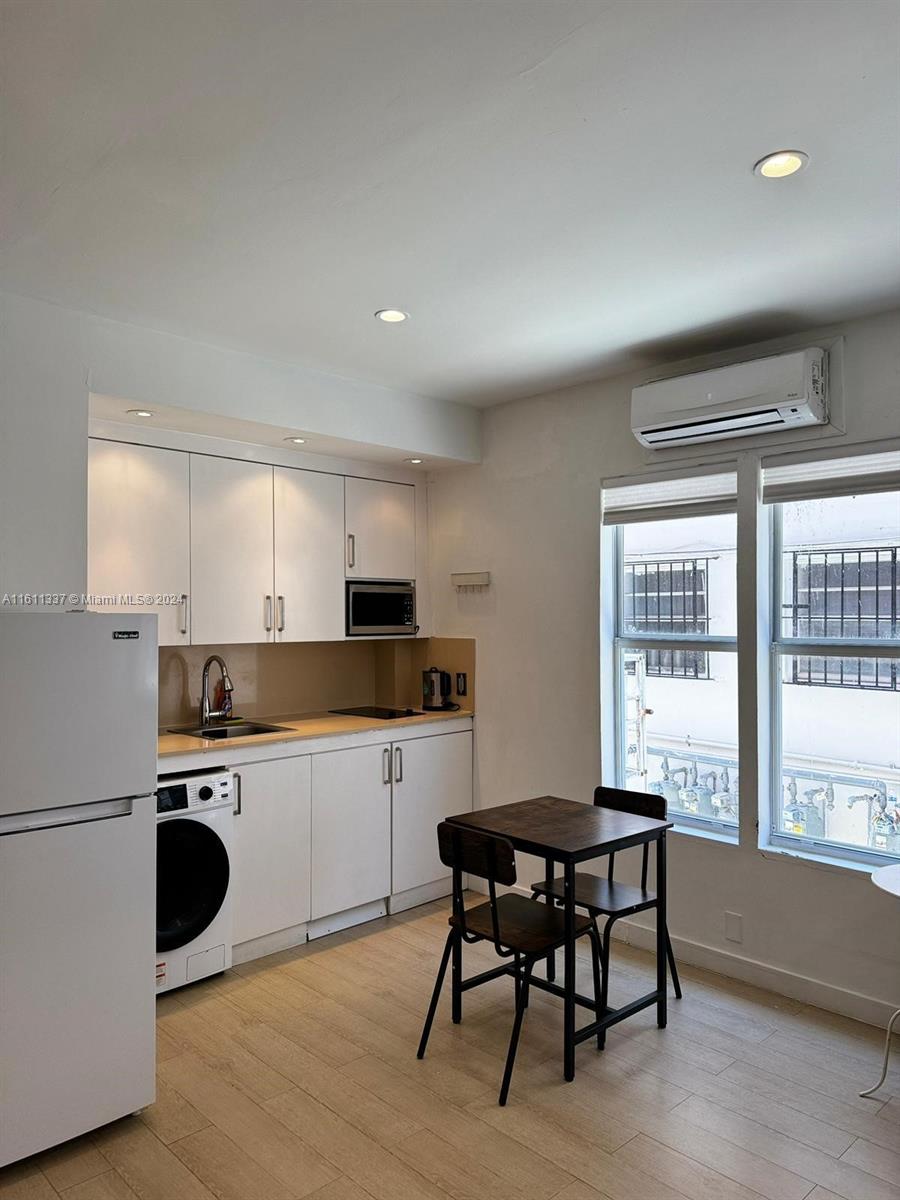
$150,000
bds
|
1
ba
|
290
sqft
|
built
1925
642 Michigan Ave, Miami Beach, FL 33139
$-233
Cash flow
-8.1%
Cash-on-Cash Return
4.3%
Cap rate
1.2%
Rent to Value Ratio
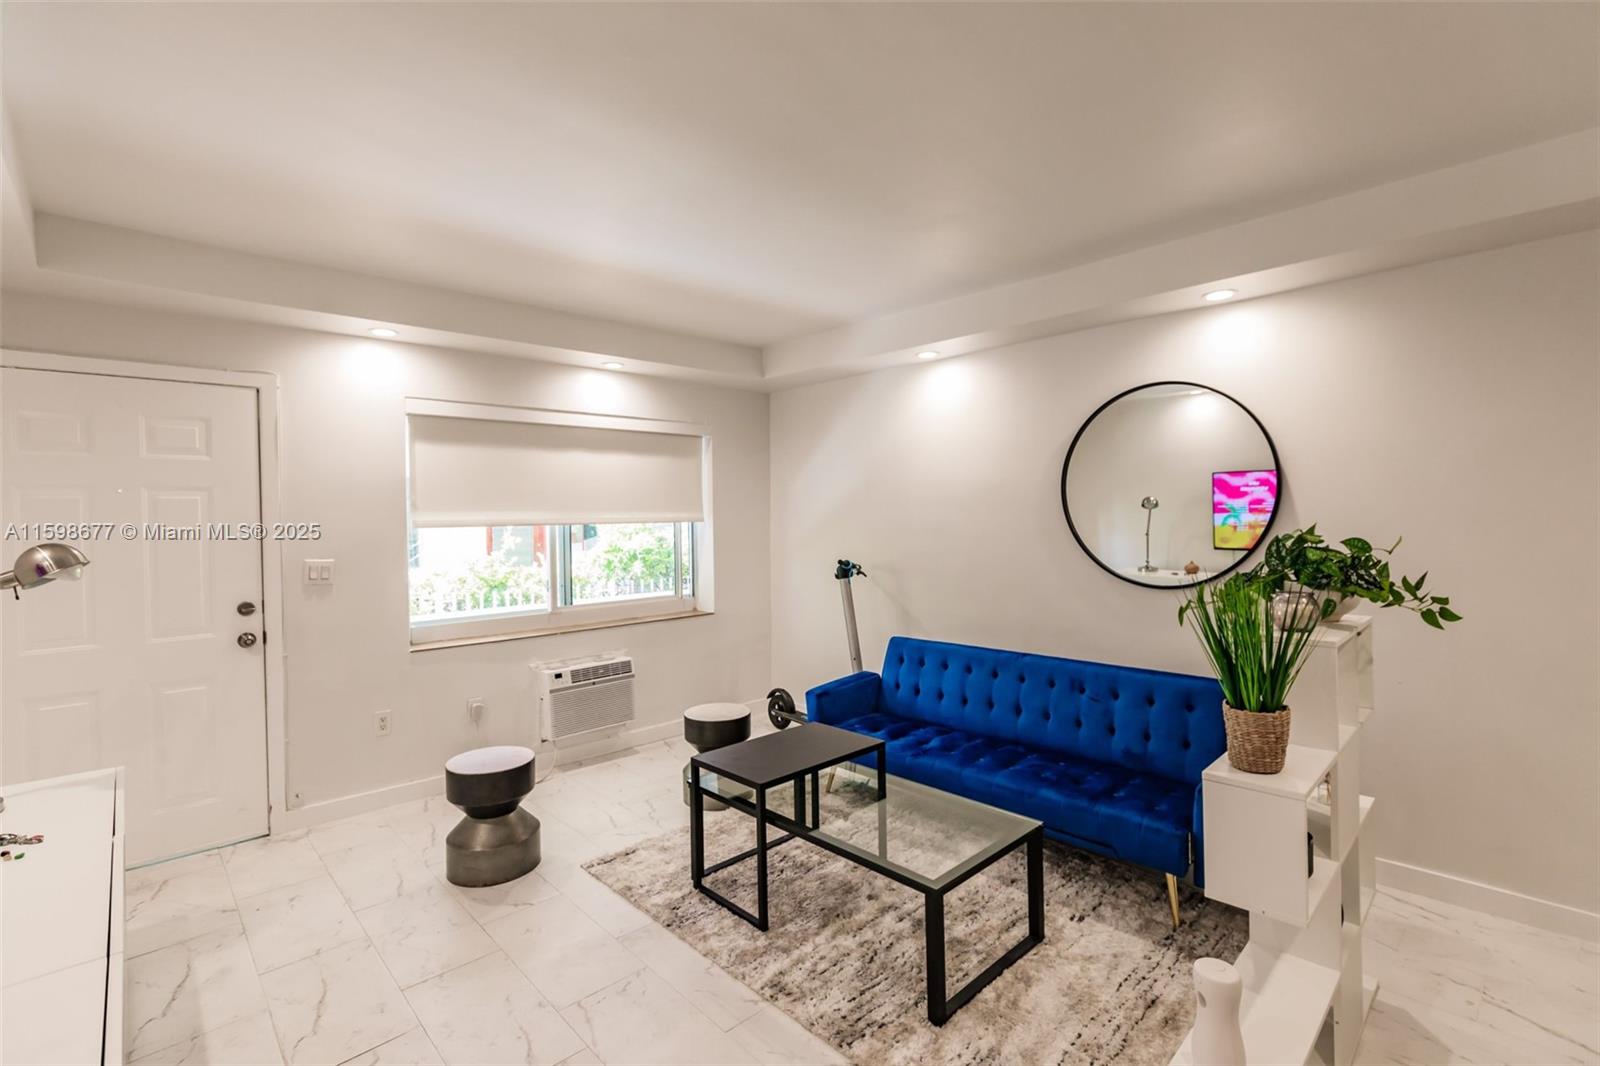
Active
$222,123
bds
|
1
ba
|
466
sqft
|
built
1955
1135 Euclid Ave, Miami Beach, FL 33139
$-559
Cash flow
-13.1%
Cash-on-Cash Return
3.1%
Cap rate
0.8%
Rent to Value Ratio
1,984 out of 2,186 properties for sale in Miami Beach, FL
Limited Results Shown
Create a free account, or log in to reveal all property listings and enjoy the complete experience.

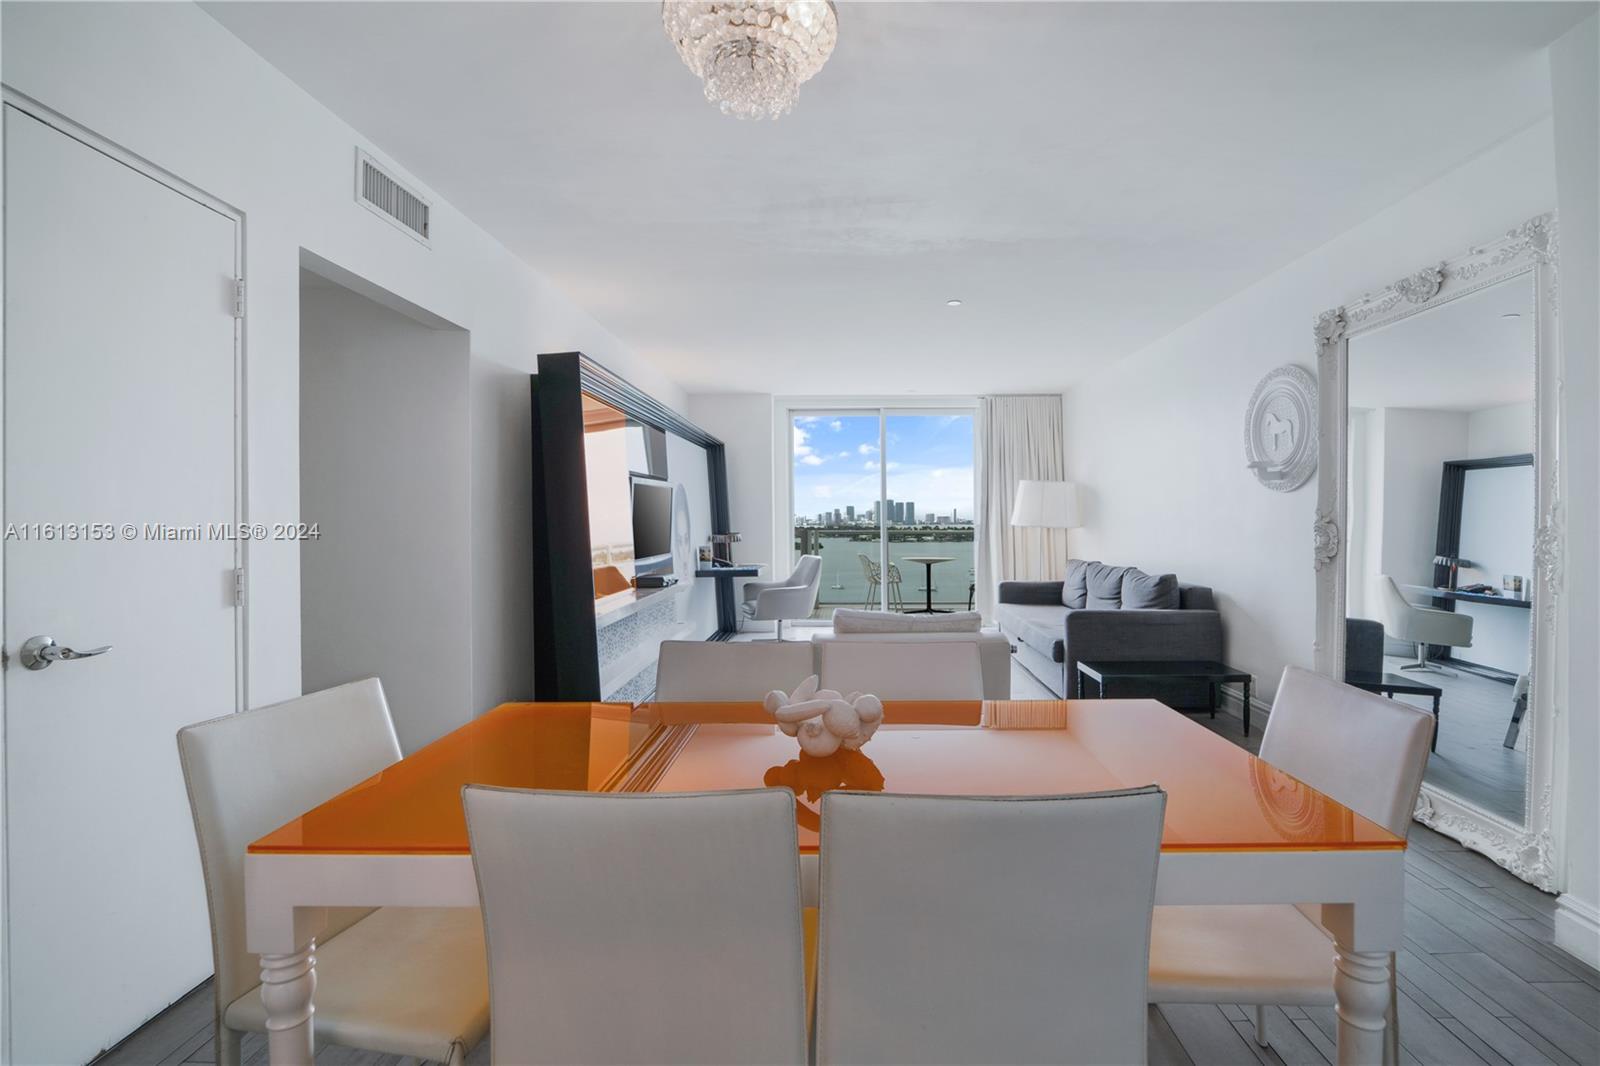
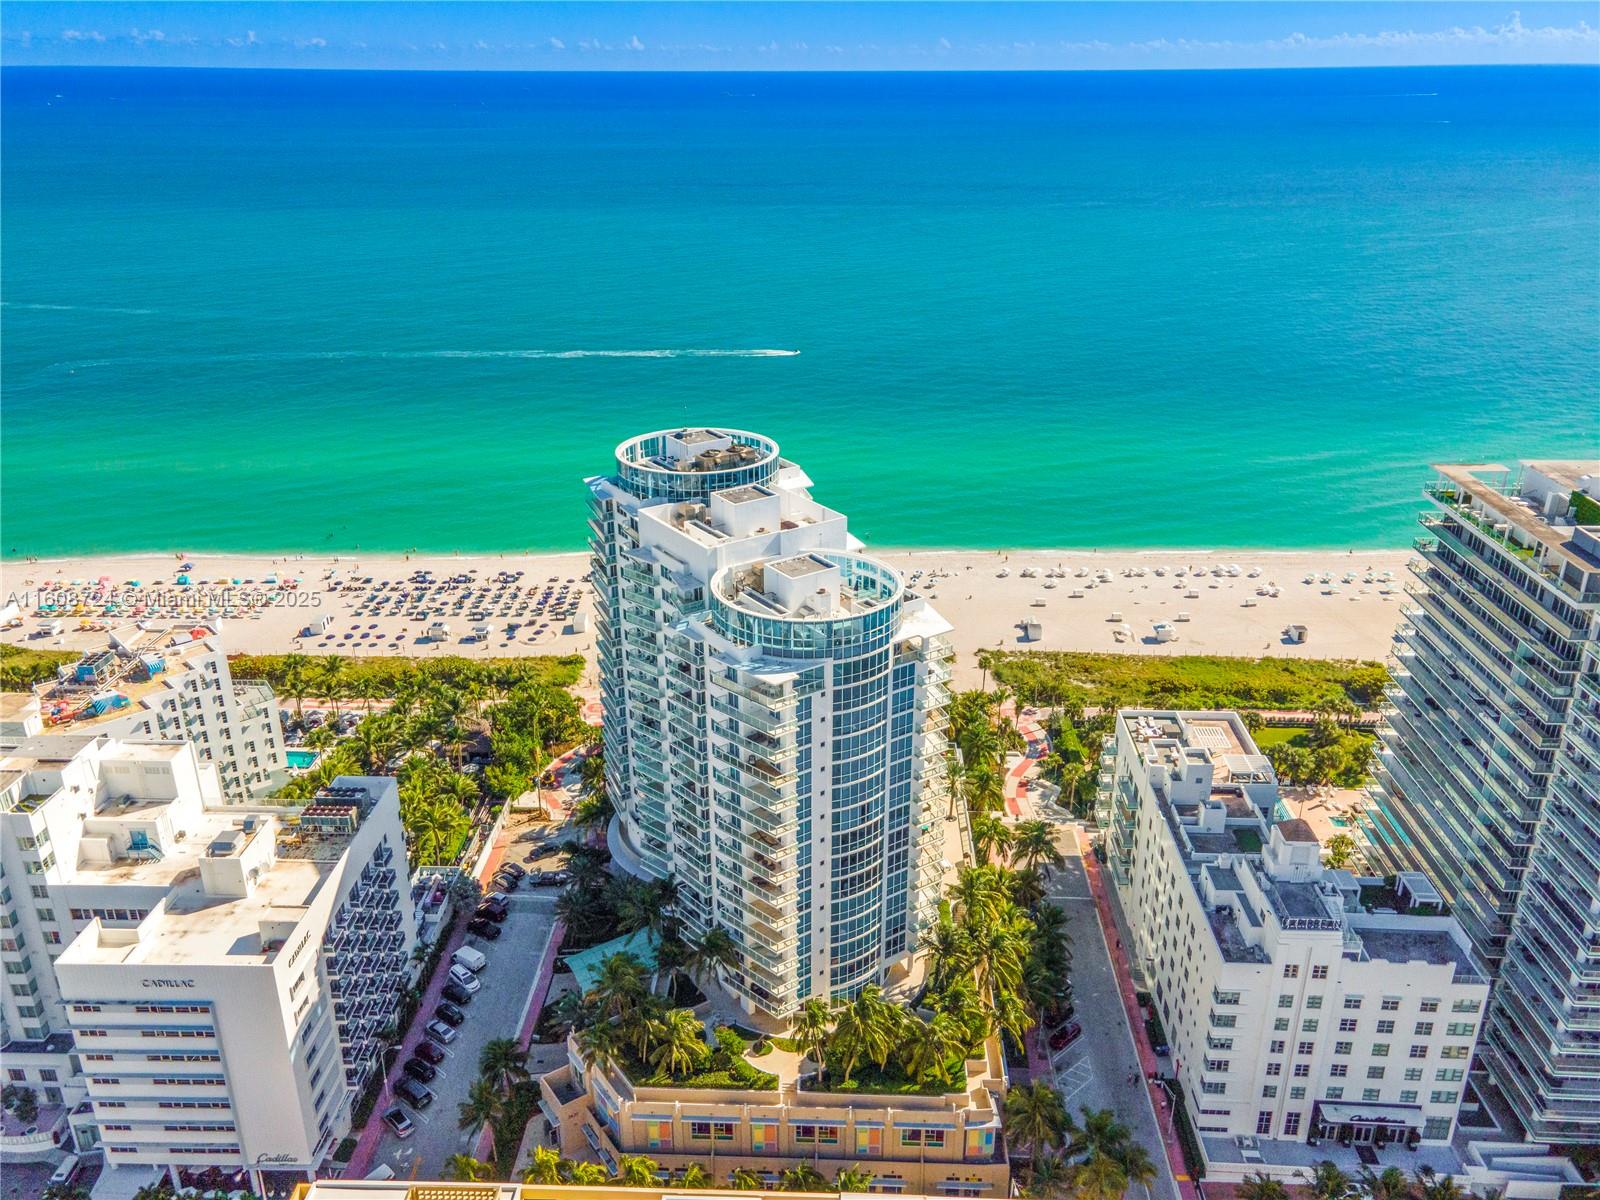
Active
$2,399,000
1
bds
|
1
ba
|
866
sqft
|
built
2015
102 24th St, Miami Beach, FL 33139
$-11,348
Cash flow
-24.7%
Cash-on-Cash Return
0.5%
Cap rate
0.3%
Rent to Value Ratio
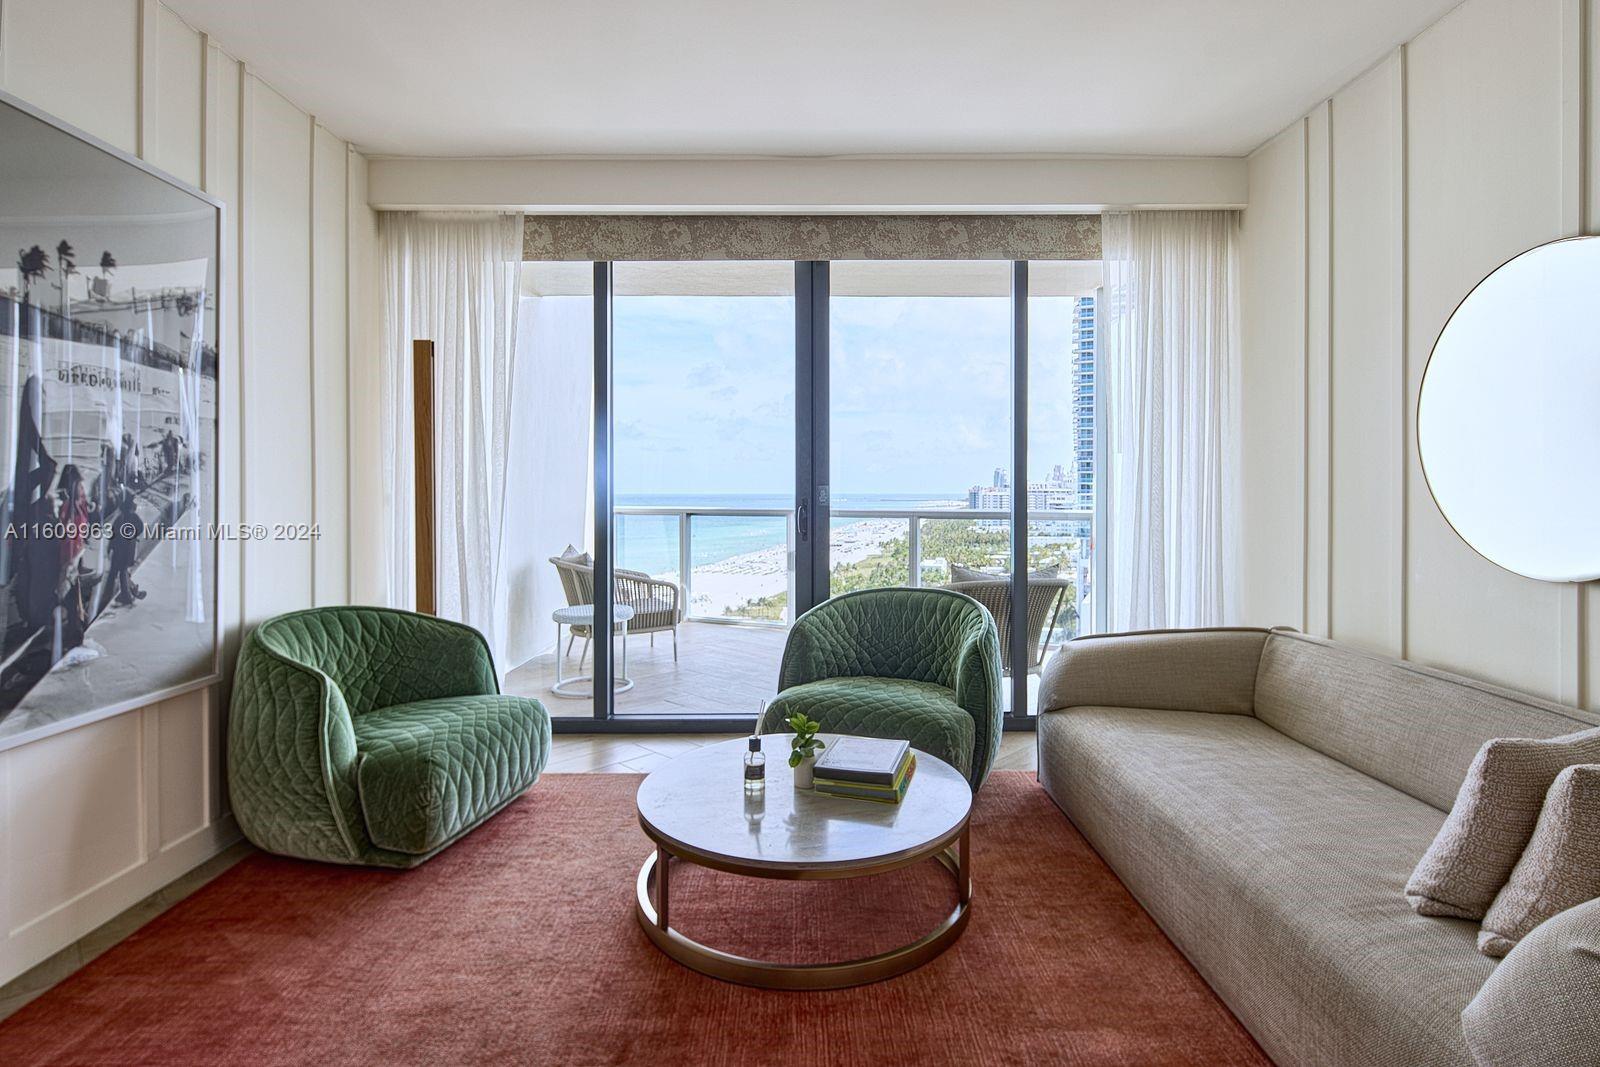
Active
$799,000
2
bds
|
2
ba
|
1,088
sqft
|
built
1964
1100 West Ave, Miami Beach, FL 33139
$-3,918
Cash flow
-25.6%
Cash-on-Cash Return
0.3%
Cap rate
0.8%
Rent to Value Ratio
Active
$1,495,000
bds
|
1
ba
|
574
sqft
|
built
2009
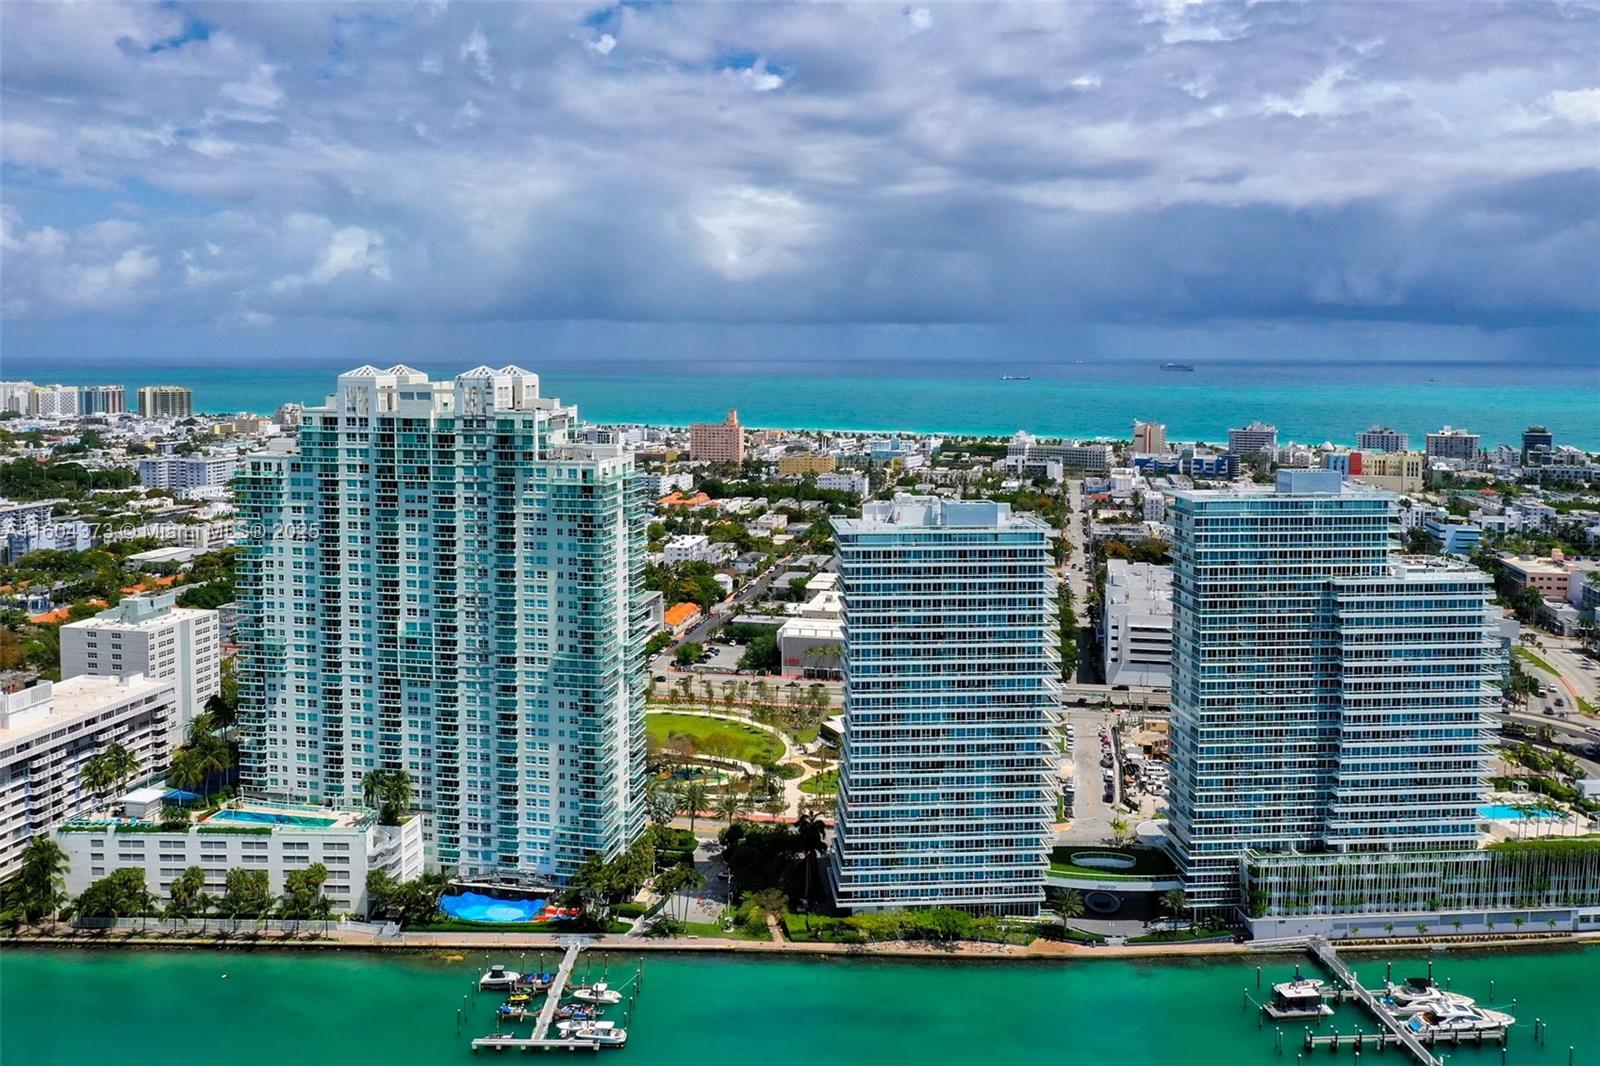
2201 Collins Ave, Miami Beach, FL 33139
$-8,028
Cash flow
-28.0%
Cash-on-Cash Return
-0.3%
Cap rate
0.3%
Rent to Value Ratio
Active
$278,000
bds
|
1
ba
|
200
sqft
|
built
1939
335 Ocean Dr, Miami Beach, FL 33139
$-559
Cash flow
-10.5%
Cash-on-Cash Return
3.7%
Cap rate
0.8%
Rent to Value Ratio
Active
$1,674,000
3
bds
|
4
ba
|
1,862
sqft
|
built
2004
6101 Aqua Ave, Miami Beach, FL 33141
$-6,007
Cash flow
-18.7%
Cash-on-Cash Return
1.8%
Cap rate
0.6%
Rent to Value Ratio
Active
$280,000
1
bds
|
1
ba
|
640
sqft
|
built
1949
1925 Washington Ave, Miami Beach, FL 33139
$-1,013
Cash flow
-18.9%
Cash-on-Cash Return
1.8%
Cap rate
0.7%
Rent to Value Ratio
Active
$380,000
bds
|
1
ba
|
430
sqft
|
built
1966
5445 Collins Ave, Miami Beach, FL 33140
$-1,595
Cash flow
-21.9%
Cash-on-Cash Return
1.1%
Cap rate
0.7%
Rent to Value Ratio
Active
$695,000
2
bds
|
2
ba
|
1,121
sqft
|
built
1980
2401 Collins Ave, Miami Beach, FL 33140
$-2,790
Cash flow
-20.9%
Cash-on-Cash Return
1.3%
Cap rate
0.5%
Rent to Value Ratio
Active
$150,000
bds
|
1
ba
|
290
sqft
|
built
1925
642 Michigan Ave, Miami Beach, FL 33139
$-233
Cash flow
-8.1%
Cash-on-Cash Return
4.3%
Cap rate
1.2%
Rent to Value Ratio
Active
$599,900
1
bds
|
2
ba
|
1,030
sqft
|
built
1980
2401 Collins Ave, Miami Beach, FL 33140
$-2,713
Cash flow
-23.6%
Cash-on-Cash Return
0.7%
Cap rate
0.5%
Rent to Value Ratio
Active
$800,000
2
bds
|
2
ba
|
1,750
sqft
|
built
1967
5600 Collins Ave, Miami Beach, FL 33140
$-3,145
Cash flow
-20.5%
Cash-on-Cash Return
1.4%
Cap rate
0.7%
Rent to Value Ratio
Active
$750,000
bds
|
1
ba
|
660
sqft
|
built
1926
2301 Collins Ave, Miami Beach, FL 33139
$-1,635
Cash flow
-11.4%
Cash-on-Cash Return
3.5%
Cap rate
0.7%
Rent to Value Ratio
Active
$1,695,000
3
bds
|
3
ba
|
1,525
sqft
|
built
2006
3801 Collins Ave, Miami Beach, FL 33140
$-8,093
Cash flow
-24.9%
Cash-on-Cash Return
0.4%
Cap rate
0.5%
Rent to Value Ratio

Active
$349,000
1
bds
|
1
ba
|
650
sqft
|
built
1947
730 12th St, Miami Beach, FL 33139
$-835
Cash flow
-12.5%
Cash-on-Cash Return
3.3%
Cap rate
0.8%
Rent to Value Ratio
Active
$1,000,000
1
bds
|
1
ba
|
760
sqft
|
built
1926
2301 Collins Ave, Miami Beach, FL 33139
$-2,831
Cash flow
-14.8%
Cash-on-Cash Return
2.7%
Cap rate
0.4%
Rent to Value Ratio
Active
$15,500,000
5
bds
|
6
ba
|
5,094
sqft
|
built
2025
535 N Shore Dr, Miami Beach, FL 33141
$-73,793
Cash flow
-24.8%
Cash-on-Cash Return
0.4%
Cap rate
0.1%
Rent to Value Ratio

Active
$395,000
bds
|
1
ba
|
400
sqft
|
built
1966
5445 Collins Ave, Miami Beach, FL 33140
$-1,516
Cash flow
-20.0%
Cash-on-Cash Return
1.5%
Cap rate
0.7%
Rent to Value Ratio
Active
$995,000
2
bds
|
2
ba
|
1,030
sqft
|
built
1966
5161 Collins Ave, Miami Beach, FL 33140
$-4,214
Cash flow
-22.1%
Cash-on-Cash Return
1.1%
Cap rate
0.5%
Rent to Value Ratio
Active
$1,580,000
2
bds
|
2
ba
|
1,372
sqft
|
built
1997
650 West Ave, Miami Beach, FL 33139
$-4,313
Cash flow
-14.2%
Cash-on-Cash Return
2.9%
Cap rate
0.5%
Rent to Value Ratio
Active
$3,200,000
3
bds
|
4
ba
|
2,229
sqft
|
built
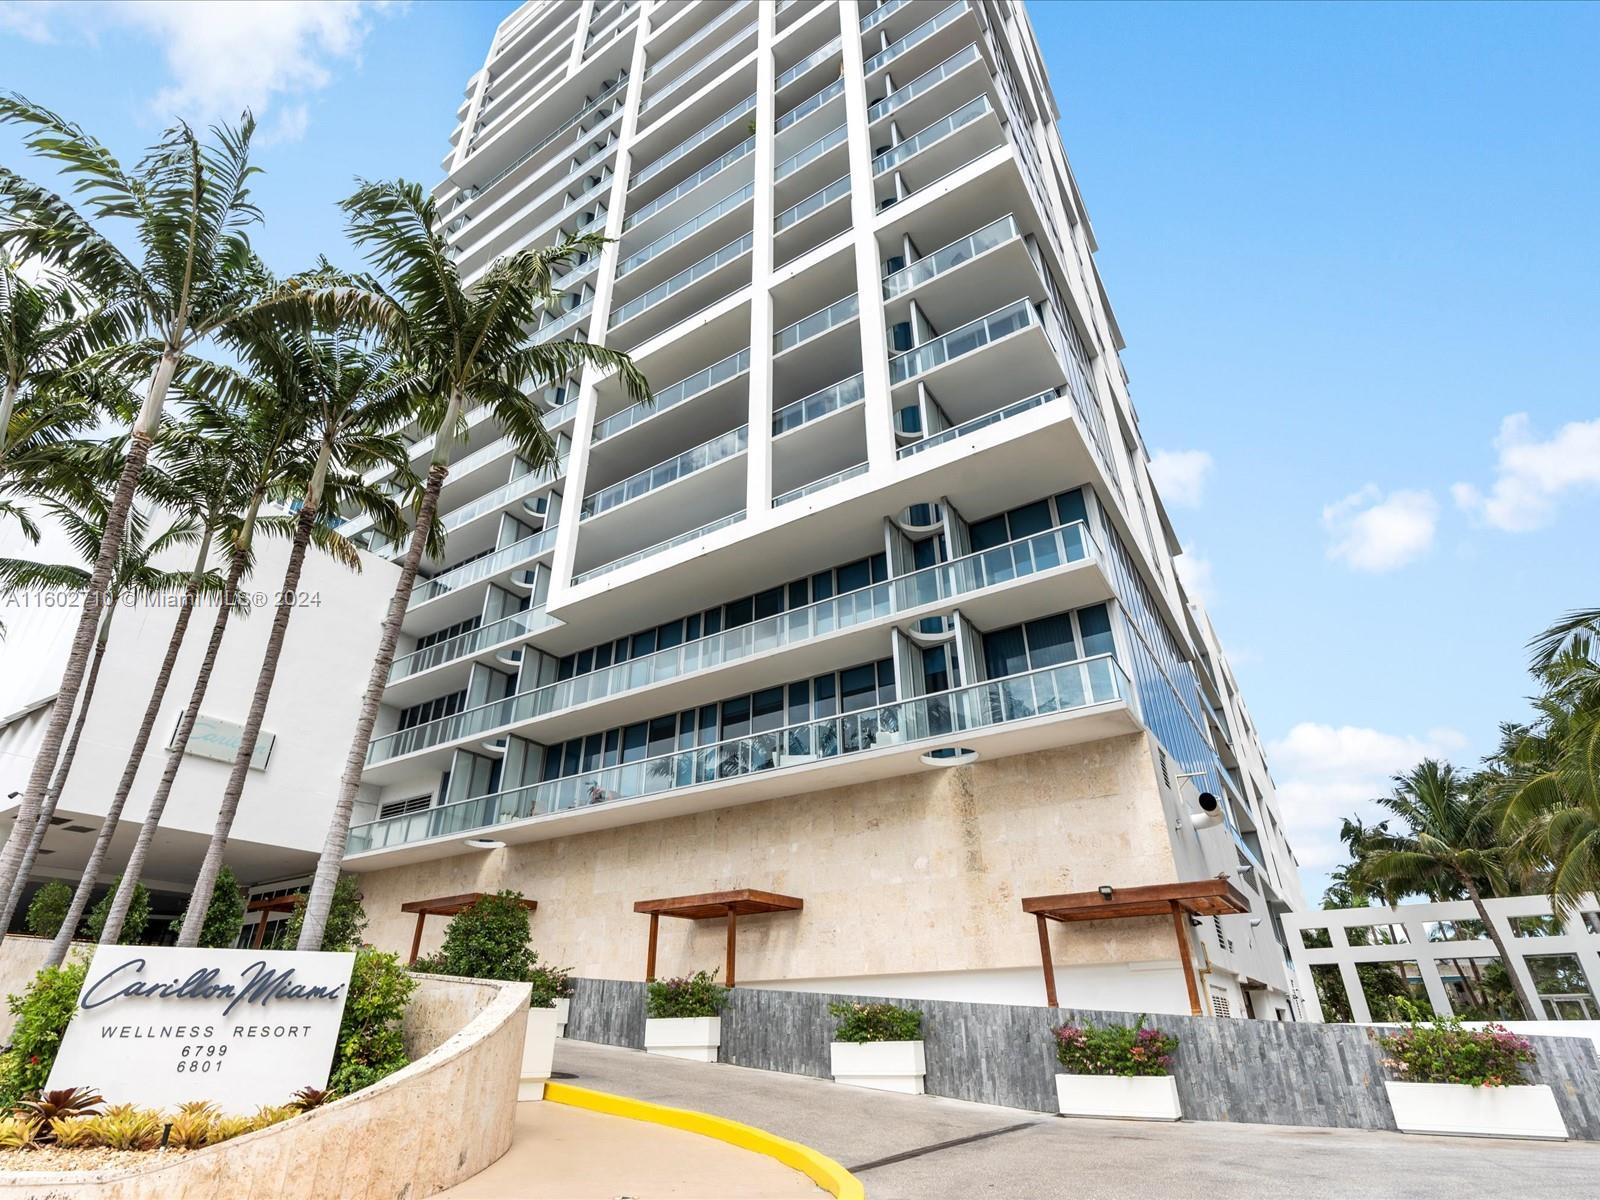
2008
6799 Collins Ave, Miami Beach, FL 33141
$-19,684
Cash flow
-32.1%
Cash-on-Cash Return
-1.2%
Cap rate
0.3%
Rent to Value Ratio
Active
$2,720,000
2
bds
|
2
ba
|
1,141
sqft
|
built
2004
101 20th St, Miami Beach, FL 33139
$-15,870
Cash flow
-30.4%
Cash-on-Cash Return
-0.9%
Cap rate
0.3%
Rent to Value Ratio

Active
$549,000
1
bds
|
2
ba
|
930
sqft
|
built
1968
5601 Collins Ave, Miami Beach, FL 33140
$-856
Cash flow
-8.1%
Cash-on-Cash Return
4.3%
Cap rate
0.7%
Rent to Value Ratio
Active
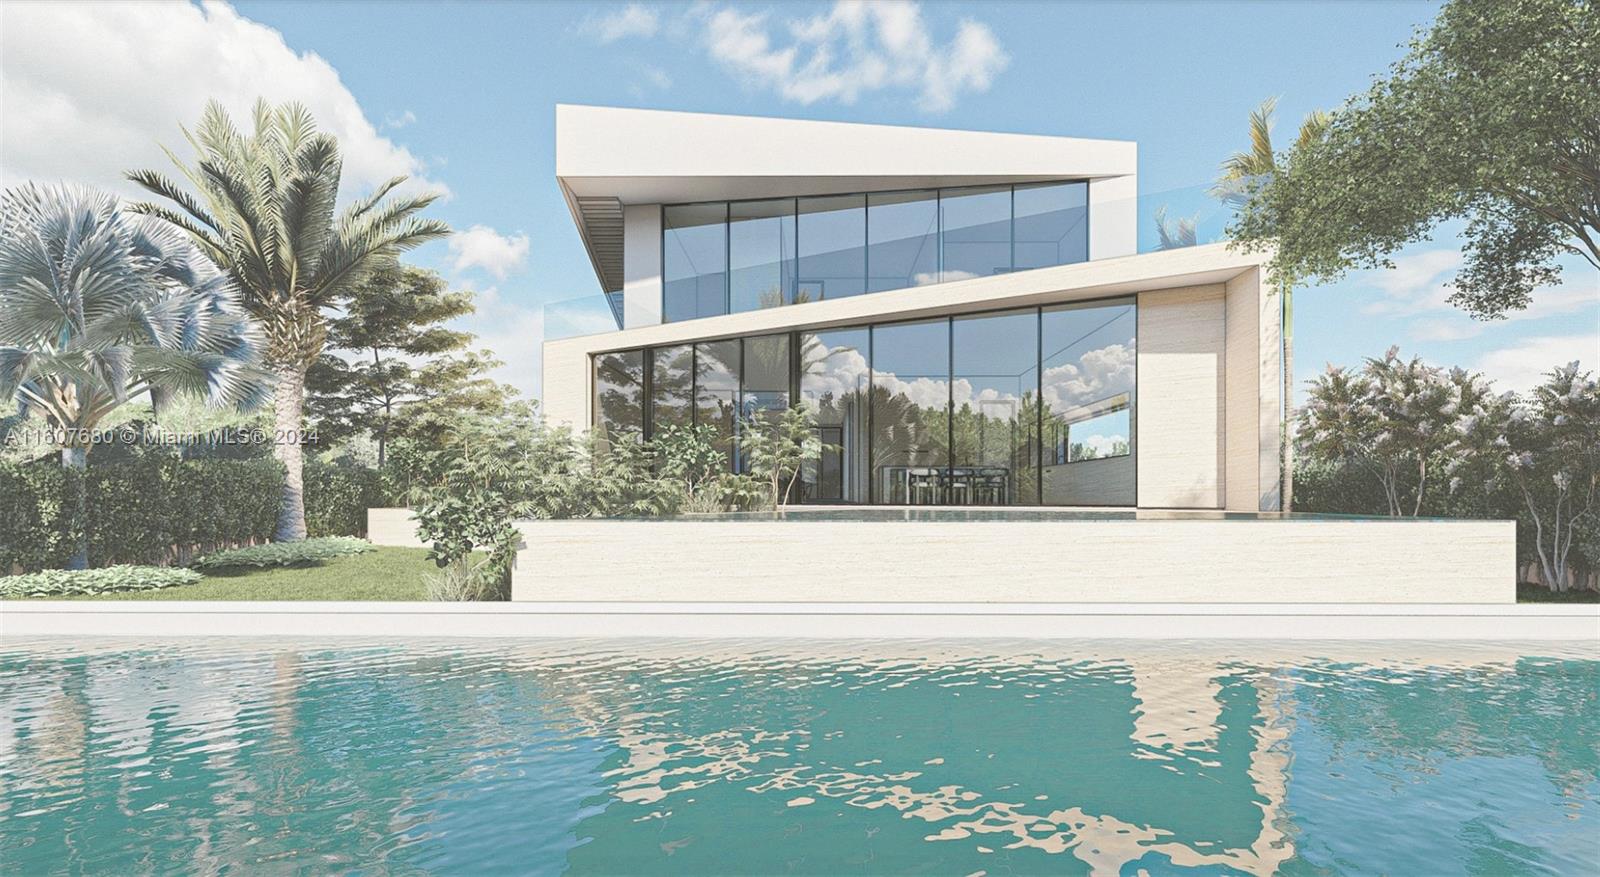
$5,000,000
5
bds
|
8
ba
|
5,024
sqft
|
built
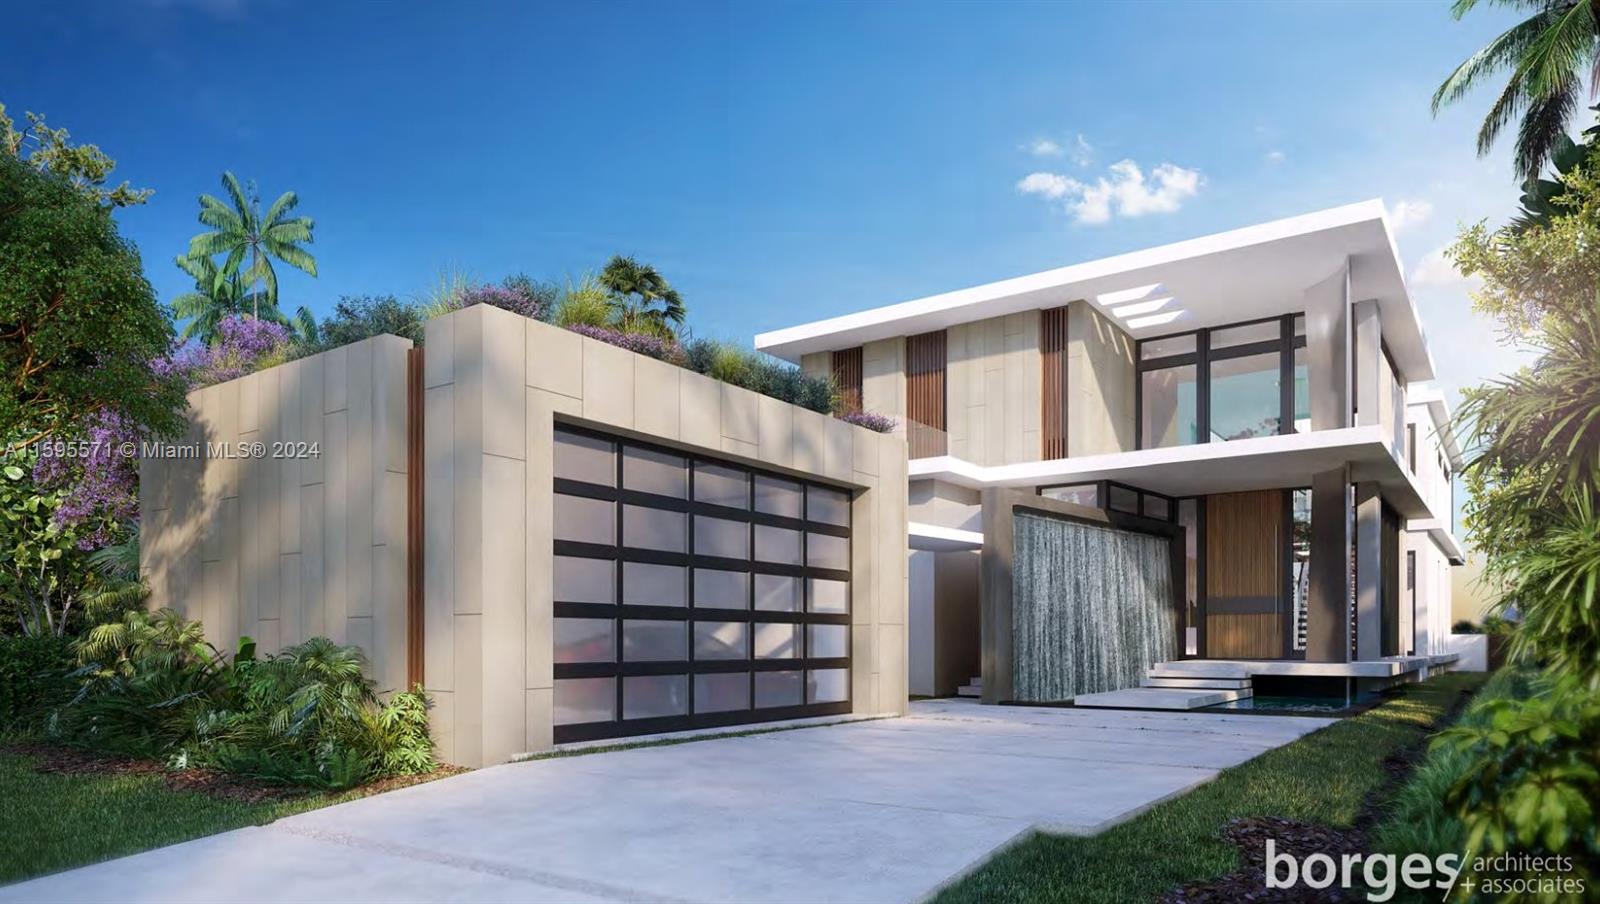
2027
4230 Chase Ave, Miami Beach, FL 33140
$-23,967
Cash flow
-25.0%
Cash-on-Cash Return
0.4%
Cap rate
0.2%
Rent to Value Ratio
Active
$895,000
1
bds
|
2
ba
|
861
sqft
|
built
2011
421 Meridian Ave, Miami Beach, FL 33139
$-2,644
Cash flow
-15.4%
Cash-on-Cash Return
2.6%
Cap rate
0.5%
Rent to Value Ratio
Active
$1,539,000
2
bds
|
2
ba
|
1,750
sqft
|
built
1995
5025 Collins Ave, Miami Beach, FL 33140
$-7,219
Cash flow
-24.5%
Cash-on-Cash Return
0.5%
Cap rate
0.5%
Rent to Value Ratio
Active
$575,000
1
bds
|
1
ba
|
656
sqft
|
built
1970
345 Ocean Dr, Miami Beach, FL 33139
$-2,234
Cash flow
-20.3%
Cash-on-Cash Return
1.5%
Cap rate
0.5%
Rent to Value Ratio
Active
$222,123
bds
|
1
ba
|
466
sqft
|
built
1955
1135 Euclid Ave, Miami Beach, FL 33139
$-559
Cash flow
-13.1%
Cash-on-Cash Return
3.1%
Cap rate
0.8%
Rent to Value Ratio
Active
$650,000
0
bds
|
1
ba
|
430
sqft
|
built
1966
5445 Collins Ave, Miami Beach, FL 33140
$-2,065
Cash flow
-16.6%
Cash-on-Cash Return
2.3%
Cap rate
0.4%
Rent to Value Ratio

Active
$249,000
1
bds
|
1
ba
|
443
sqft
|
built
2016
1560 Meridian Ave, Miami Beach, FL 33139
$-876
Cash flow
-18.4%
Cash-on-Cash Return
1.9%
Cap rate
0.7%
Rent to Value Ratio

Active
$315,000
1
bds
|
1
ba
|
635
sqft
|
built
1925
747 Michigan Ave, Miami Beach, FL 33139
$-904
Cash flow
-15.0%
Cash-on-Cash Return
2.7%
Cap rate
0.8%
Rent to Value Ratio
Active
$650,000
bds
|
1
ba
|
430
sqft
|
built
1966
5445 Collins Ave, Miami Beach, FL 33140
$-2,042
Cash flow
-16.4%
Cash-on-Cash Return
2.4%
Cap rate
0.4%
Rent to Value Ratio

Active
$450,000
2
bds
|
2
ba
|
960
sqft
|
built
1962
5225 Collins Ave, Miami Beach, FL 33140
$-1,962
Cash flow
-22.7%
Cash-on-Cash Return
0.9%
Cap rate
0.9%
Rent to Value Ratio
Active
$400,000
1
bds
|
1
ba
|
600
sqft
|
built
1940
3917 N Meridian Ave, Miami Beach, FL 33140
$-1,417
Cash flow
-18.5%
Cash-on-Cash Return
1.9%
Cap rate
0.5%
Rent to Value Ratio
Active
$3,400,000
3
bds
|
3
ba
|
2,340
sqft
|
built
1996
300 S Pointe Dr, Miami Beach, FL 33139
$-17,971
Cash flow
-27.6%
Cash-on-Cash Return
-0.2%
Cap rate
0.3%
Rent to Value Ratio
Active
$325,000
bds
|
2
ba
|
500
sqft
|
built
2006
1437 Collins Ave, Miami Beach, FL 33139
$-1,372
Cash flow
-22.0%
Cash-on-Cash Return
1.1%
Cap rate
1.2%
Rent to Value Ratio
Active
$345,000
1
bds
|
2
ba
|
918
sqft
|
built
1977
1345 West Ave, Miami Beach, FL 33139
$-1,161
Cash flow
-17.6%
Cash-on-Cash Return
2.1%
Cap rate
0.7%
Rent to Value Ratio
Active
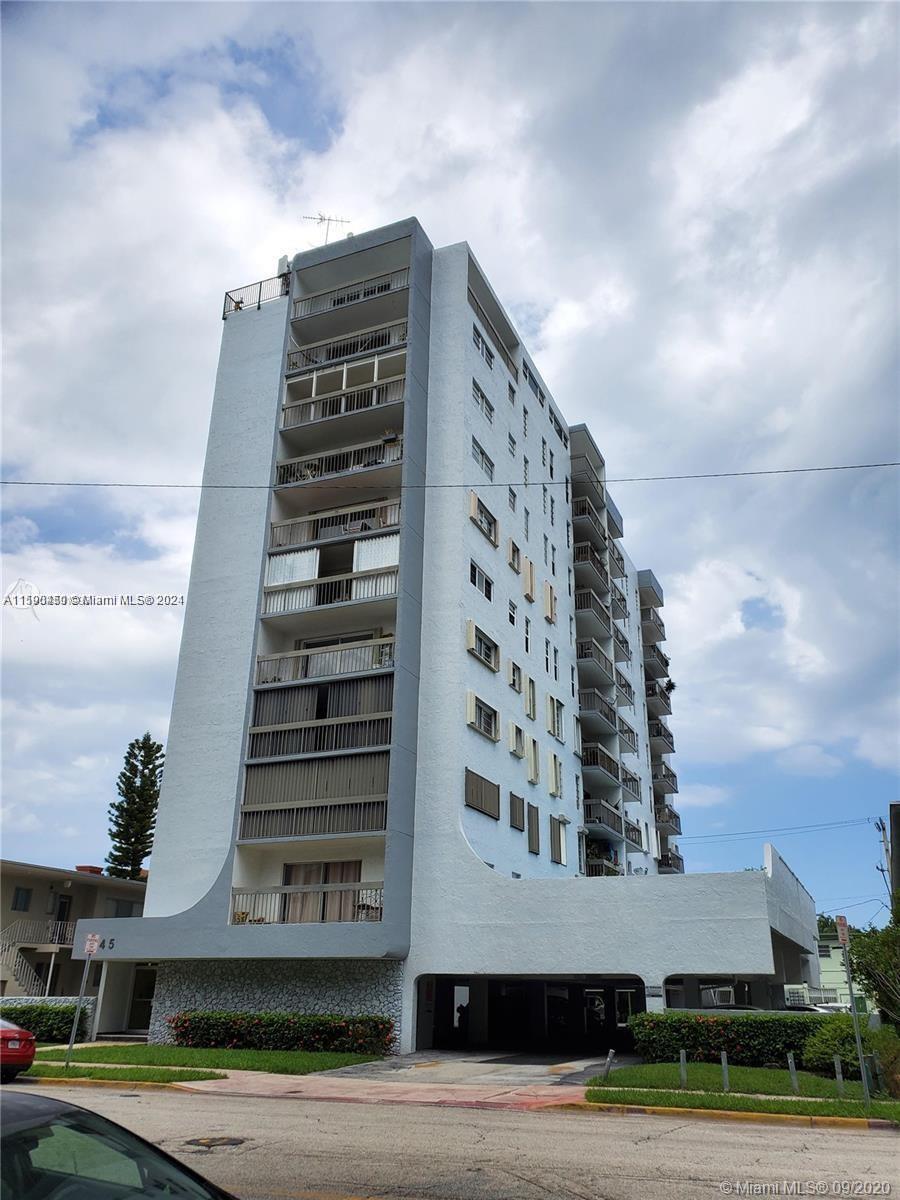
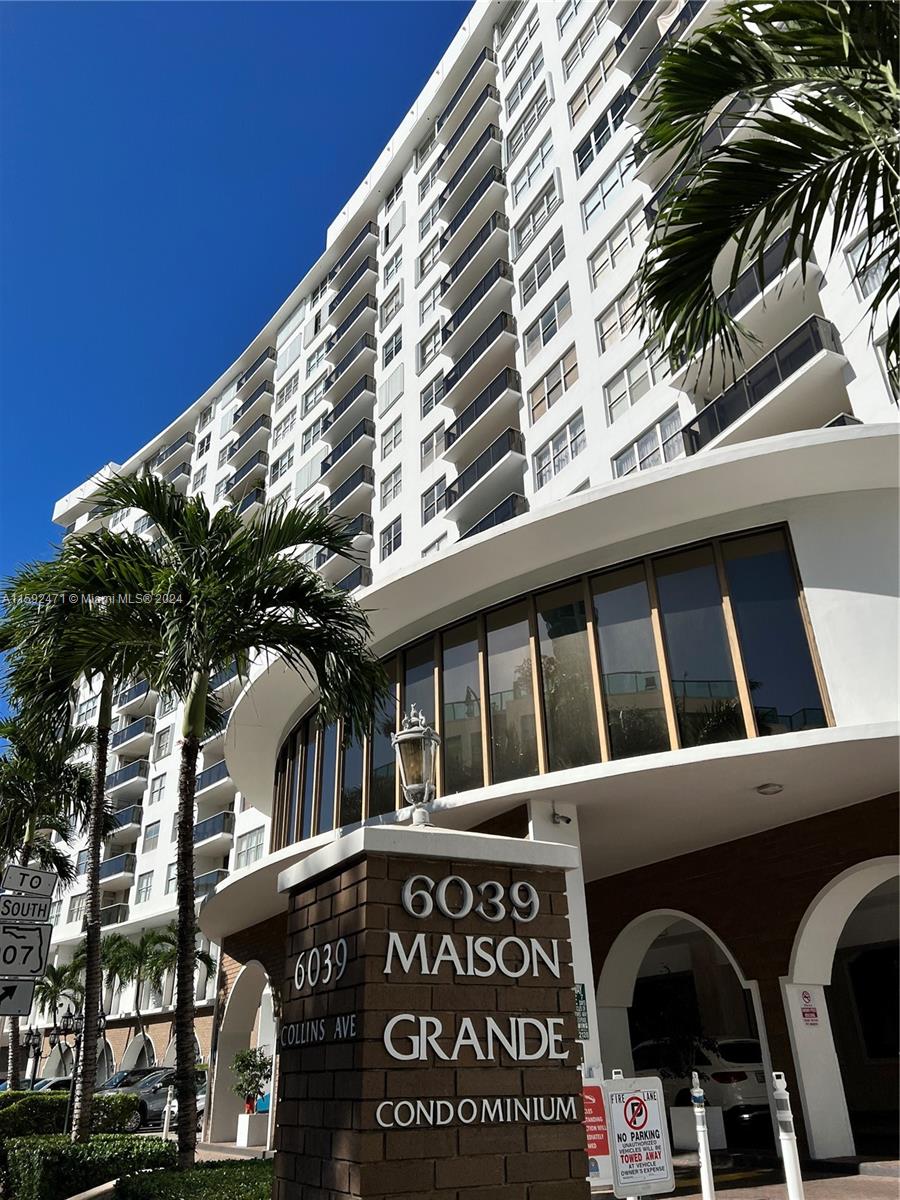
$559,000
2
bds
|
2
ba
|
1,290
sqft
|
built
1971
6039 Collins Ave, Miami Beach, FL 33140
$-2,239
Cash flow
-20.9%
Cash-on-Cash Return
1.3%
Cap rate
0.5%
Rent to Value Ratio
Active
$440,000
2
bds
|
2
ba
|
960
sqft
|
built
1962
5225 Collins Ave, Miami Beach, FL 33140
$-1,572
Cash flow
-18.6%
Cash-on-Cash Return
1.9%
Cap rate
1.0%
Rent to Value Ratio

Active
$4,440,000
3
bds
|
3
ba
|
1,850
sqft
|
built
2016
1201 20th St, Miami Beach, FL 33139
$-18,194
Cash flow
-21.4%
Cash-on-Cash Return
1.2%
Cap rate
0.2%
Rent to Value Ratio
Active
$389,999
1
bds
|
2
ba
|
715
sqft
|
built
1972
1610 Lenox Ave, Miami Beach, FL 33139
$-1,163
Cash flow
-15.6%
Cash-on-Cash Return
2.6%
Cap rate
0.6%
Rent to Value Ratio