Miami Beach, FL Investment Properties for Sale
Browse homes for sale and investment properties in Miami Beach, FL. Refine your search by price, property type, or more.
Best cash flowing properties in Miami Beach, FL
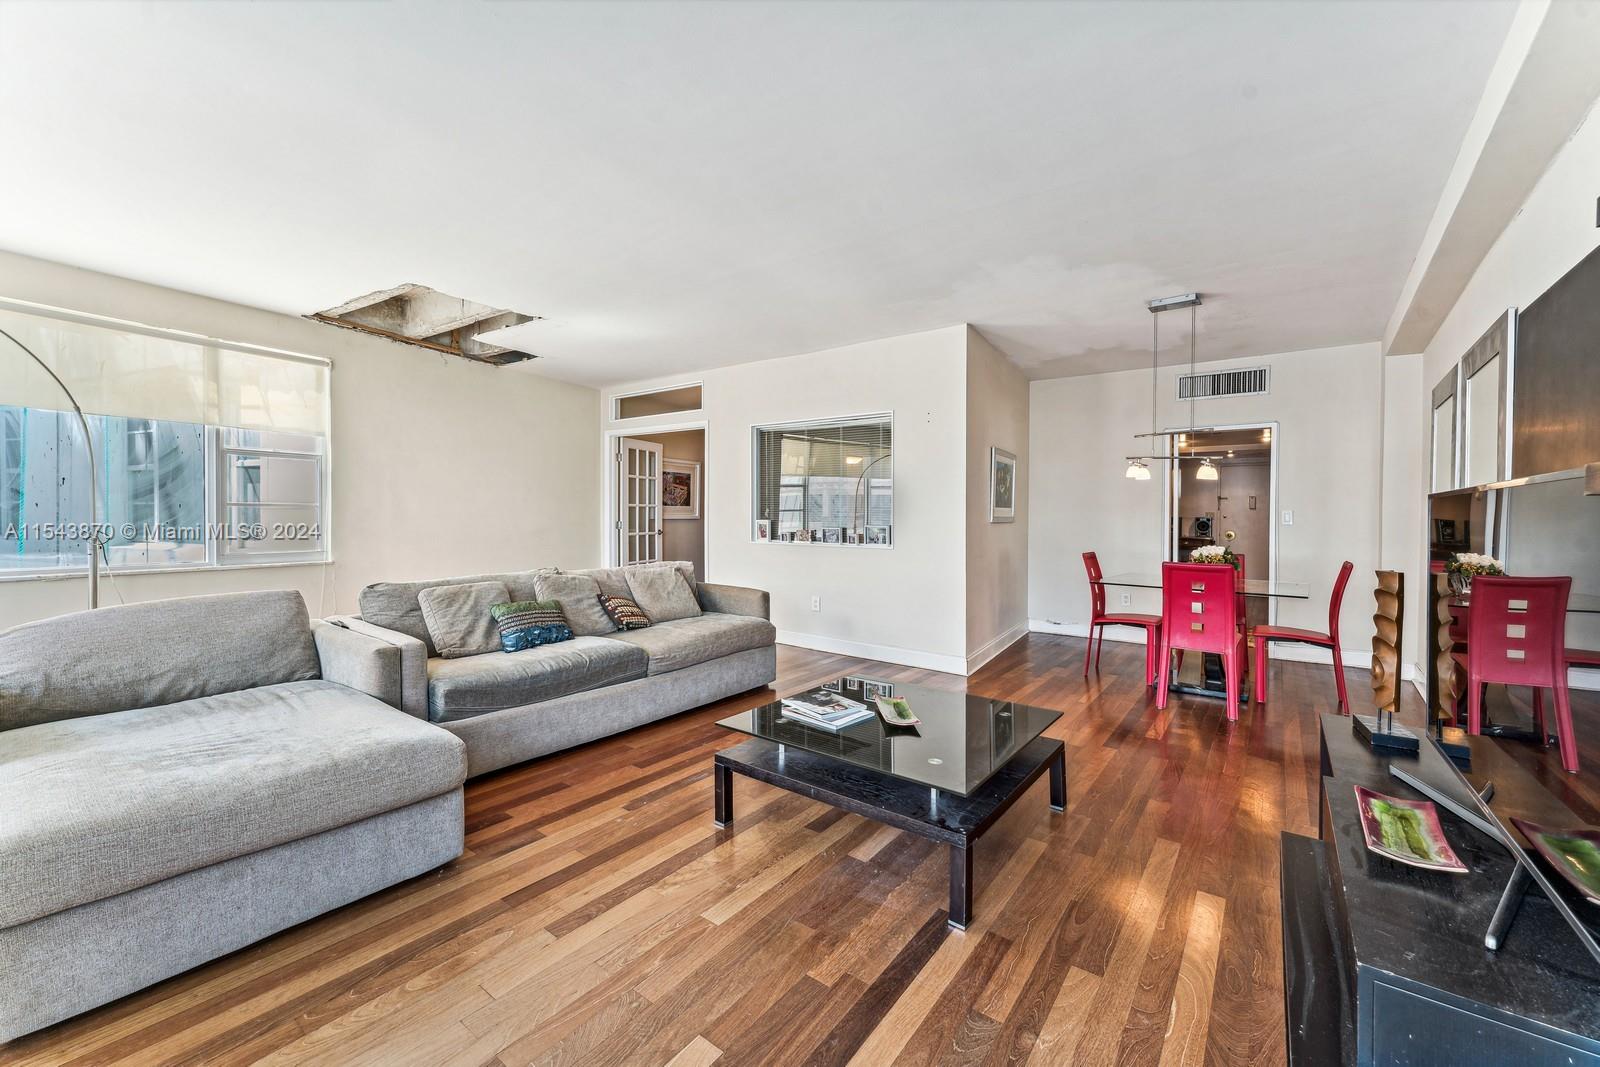
Active
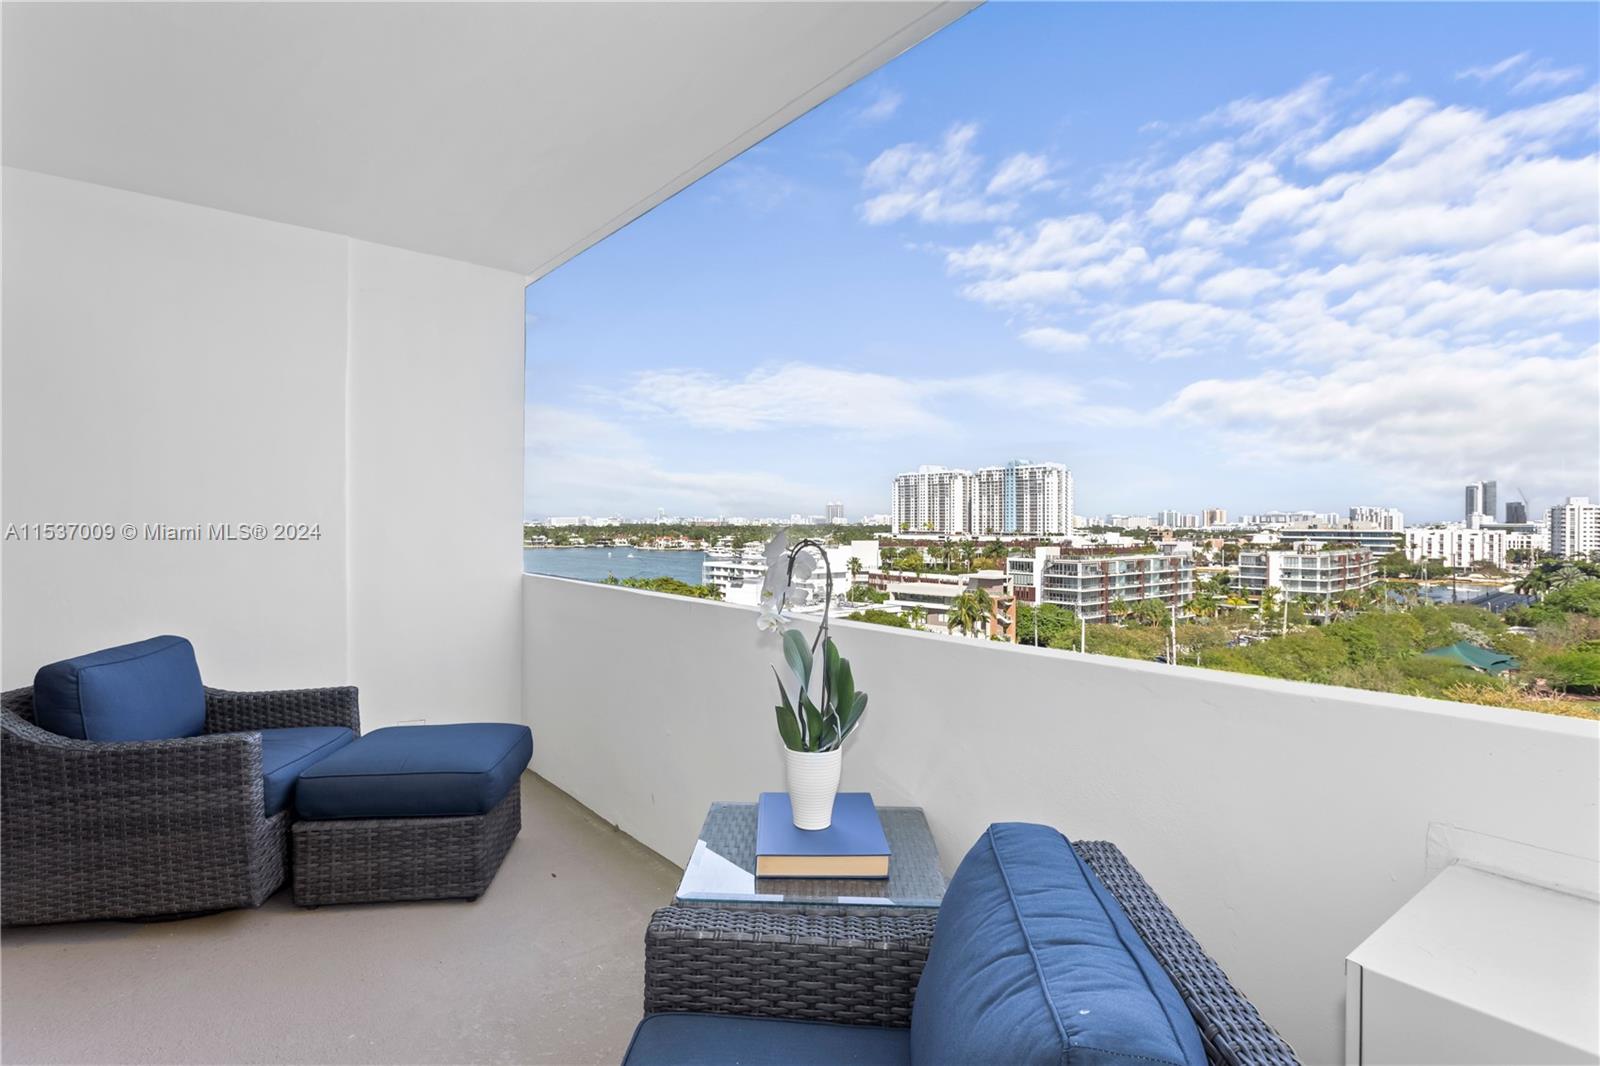
$450,000
1
bds
|
1
ba
|
861
sqft
|
built
1962
3 Island Ave, Miami Beach, FL 33139
$-29
Cash flow
-0.3%
Cash-on-Cash Return
6.1%
Cap rate
0.9%
Rent to Value Ratio
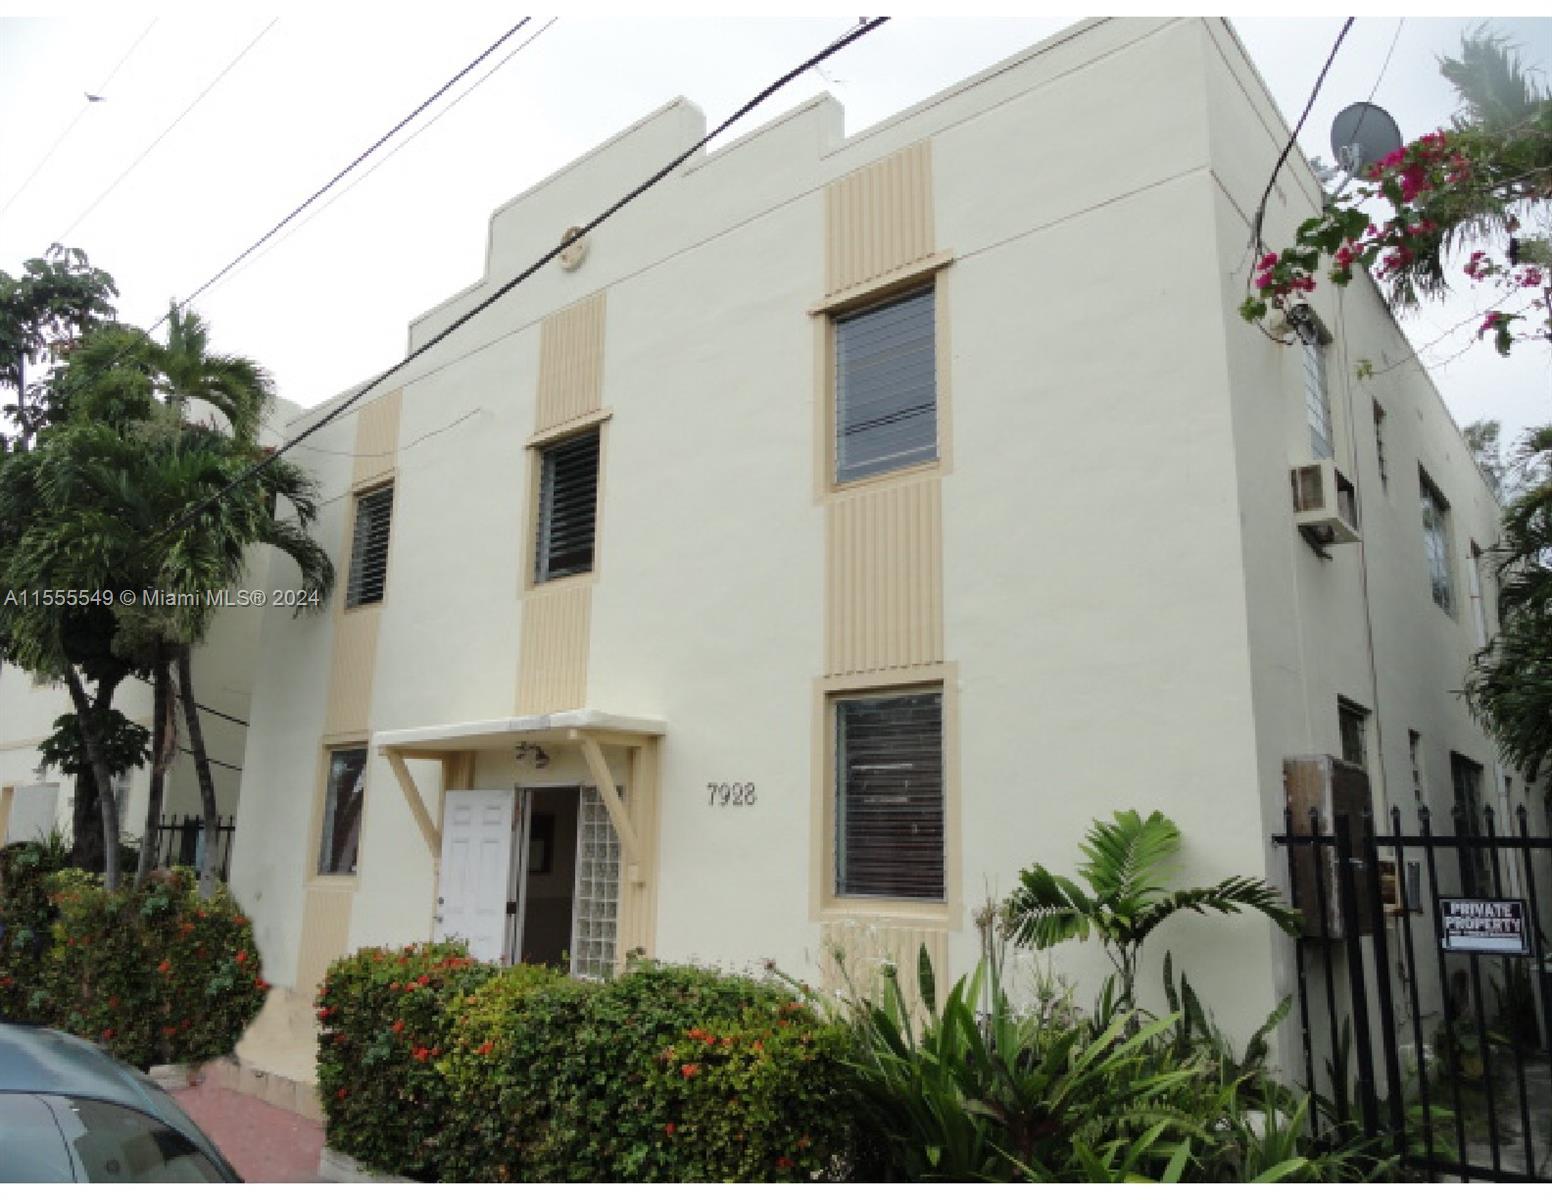
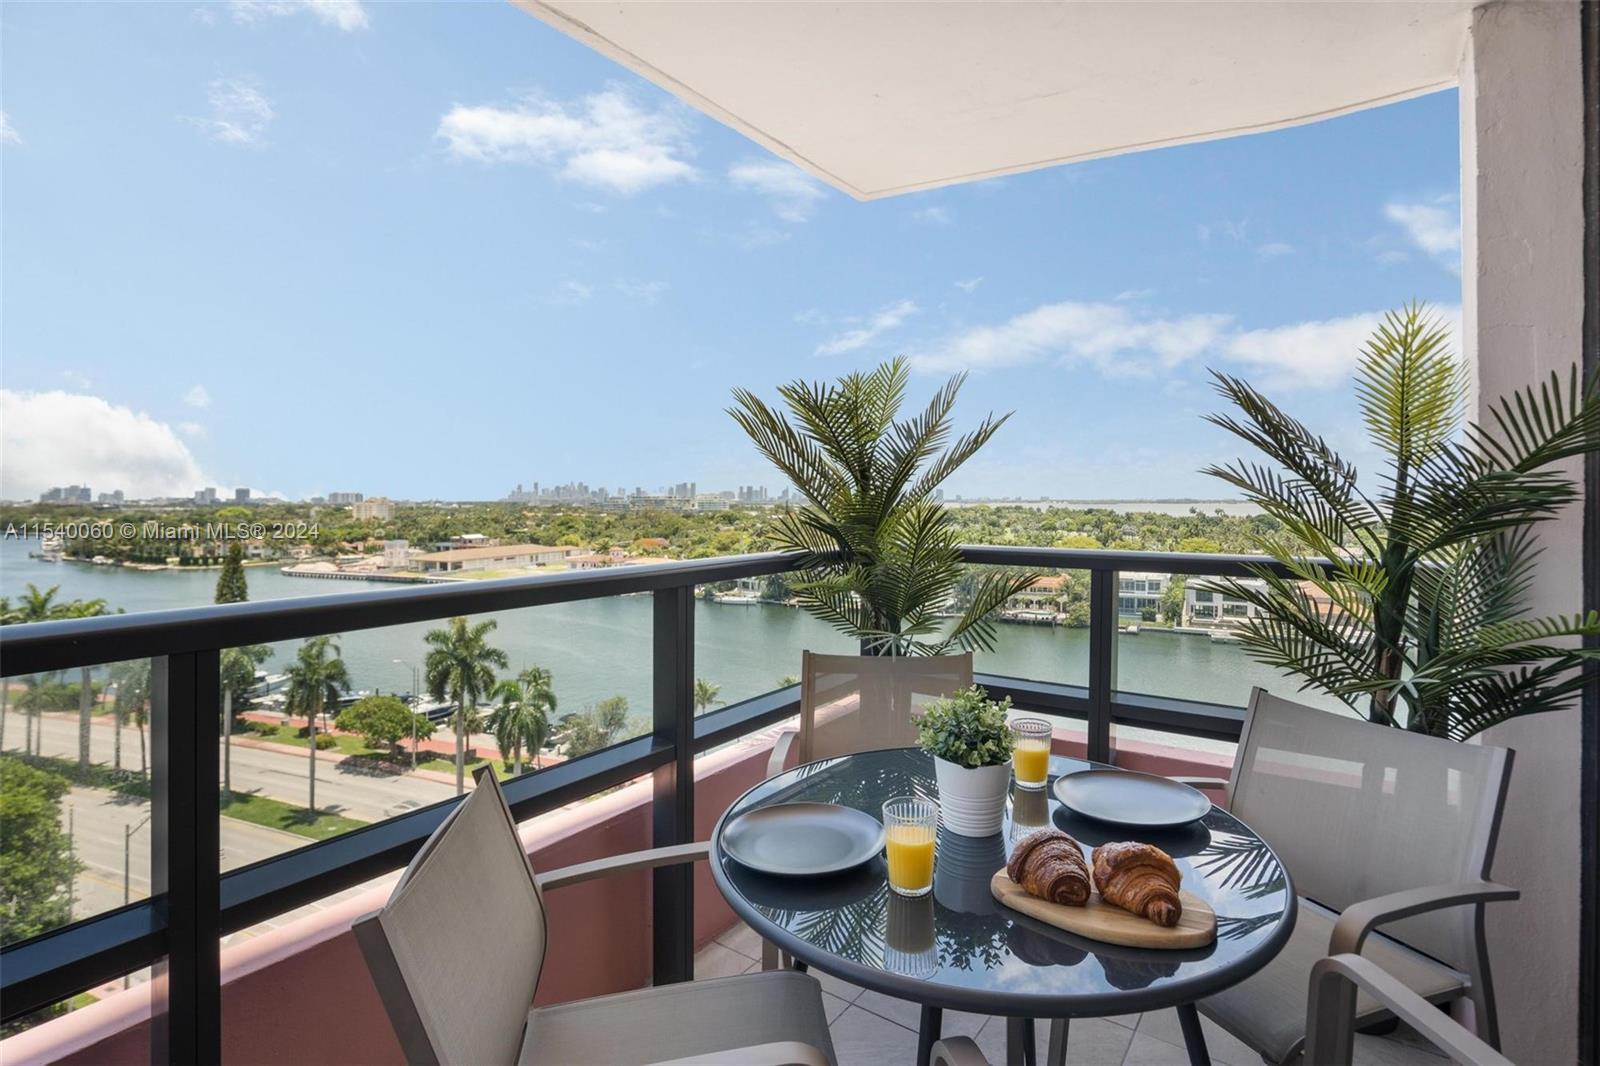
Active
$199,900
1
bds
|
1
ba
|
493
sqft
|
built
1940
7928 Harding Ave, Miami Beach, FL 33141
$-416
Cash flow
-10.9%
Cash-on-Cash Return
3.6%
Cap rate
0.9%
Rent to Value Ratio
1,984 out of 2,186 properties for sale in Miami Beach, FL
Limited Results Shown
Create a free account, or log in to reveal all property listings and enjoy the complete experience.
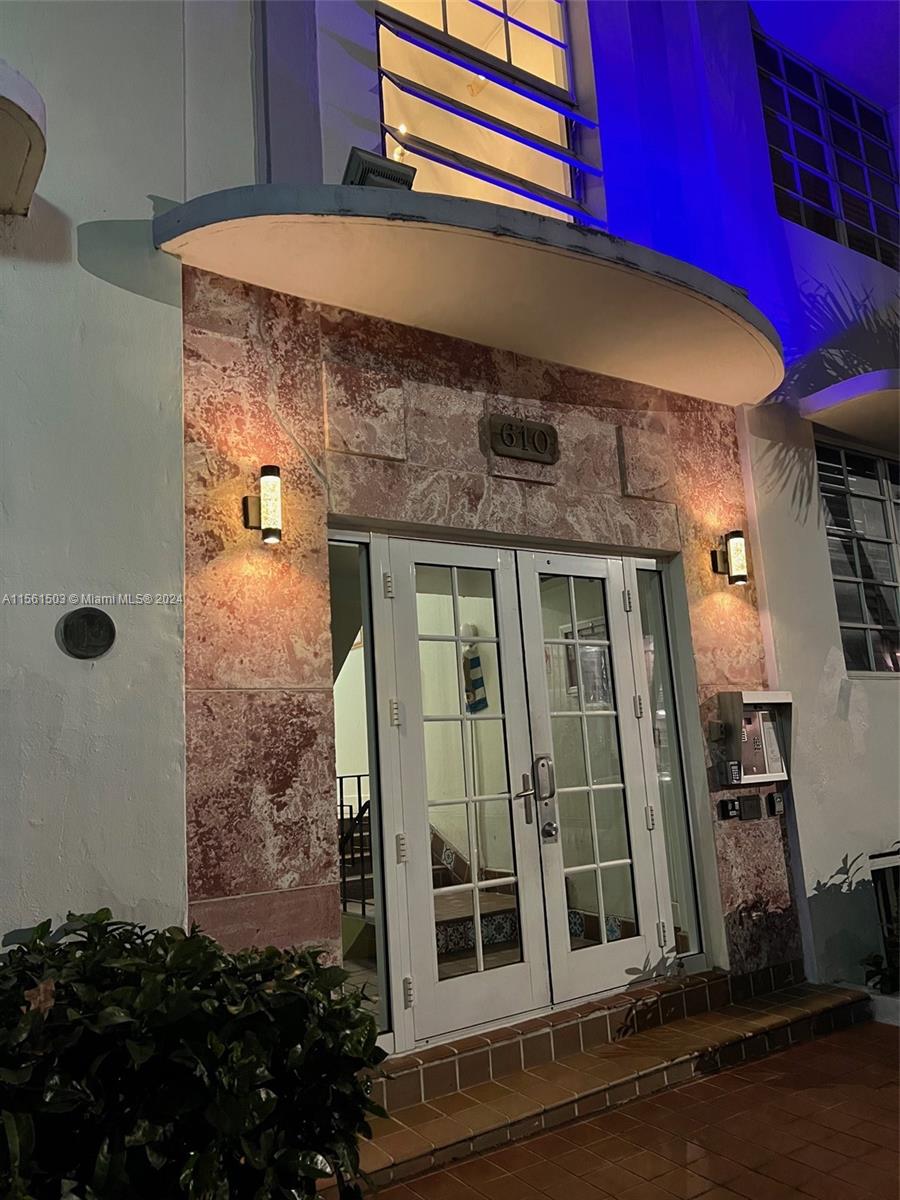
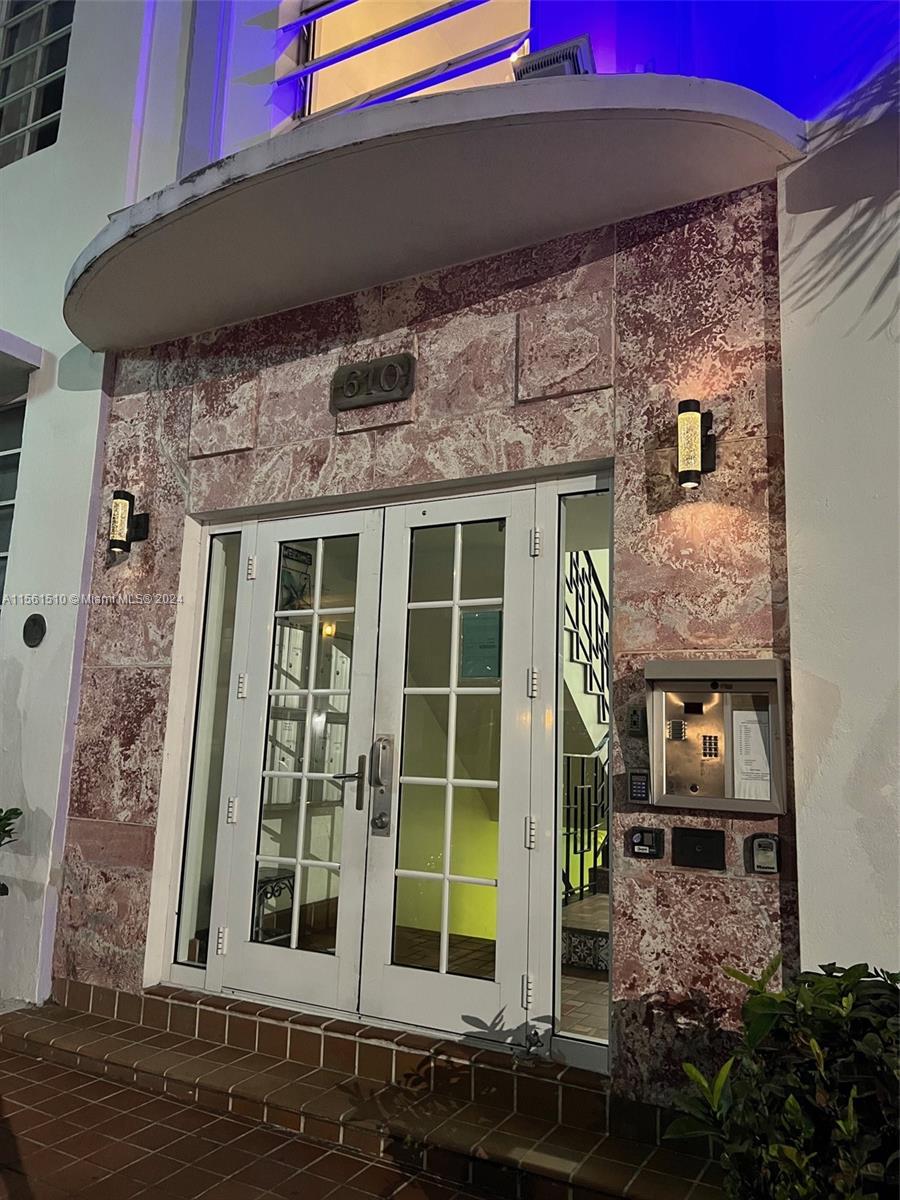
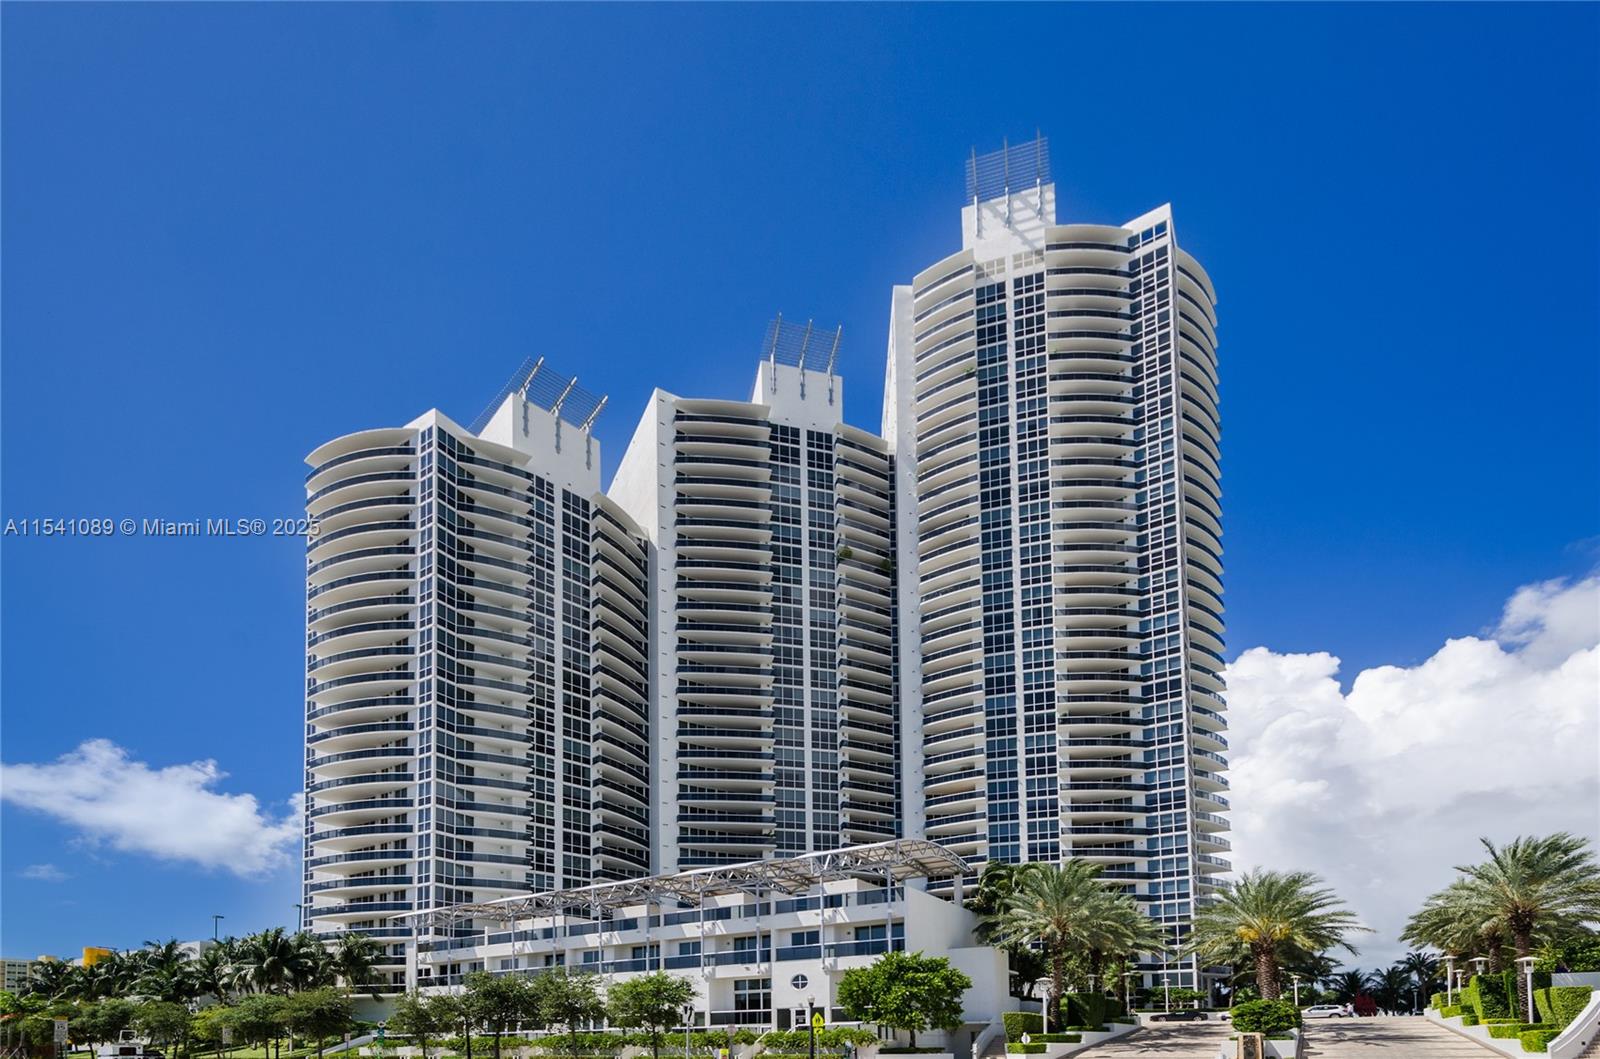
Active under contract
$256,900
1
bds
|
1
ba
|
590
sqft
|
built
1994
610 8th St, Miami Beach, FL 33139
$-813
Cash flow
-16.5%
Cash-on-Cash Return
2.3%
Cap rate
0.8%
Rent to Value Ratio
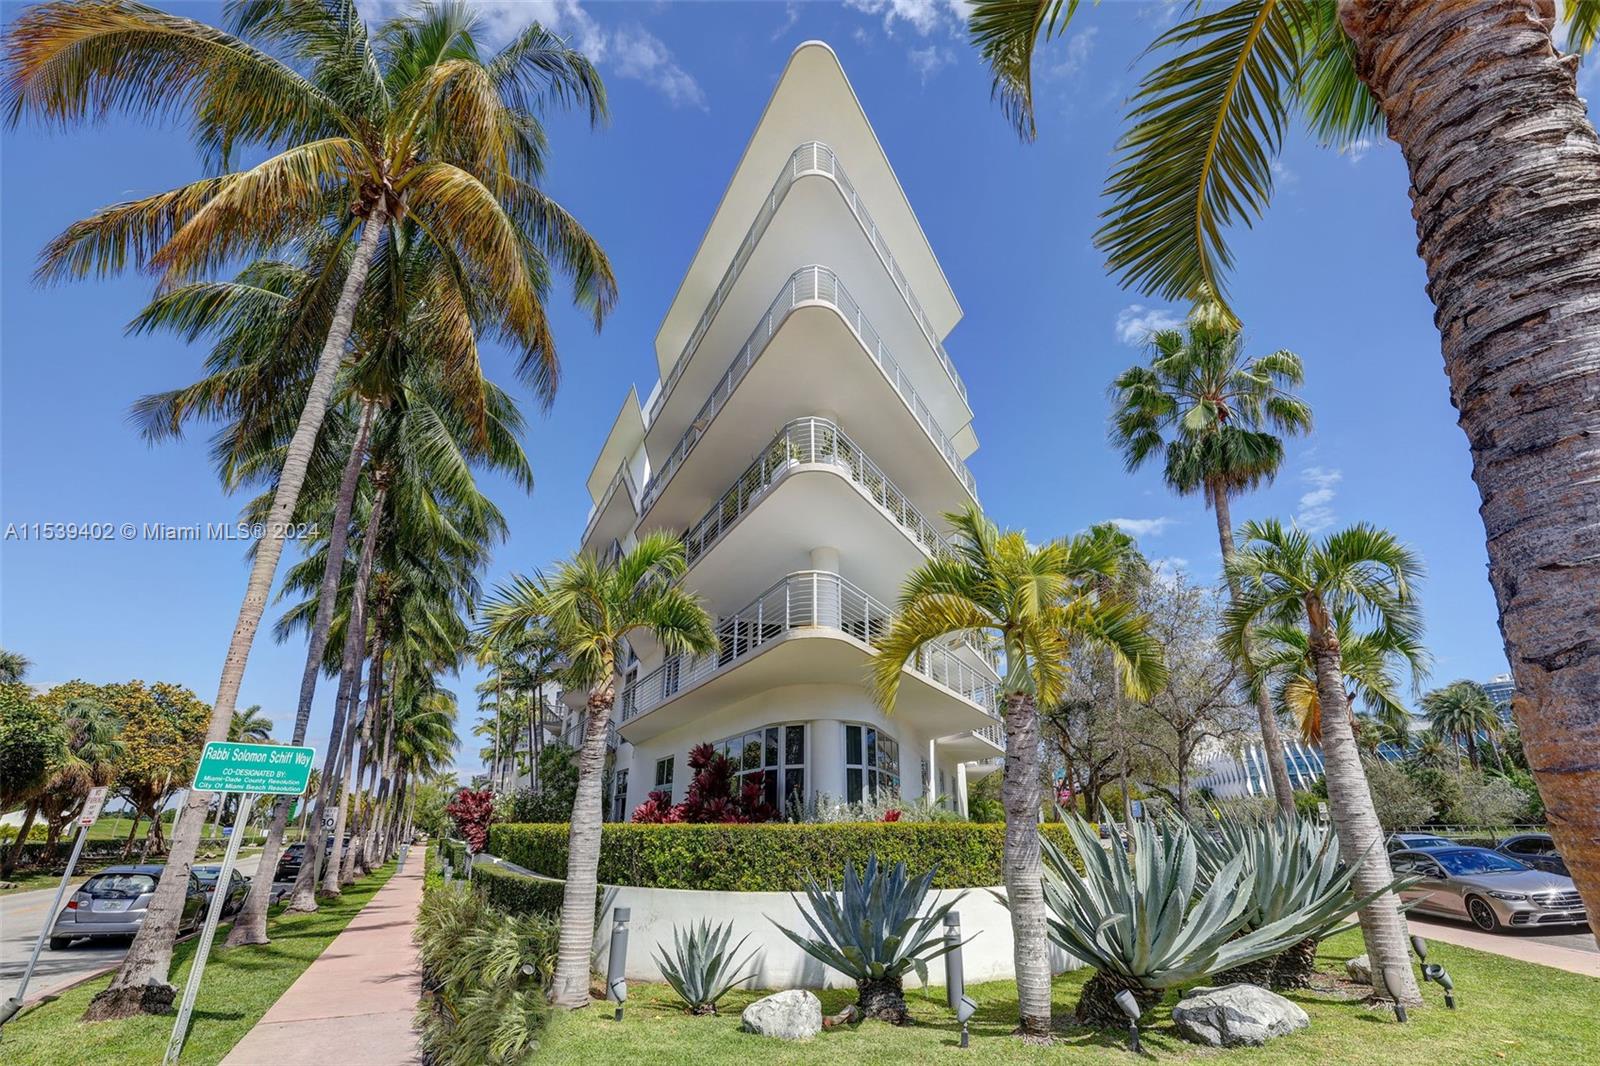
Active
$225,000
bds
|
1
ba
|
0
sqft
|
built
1960
945 Meridian Ave, Miami Beach, FL 33139
$-526
Cash flow
-12.2%
Cash-on-Cash Return
3.3%
Cap rate
0.7%
Rent to Value Ratio
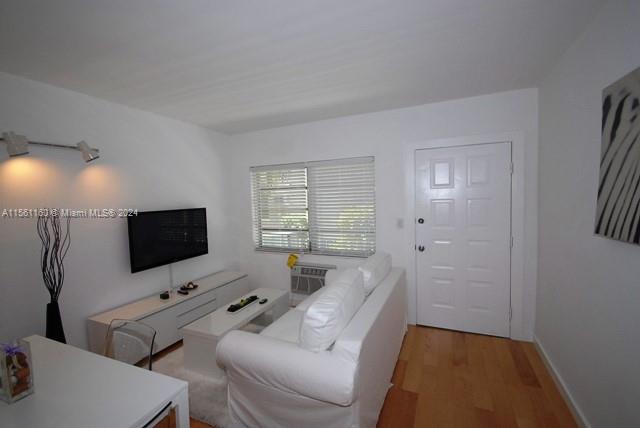
Active
$256,900
1
bds
|
1
ba
|
590
sqft
|
built
1994
610 8th St, Miami Beach, FL 33139
$-778
Cash flow
-15.8%
Cash-on-Cash Return
2.5%
Cap rate
0.8%
Rent to Value Ratio
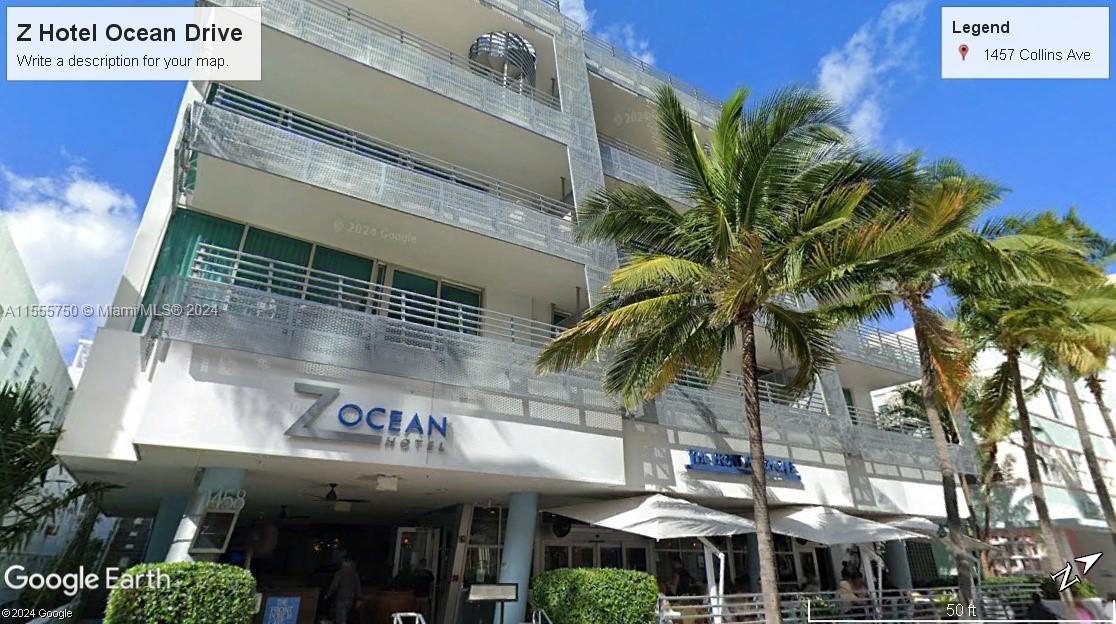
Active
$375,000
bds
|
2
ba
|
500
sqft
|
built
2006
1437 Collins Ave, Miami Beach, FL 33139
$-2,311
Cash flow
-32.2%
Cash-on-Cash Return
-1.2%
Cap rate
0.8%
Rent to Value Ratio
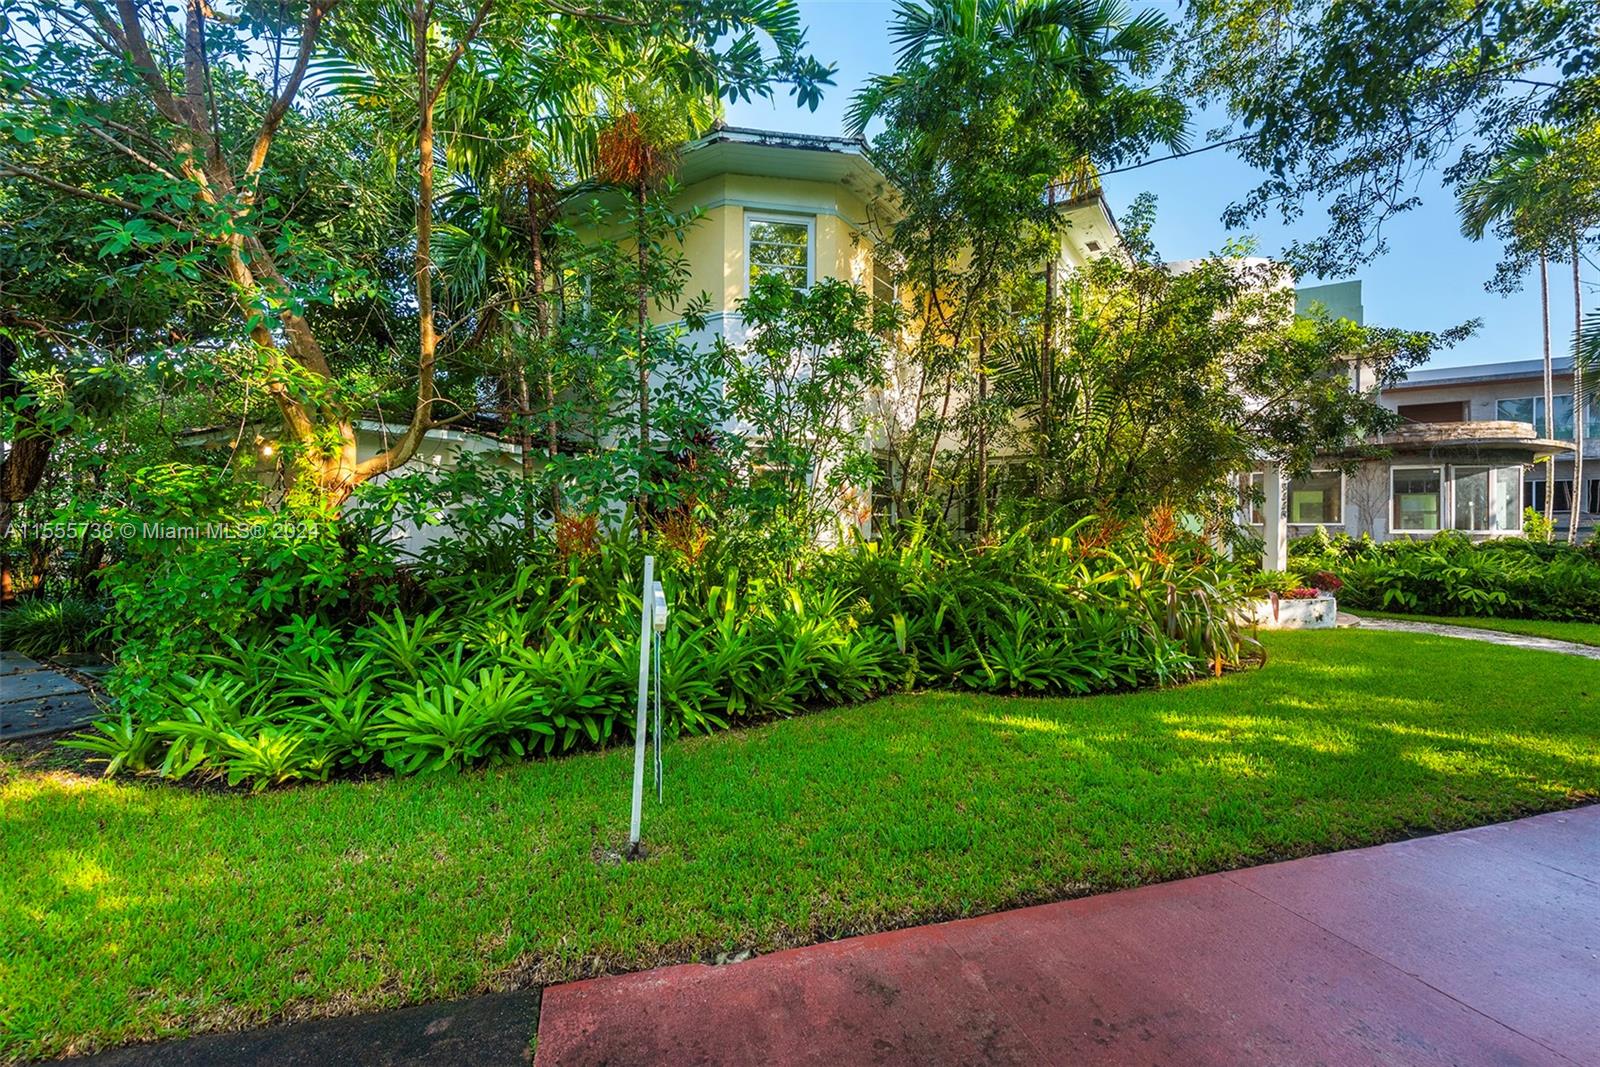
Active
$1,700,000
4
bds
|
3
ba
|
1,852
sqft
|
built
1940
3440 N Meridian Ave, Miami Beach, FL 33140
$-4,153
Cash flow
-12.7%
Cash-on-Cash Return
3.2%
Cap rate
0.5%
Rent to Value Ratio
Active
$199,900
1
bds
|
1
ba
|
493
sqft
|
built
1940
7928 Harding Ave, Miami Beach, FL 33141
$-416
Cash flow
-10.9%
Cash-on-Cash Return
3.6%
Cap rate
0.9%
Rent to Value Ratio
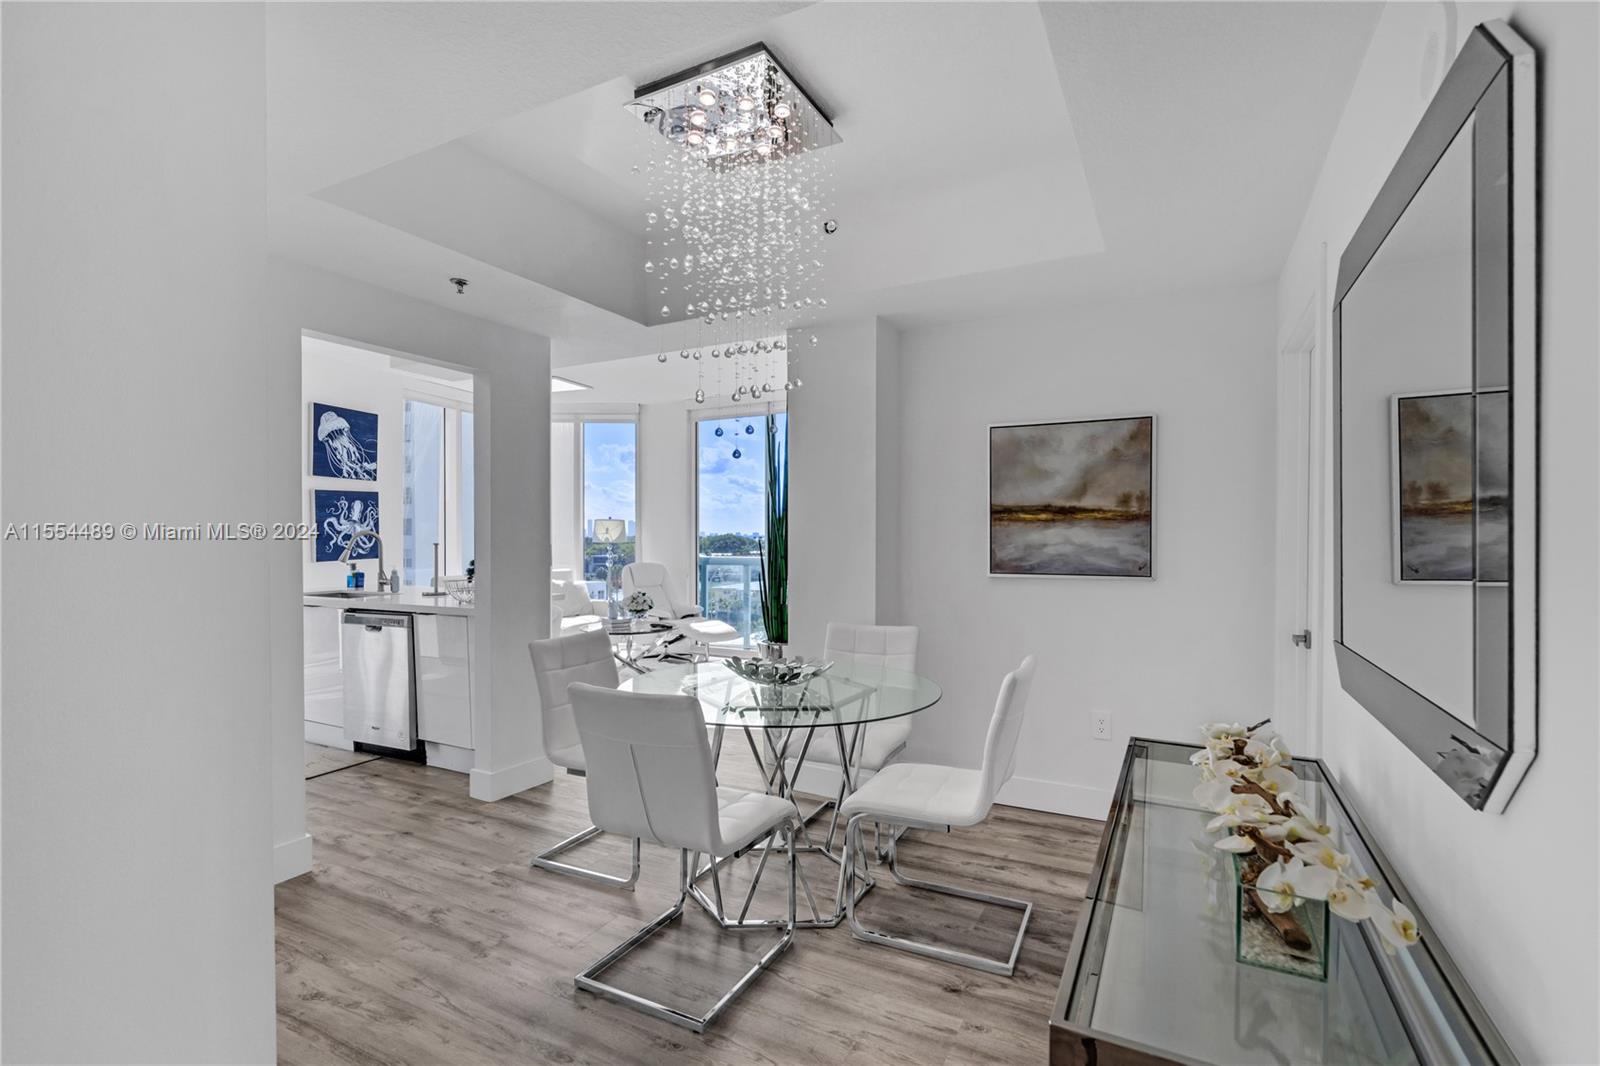
Active
$999,000
2
bds
|
2
ba
|
1,097
sqft
|
built
2004
6515 Collins Ave, Miami Beach, FL 33141
$-4,038
Cash flow
-21.1%
Cash-on-Cash Return
1.3%
Cap rate
0.6%
Rent to Value Ratio
Active
$569,000
2
bds
|
2
ba
|
1,072
sqft
|
built
2010
6305 Indian Creek Dr, Miami Beach, FL 33141
$-2,486
Cash flow
-22.8%
Cash-on-Cash Return
0.9%
Cap rate
0.6%
Rent to Value Ratio
Pending
$450,000
2
bds
|
2
ba
|
980
sqft
|
built
1967
5401 Collins Ave, Miami Beach, FL 33140
$-1,786
Cash flow
-20.7%
Cash-on-Cash Return
1.4%
Cap rate
0.8%
Rent to Value Ratio
Active
$425,000
2
bds
|
2
ba
|
595
sqft
|
built
2015
1450 Meridian Ave, Miami Beach, FL 33139
$-1,283
Cash flow
-15.8%
Cash-on-Cash Return
2.5%
Cap rate
0.7%
Rent to Value Ratio

Active
$850,000
2
bds
|
2
ba
|
1,037
sqft
|
built
1982
2555 Collins Ave, Miami Beach, FL 33140
$-2,557
Cash flow
-15.7%
Cash-on-Cash Return
2.5%
Cap rate
0.7%
Rent to Value Ratio
Active
$305,000
1
bds
|
1
ba
|
852
sqft
|
built
1968
1000 West Ave, Miami Beach, FL 33139
$-1,187
Cash flow
-20.3%
Cash-on-Cash Return
1.5%
Cap rate
0.9%
Rent to Value Ratio

Active
$11,950,000
4
bds
|
5
ba
|
4,086
sqft
|
built
2002
7431 Fisher Island Dr, Miami Beach, FL 33109
$-68,378
Cash flow
-29.9%
Cash-on-Cash Return
-0.7%
Cap rate
0.1%
Rent to Value Ratio
Active
$250,000
1
bds
|
2
ba
|
672
sqft
|
built
1970
1990 Marseille Dr, Miami Beach, FL 33141
$-864
Cash flow
-18.0%
Cash-on-Cash Return
2.0%
Cap rate
0.8%
Rent to Value Ratio
Active
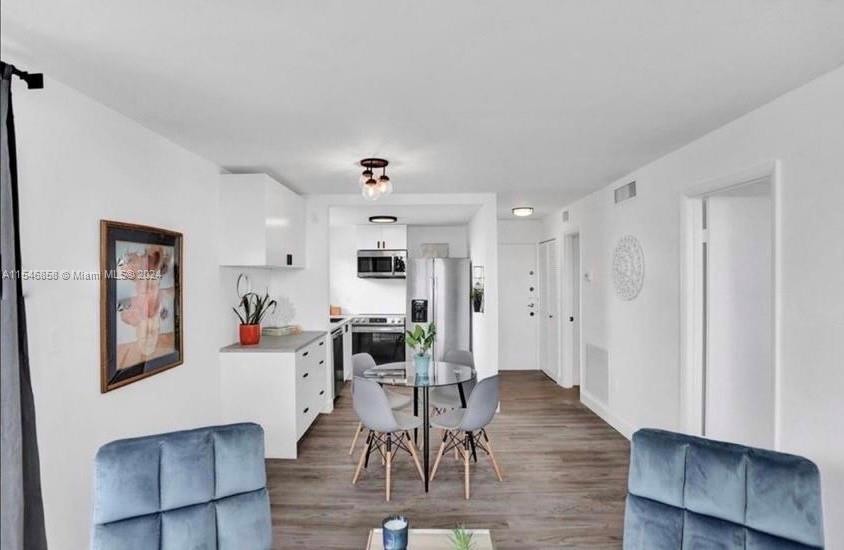
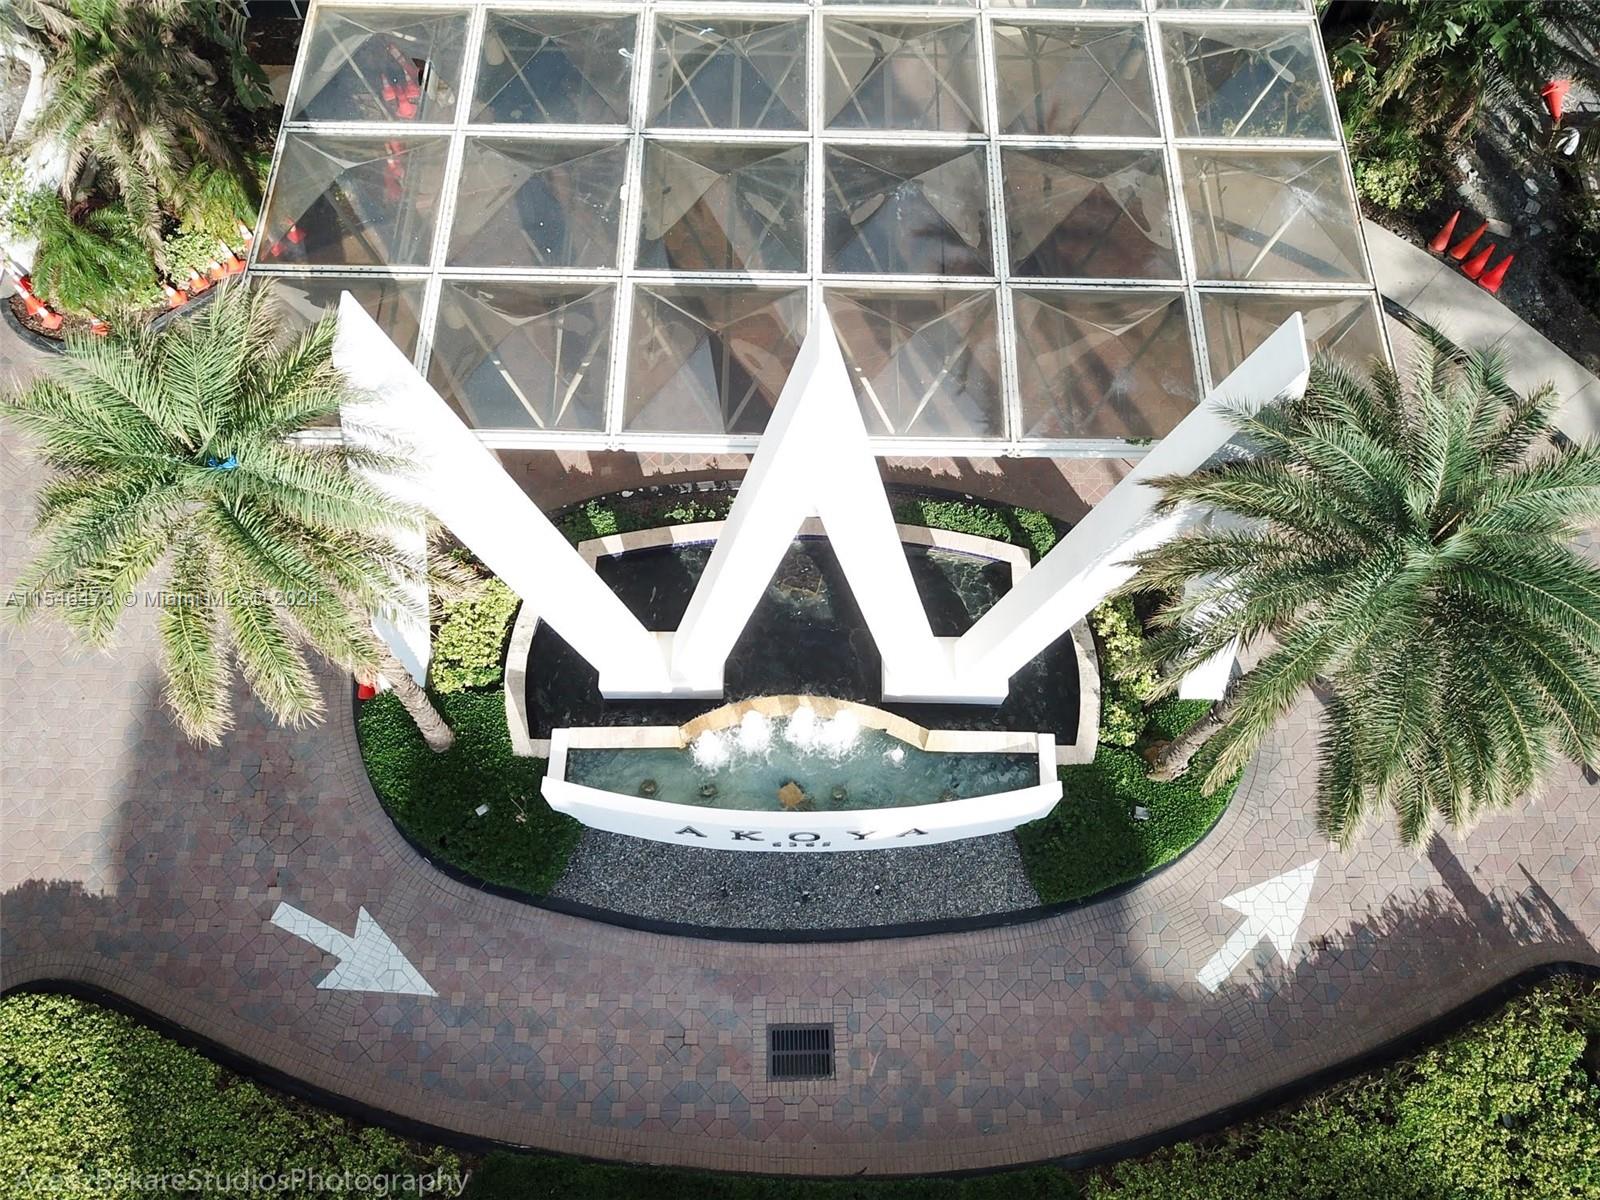
$1,550,000
2
bds
|
2
ba
|
1,322
sqft
|
built
2004
6365 Collins Ave, Miami Beach, FL 33141
$-6,837
Cash flow
-23.0%
Cash-on-Cash Return
0.9%
Cap rate
0.4%
Rent to Value Ratio
Active
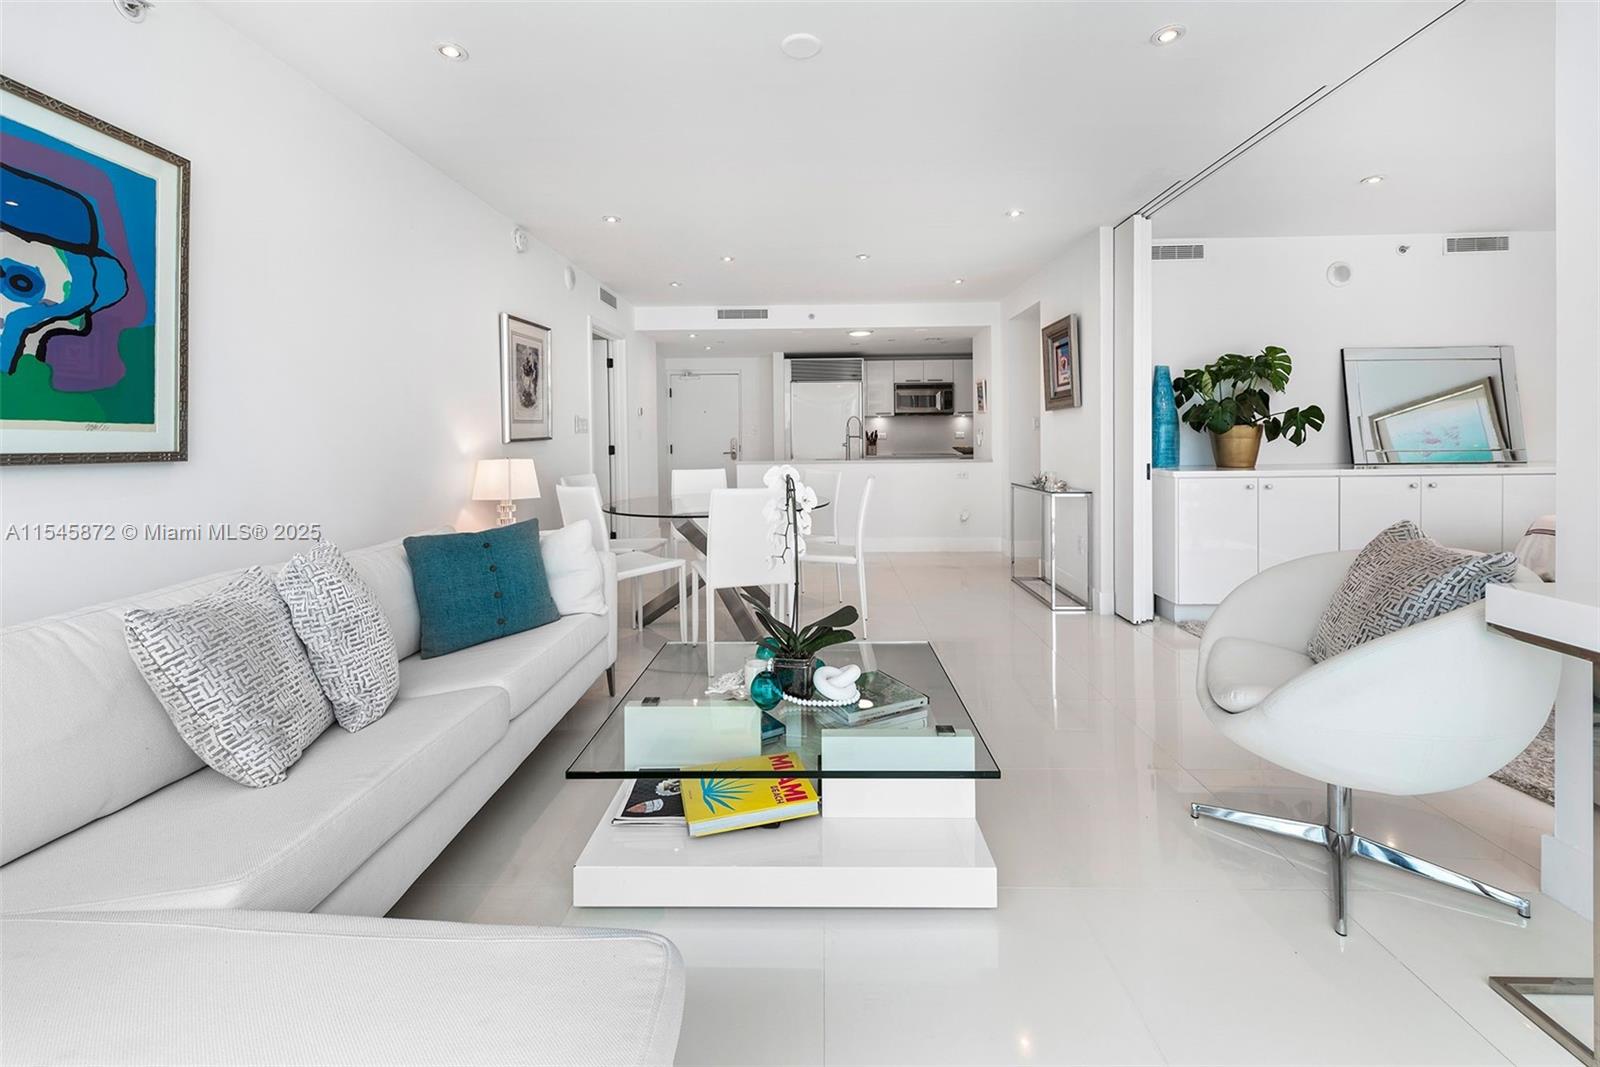
$1,699,000
2
bds
|
2
ba
|
1,103
sqft
|
built
2008
6801 Collins Ave, Miami Beach, FL 33141
$-3,442
Cash flow
-10.6%
Cash-on-Cash Return
3.7%
Cap rate
0.6%
Rent to Value Ratio
Active
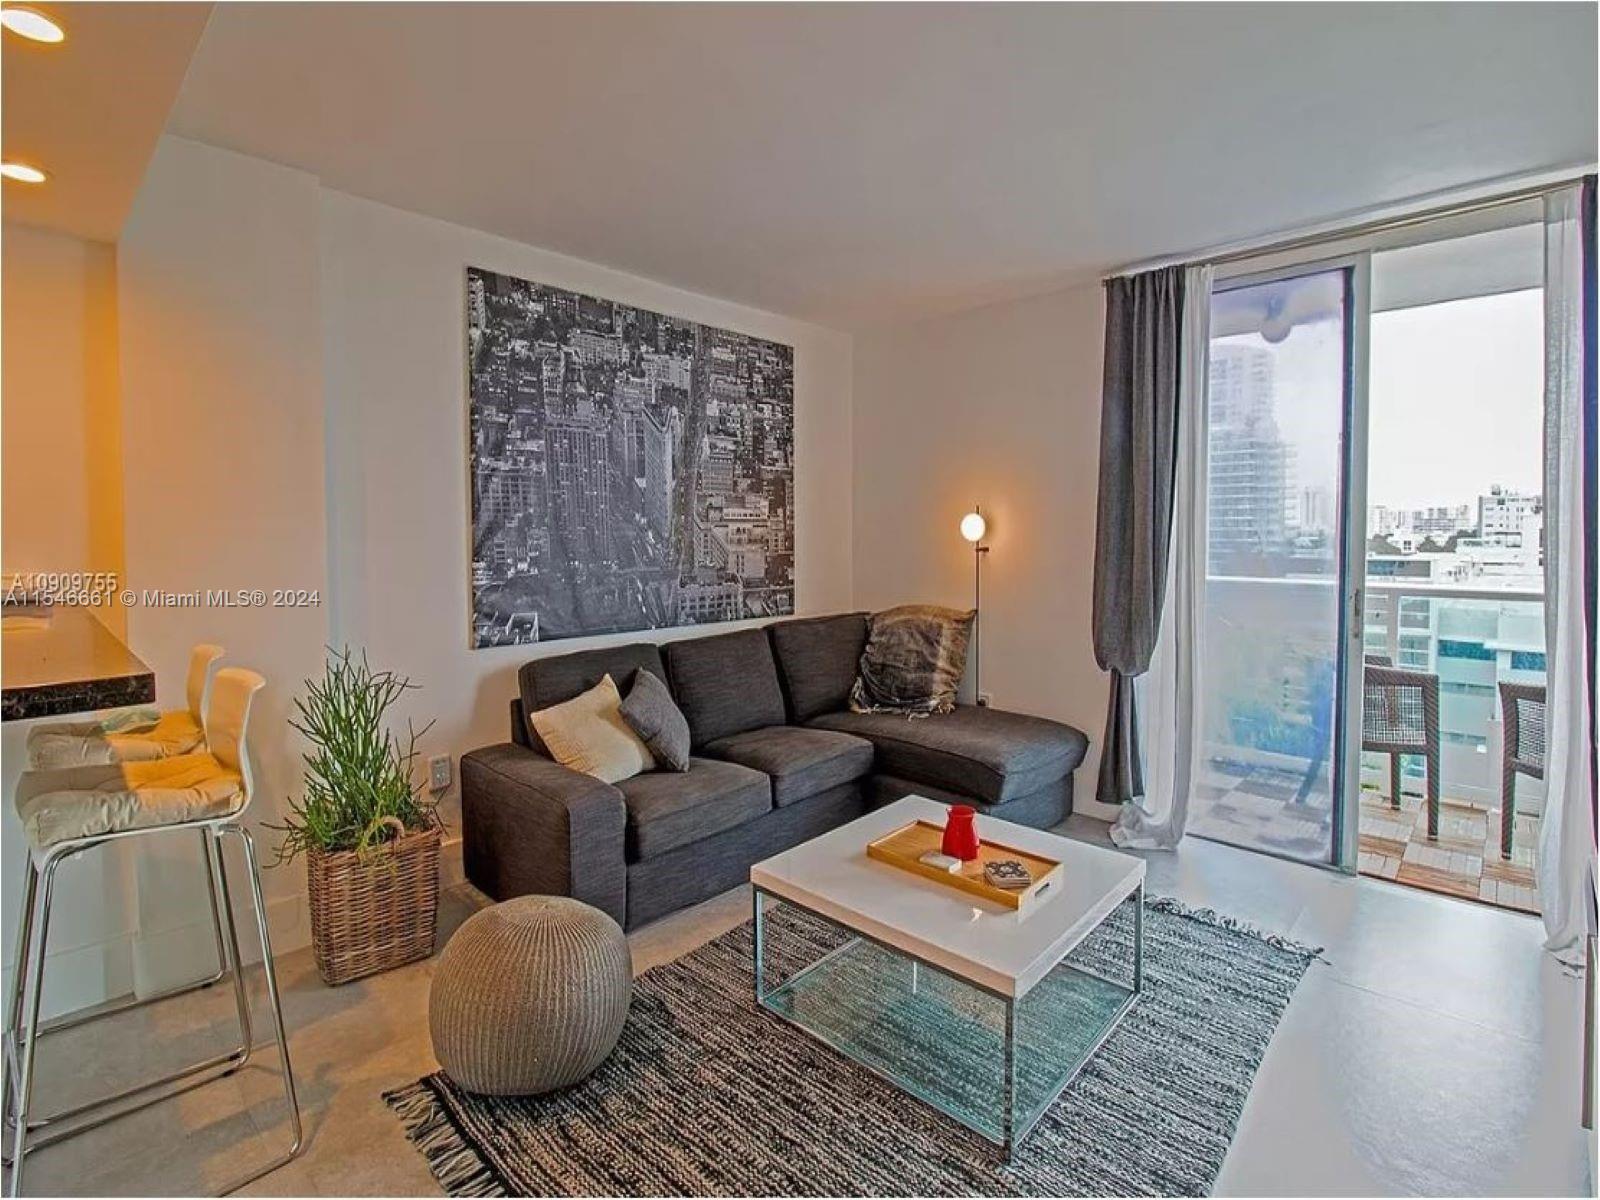
$395,000
1
bds
|
1
ba
|
576
sqft
|
built
1979
1035 West Ave, Miami Beach, FL 33139
$-1,103
Cash flow
-14.6%
Cash-on-Cash Return
2.8%
Cap rate
0.6%
Rent to Value Ratio
Active
$18,950,000
8
bds
|
8
ba
|
5,804
sqft
|
built
1991
401 E Rivo Alto Dr, Miami Beach, FL 33139
$-106,516
Cash flow
-29.3%
Cash-on-Cash Return
-0.6%
Cap rate
0.0%
Rent to Value Ratio
Active
$320,000
1
bds
|
1
ba
|
480
sqft
|
built
1938
550 15th St, Miami Beach, FL 33139
$-800
Cash flow
-13.0%
Cash-on-Cash Return
3.1%
Cap rate
0.7%
Rent to Value Ratio
Active
$273,000
2
bds
|
2
ba
|
1,031
sqft
|
built
1964
7441 Wayne Ave, Miami Beach, FL 33141
$-764
Cash flow
-14.6%
Cash-on-Cash Return
2.8%
Cap rate
1.0%
Rent to Value Ratio
Active
$545,000
1
bds
|
1
ba
|
659
sqft
|
built
1970
345 Ocean Dr, Miami Beach, FL 33139
$-1,693
Cash flow
-16.2%
Cash-on-Cash Return
2.4%
Cap rate
0.6%
Rent to Value Ratio
Active
$619,000
3
bds
|
2
ba
|
1,560
sqft
|
built
1963
5255 Collins Ave, Miami Beach, FL 33140
$-3,103
Cash flow
-26.2%
Cash-on-Cash Return
0.1%
Cap rate
0.6%
Rent to Value Ratio
Active
$1,449,000
4
bds
|
3
ba
|
1,800
sqft
|
built
1962
5225 Collins Ave, Miami Beach, FL 33140
$-4,580
Cash flow
-16.5%
Cash-on-Cash Return
2.4%
Cap rate
0.7%
Rent to Value Ratio
Active
$1,945,000
2
bds
|
4
ba
|
1,864
sqft
|
built
2003
400 Alton Rd, Miami Beach, FL 33139
$-8,795
Cash flow
-23.6%
Cash-on-Cash Return
0.7%
Cap rate
0.4%
Rent to Value Ratio
Active
$1,700,000
2
bds
|
3
ba
|
2,057
sqft
|
built
2005
2001 Meridian Ave, Miami Beach, FL 33139
$-7,554
Cash flow
-23.2%
Cash-on-Cash Return
0.8%
Cap rate
0.5%
Rent to Value Ratio
Active
$450,000
1
bds
|
1
ba
|
861
sqft
|
built
1962
3 Island Ave, Miami Beach, FL 33139
$-29
Cash flow
-0.3%
Cash-on-Cash Return
6.1%
Cap rate
0.9%
Rent to Value Ratio
Active
$409,999
1
bds
|
1
ba
|
790
sqft
|
built
1934
1620 Pennsylvania Ave, Miami Beach, FL 33139
$-1,382
Cash flow
-17.6%
Cash-on-Cash Return
2.1%
Cap rate
0.6%
Rent to Value Ratio
Active
$875,000
2
bds
|
2
ba
|
1,660
sqft
|
built
1967
5600 Collins Ave, Miami Beach, FL 33140
$-2,588
Cash flow
-15.4%
Cash-on-Cash Return
2.6%
Cap rate
0.7%
Rent to Value Ratio
Active
$245,000
1
bds
|
1
ba
|
440
sqft
|
built
1935
605 Euclid Ave, Miami Beach, FL 33139
$-538
Cash flow
-11.5%
Cash-on-Cash Return
3.5%
Cap rate
0.8%
Rent to Value Ratio
Active
$889,000
3
bds
|
3
ba
|
1,230
sqft
|
built
2013
6700 Indian Creek Dr, Miami Beach, FL 33141
$-4,807
Cash flow
-28.2%
Cash-on-Cash Return
-0.3%
Cap rate
0.6%
Rent to Value Ratio
Active
$10,900,000
4
bds
|
4
ba
|
3,398
sqft
|
built
1932
527 E Dilido Dr, Miami Beach, FL 33139
$-62,486
Cash flow
-29.9%
Cash-on-Cash Return
-0.7%
Cap rate
0.1%
Rent to Value Ratio
Active
$1,749,000
1
bds
|
2
ba
|
958
sqft
|
built
2008
4391 Collins Ave, Miami Beach, FL 33140
$-7,989
Cash flow
-23.8%
Cash-on-Cash Return
0.7%
Cap rate
0.4%
Rent to Value Ratio
Active
$1,300,000
1
bds
|
1
ba
|
1,011
sqft
|
built
2010
6000 Collins Ave, Miami Beach, FL 33140
$-4,148
Cash flow
-16.6%
Cash-on-Cash Return
2.3%
Cap rate
0.5%
Rent to Value Ratio
Active
$4,495,000
4
bds
|
6
ba
|
4,599
sqft
|
built
2002
5801 Collins Ave, Miami Beach, FL 33140
$-31,056
Cash flow
-36.0%
Cash-on-Cash Return
-2.1%
Cap rate
0.2%
Rent to Value Ratio
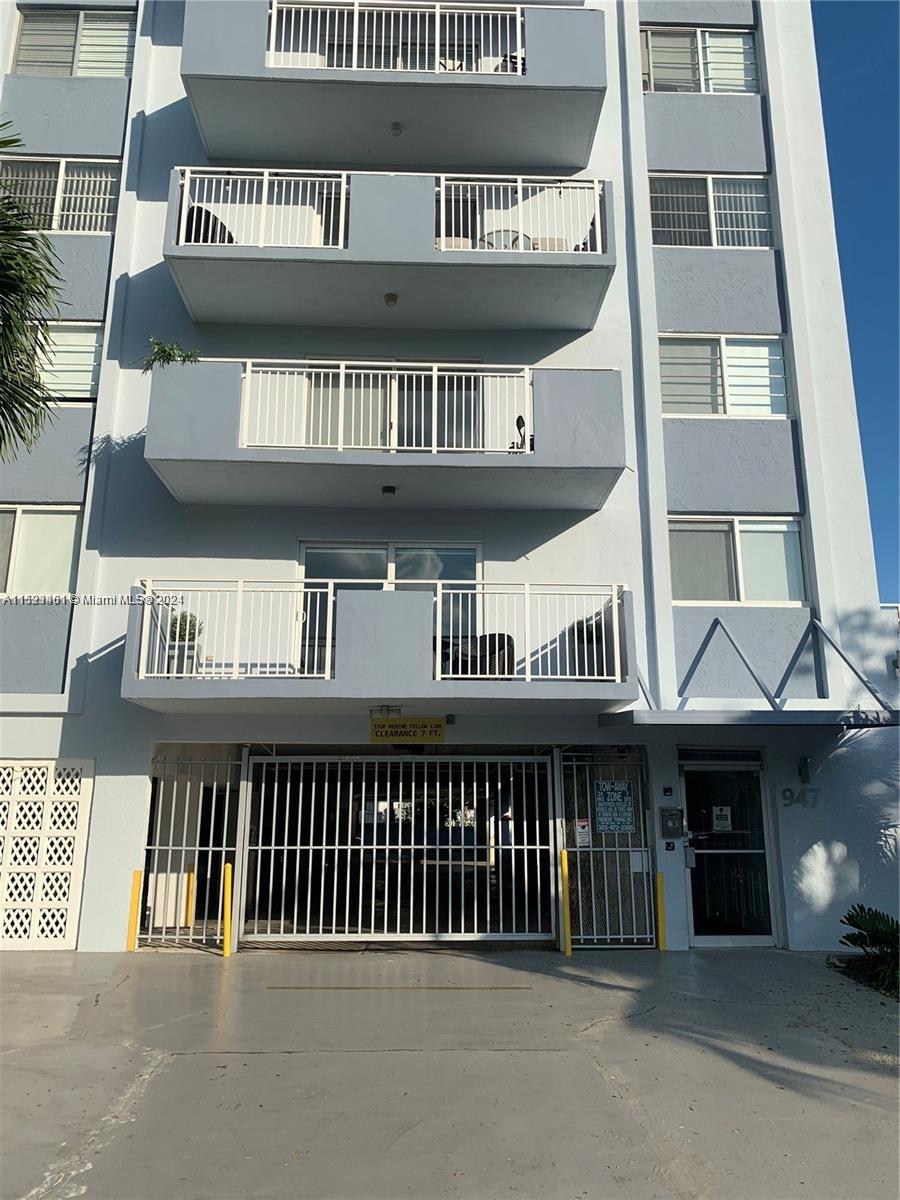
Active
$330,000
1
bds
|
1
ba
|
748
sqft
|
built
1970
947 Lenox Ave, Miami Beach, FL 33139
$-978
Cash flow
-15.5%
Cash-on-Cash Return
2.6%
Cap rate
0.7%
Rent to Value Ratio
Active
$2,115,000
3
bds
|
2
ba
|
1,533
sqft
|
built
1947
563 W 49th St, Miami Beach, FL 33140
$-8,315
Cash flow
-20.5%
Cash-on-Cash Return
1.4%
Cap rate
0.2%
Rent to Value Ratio
Active
$320,000
1
bds
|
1
ba
|
530
sqft
|
built
1965
100 Lincoln Rd, Miami Beach, FL 33139
$-964
Cash flow
-15.7%
Cash-on-Cash Return
2.5%
Cap rate
0.8%
Rent to Value Ratio
Active
$339,000
1
bds
|
2
ba
|
1,010
sqft
|
built
1970
7135 Collins Ave, Miami Beach, FL 33141
$-1,384
Cash flow
-21.3%
Cash-on-Cash Return
1.2%
Cap rate
0.7%
Rent to Value Ratio
Active
$3,000,000
4
bds
|
4
ba
|
2,815
sqft
|
built
1928
888 W 47th St, Miami Beach, FL 33140
$-9,040
Cash flow
-15.7%
Cash-on-Cash Return
2.5%
Cap rate
0.4%
Rent to Value Ratio
Active
$268,000
1
bds
|
1
ba
|
470
sqft
|
built
1925
842 Meridian Ave, Miami Beach, FL 33139
$-798
Cash flow
-15.5%
Cash-on-Cash Return
2.6%
Cap rate
0.7%
Rent to Value Ratio