Miami Beach, FL Investment Properties for Sale
Browse homes for sale and investment properties in Miami Beach, FL. Refine your search by price, property type, or more.
Best cash flowing properties in Miami Beach, FL
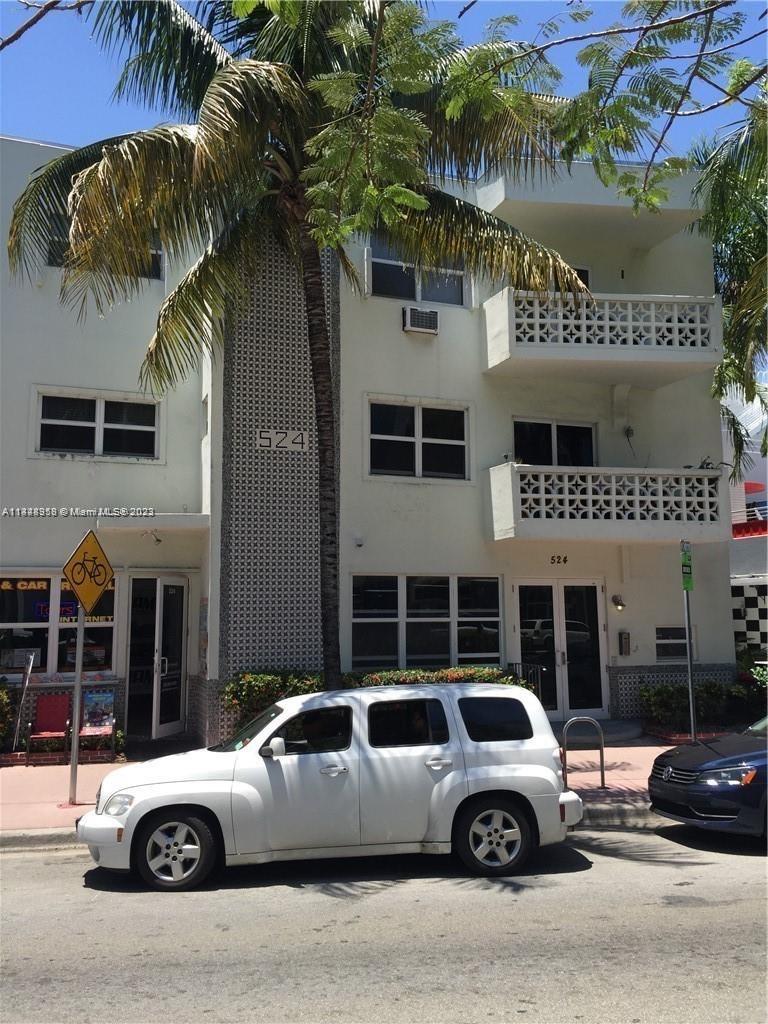
Active
$245,000
1
bds
|
1
ba
|
418
sqft
|
built
1967
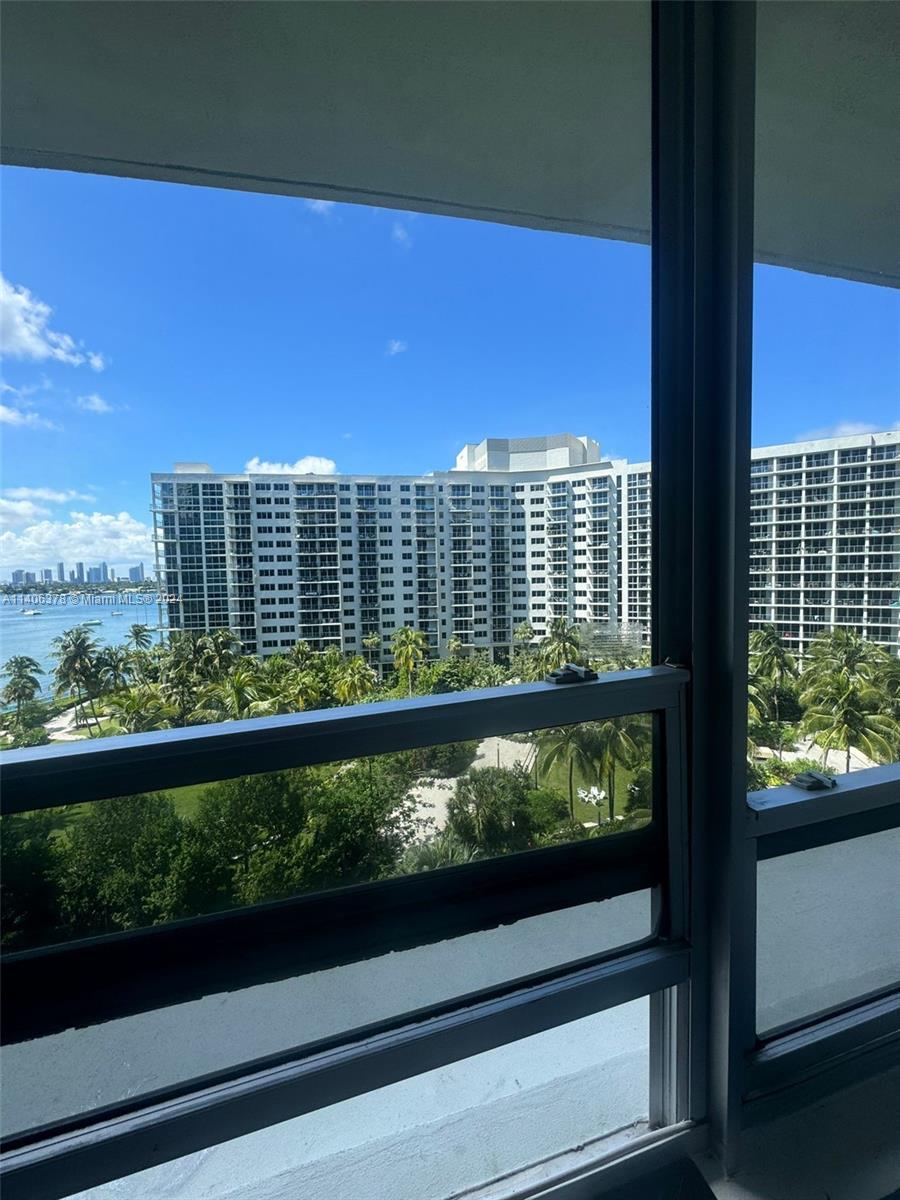
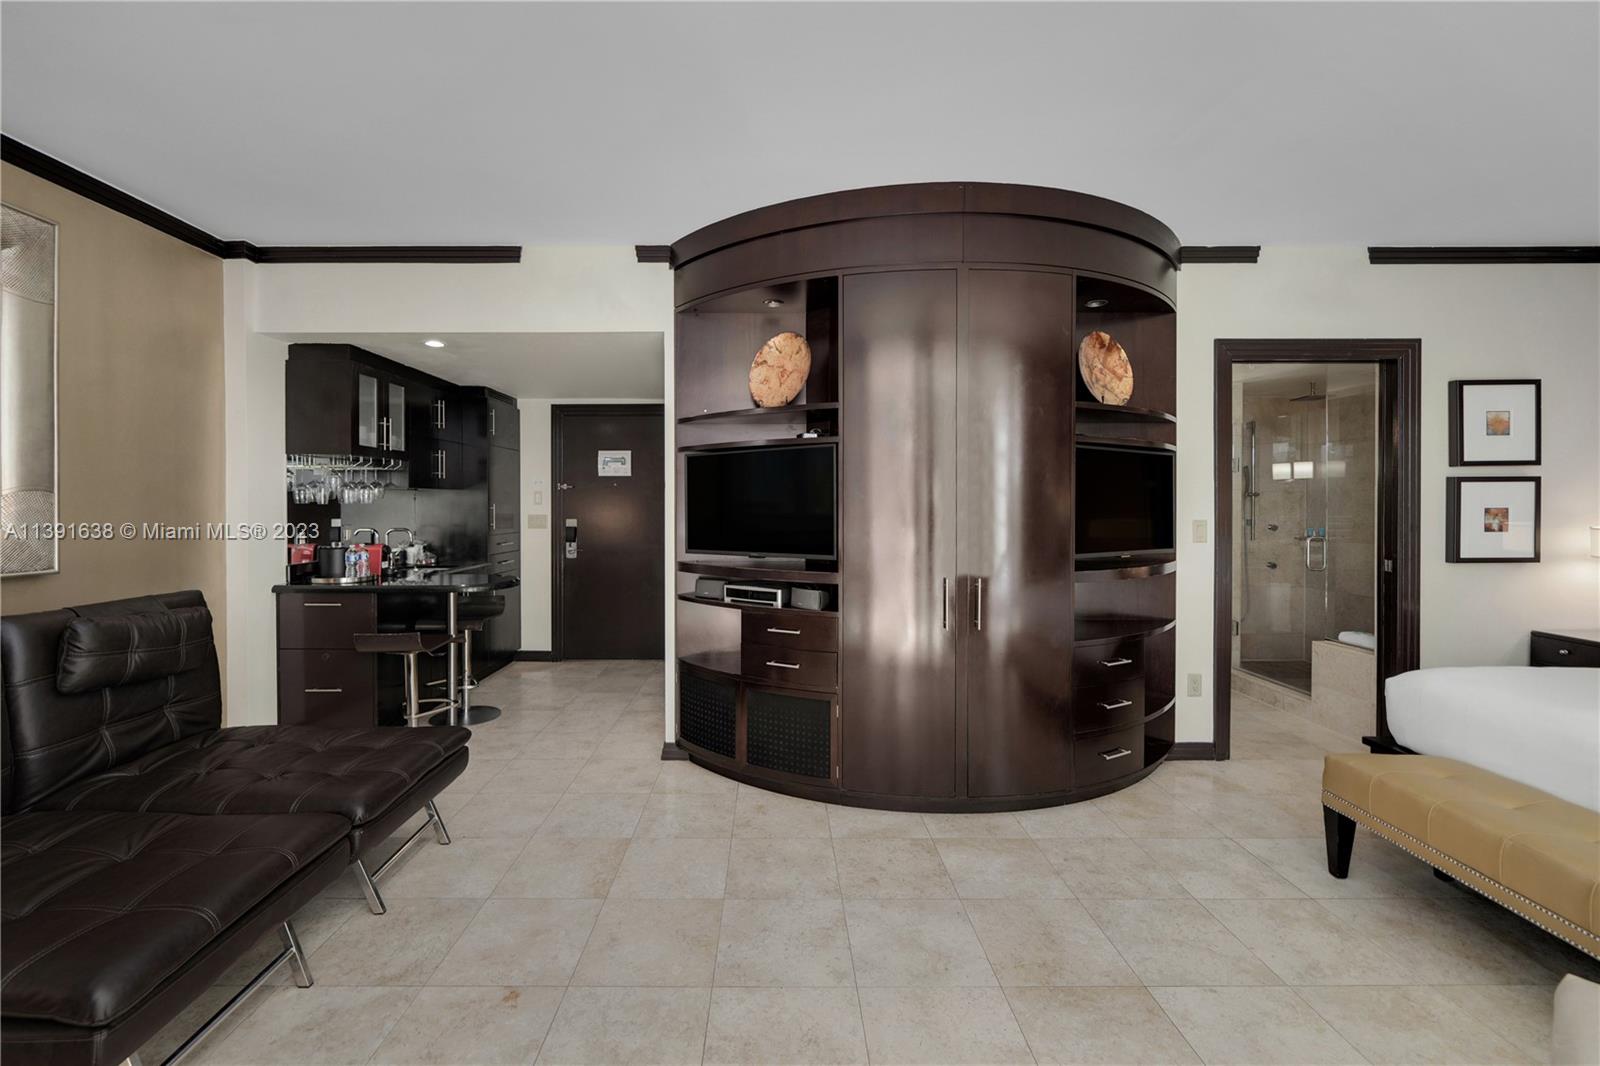
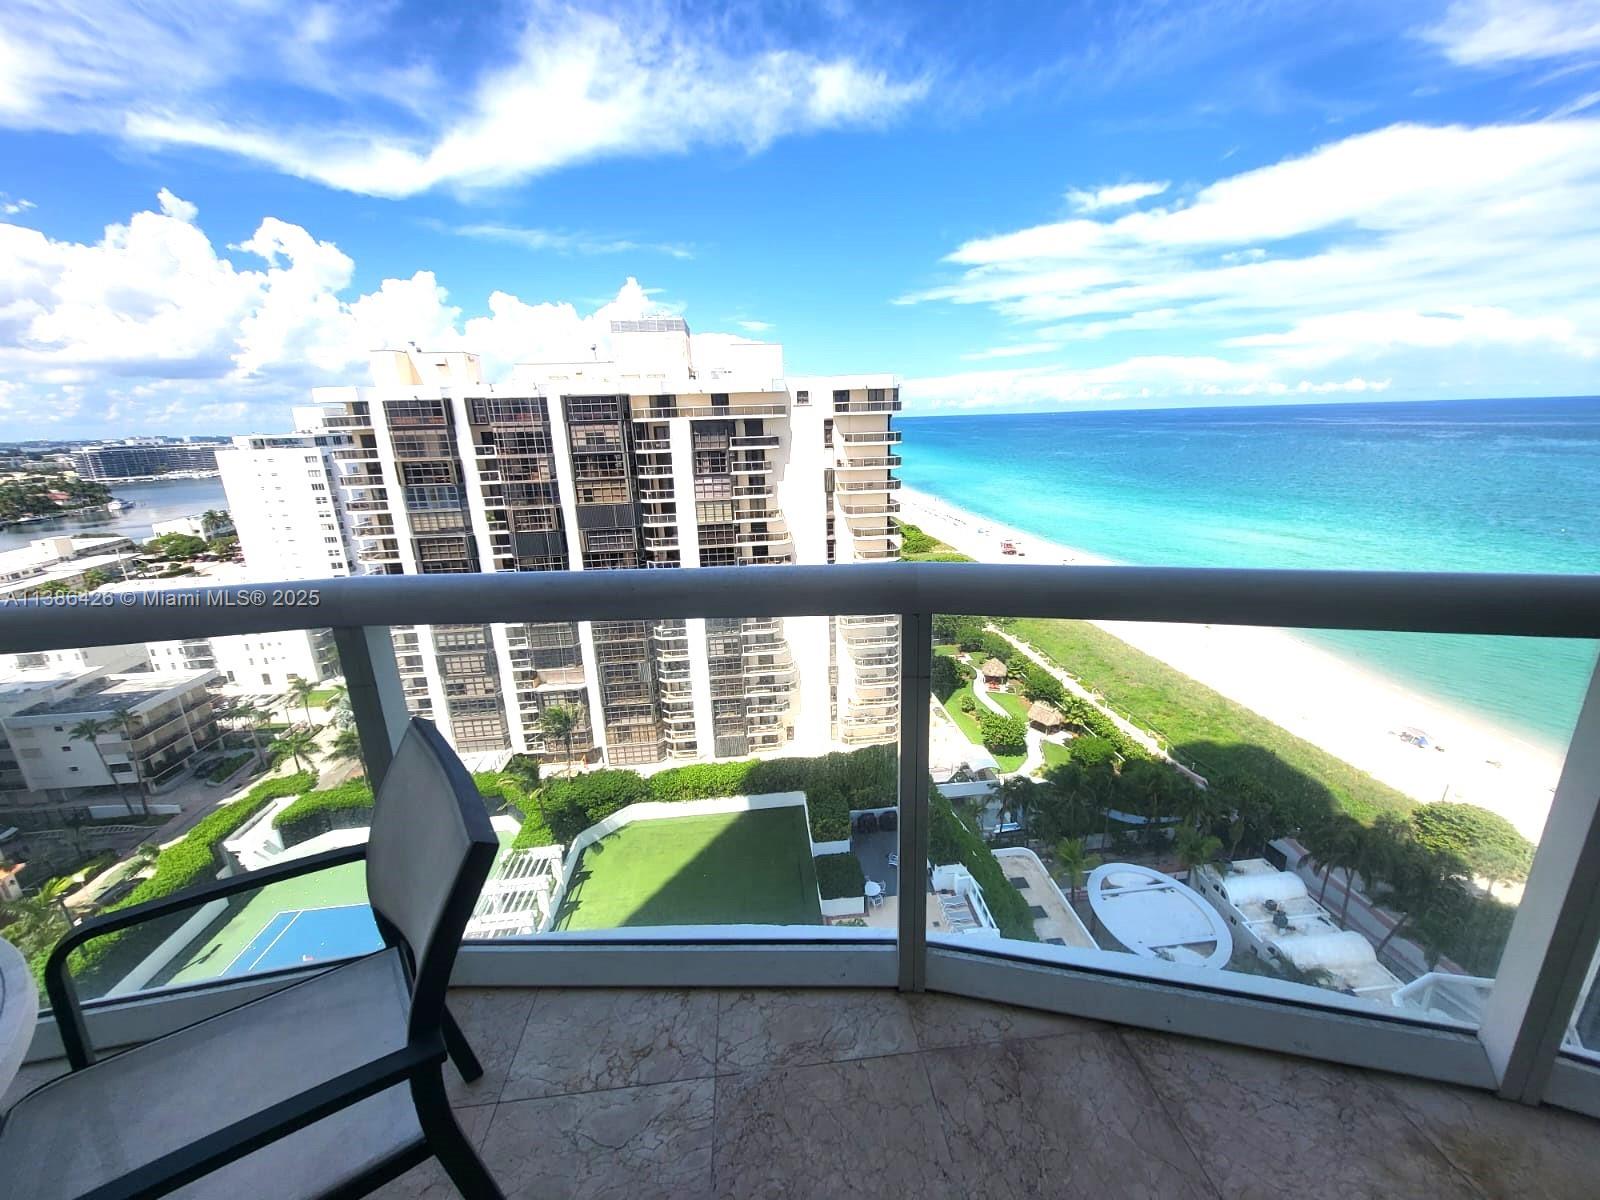
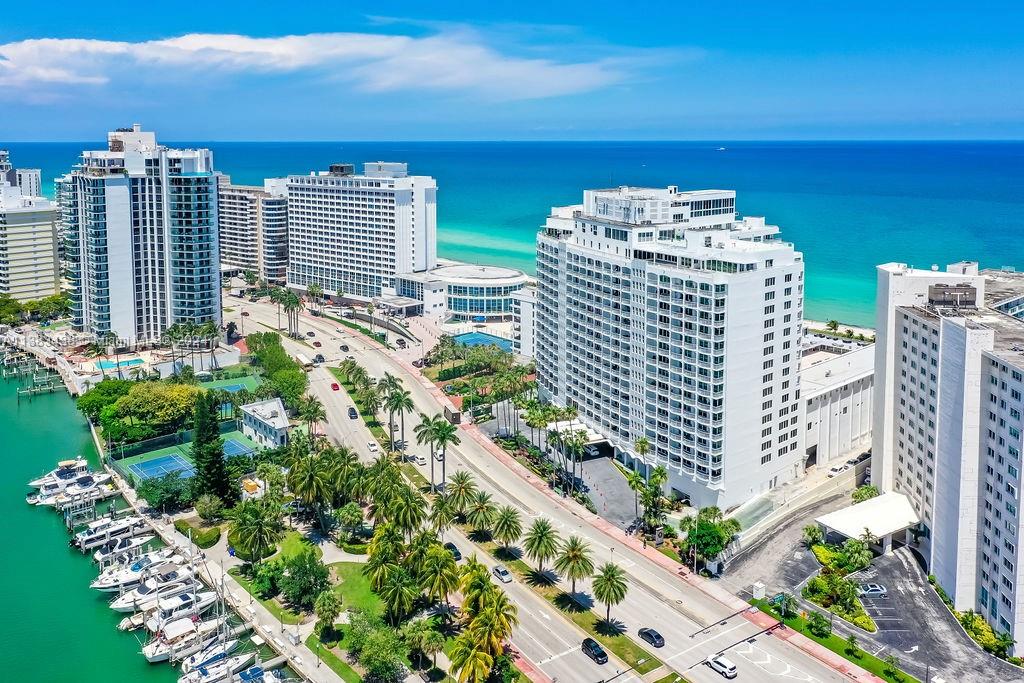
524 Washington Ave, Miami Beach, FL 33139
$-236
Cash flow
-5.0%
Cash-on-Cash Return
5.0%
Cap rate
0.9%
Rent to Value Ratio
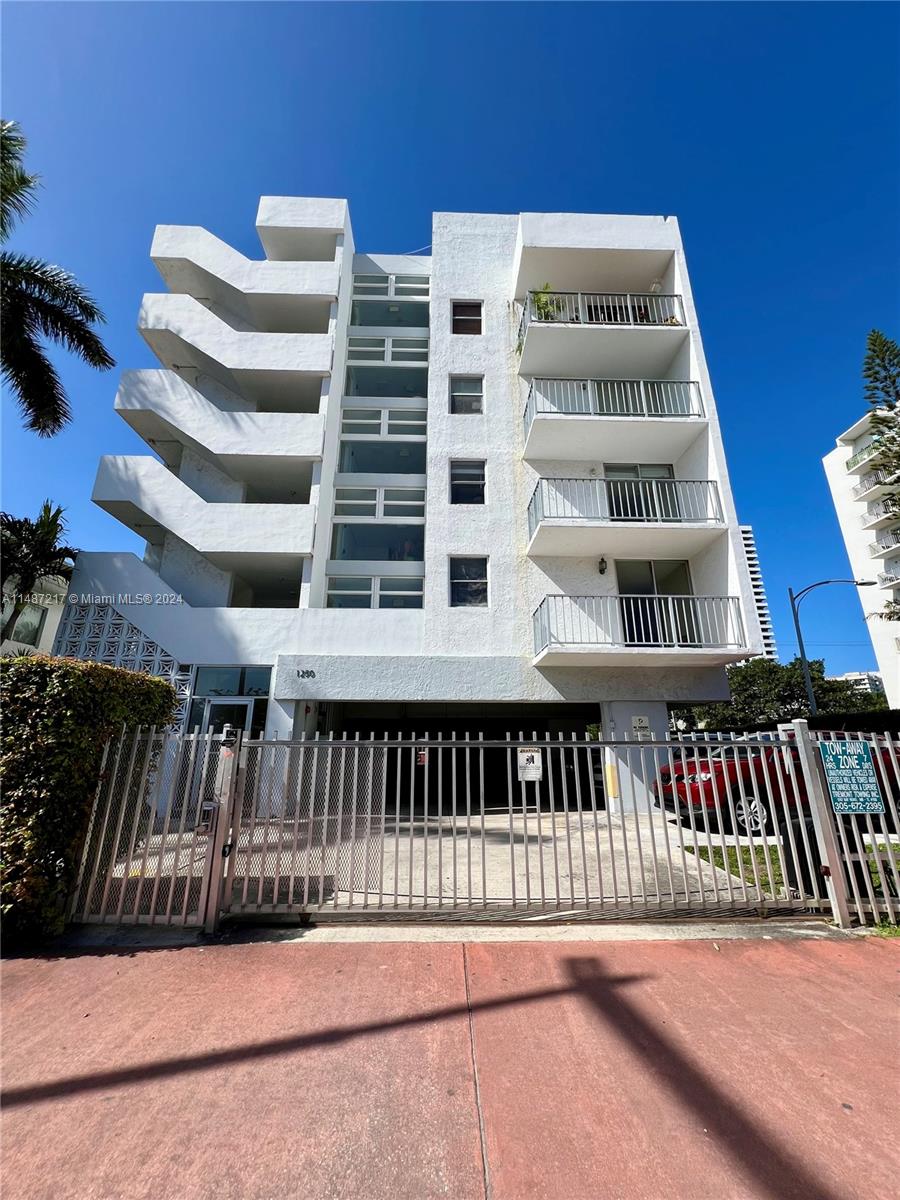
Active
$203,500
bds
|
1
ba
|
507
sqft
|
built
1974
1250 Alton Rd, Miami Beach, FL 33139
$-625
Cash flow
-16.0%
Cash-on-Cash Return
2.5%
Cap rate
0.8%
Rent to Value Ratio
1,984 out of 2,186 properties for sale in Miami Beach, FL
Limited Results Shown
Create a free account, or log in to reveal all property listings and enjoy the complete experience.
Active
$2,550,000
3
bds
|
4
ba
|
2,395
sqft
|
built
2004
6101 Aqua Ave, Miami Beach, FL 33141
$-14,214
Cash flow
-29.1%
Cash-on-Cash Return
-0.5%
Cap rate
0.4%
Rent to Value Ratio

Active
$480,000
bds
|
1
ba
|
493
sqft
|
built
2008
1100 West Ave, Miami Beach, FL 33139
$-1,752
Cash flow
-19.0%
Cash-on-Cash Return
1.8%
Cap rate
0.9%
Rent to Value Ratio
Active
$375,000
1
bds
|
1
ba
|
430
sqft
|
built
1948
6345 Collins Ave, Miami Beach, FL 33141
$-1,542
Cash flow
-21.5%
Cash-on-Cash Return
1.2%
Cap rate
0.5%
Rent to Value Ratio

Active
$399,000
1
bds
|
1
ba
|
676
sqft
|
built
2008
1100 West Ave, Miami Beach, FL 33139
$-1,702
Cash flow
-22.3%
Cash-on-Cash Return
1.0%
Cap rate
0.8%
Rent to Value Ratio
Active
$545,000
2
bds
|
2
ba
|
1,040
sqft
|
built
1966
5161 Collins Ave, Miami Beach, FL 33140
$-2,169
Cash flow
-20.8%
Cash-on-Cash Return
1.4%
Cap rate
0.7%
Rent to Value Ratio
Active
$685,000
1
bds
|
1
ba
|
700
sqft
|
built
1965
100 Lincoln Rd, Miami Beach, FL 33139
$-2,624
Cash flow
-20.0%
Cash-on-Cash Return
1.6%
Cap rate
0.5%
Rent to Value Ratio
Active
$299,000
1
bds
|
2
ba
|
676
sqft
|
built
1971
6969 Collins Ave, Miami Beach, FL 33141
$-982
Cash flow
-17.1%
Cash-on-Cash Return
2.2%
Cap rate
0.7%
Rent to Value Ratio
Active
$500,000
1
bds
|
1
ba
|
696
sqft
|
built
2008
1100 West Ave, Miami Beach, FL 33139
$-2,112
Cash flow
-22.0%
Cash-on-Cash Return
1.1%
Cap rate
0.9%
Rent to Value Ratio
Active
$2,390,000
2
bds
|
2
ba
|
1,230
sqft
|
built
1926
2301 Collins Ave, Miami Beach, FL 33139
$-10,588
Cash flow
-23.1%
Cash-on-Cash Return
0.8%
Cap rate
0.4%
Rent to Value Ratio
Active
$779,000
1
bds
|
1
ba
|
746
sqft
|
built
1997
650 West Ave, Miami Beach, FL 33139
$-2,712
Cash flow
-18.2%
Cash-on-Cash Return
2.0%
Cap rate
0.6%
Rent to Value Ratio
Active
$8,450,000
3
bds
|
4
ba
|
3,103
sqft
|
built
2008
800 S Pointe Dr, Miami Beach, FL 33139
$-53,234
Cash flow
-32.9%
Cash-on-Cash Return
-1.4%
Cap rate
0.1%
Rent to Value Ratio

Active
$850,000
2
bds
|
2
ba
|
1,139
sqft
|
built
1983
2457 Collins Ave, Miami Beach, FL 33140
$-1,097
Cash flow
-6.7%
Cash-on-Cash Return
4.6%
Cap rate
0.8%
Rent to Value Ratio
Active
$1,990,000
2
bds
|
2
ba
|
1,429
sqft
|
built
1989
19111 Fisher Island Dr, Miami Beach, FL 33109
$-8,414
Cash flow
-22.1%
Cash-on-Cash Return
1.1%
Cap rate
0.5%
Rent to Value Ratio
Active
$499,999
1
bds
|
2
ba
|
930
sqft
|
built
1966
5161 Collins Ave, Miami Beach, FL 33140
$-1,788
Cash flow
-18.7%
Cash-on-Cash Return
1.9%
Cap rate
0.6%
Rent to Value Ratio
Active
$300,000
bds
|
1
ba
|
400
sqft
|
built
1948
6345 Collins Ave, Miami Beach, FL 33141
$-975
Cash flow
-17.0%
Cash-on-Cash Return
2.2%
Cap rate
0.7%
Rent to Value Ratio
Active
$450,000
1
bds
|
1
ba
|
696
sqft
|
built
2008
1100 West Ave, Miami Beach, FL 33139
$-2,314
Cash flow
-26.8%
Cash-on-Cash Return
0.0%
Cap rate
0.9%
Rent to Value Ratio
Active
$565,000
1
bds
|
2
ba
|
980
sqft
|
built
1967
5401 Collins Ave, Miami Beach, FL 33140
$-1,375
Cash flow
-12.7%
Cash-on-Cash Return
3.2%
Cap rate
0.5%
Rent to Value Ratio
Active
$7,995,000
3
bds
|
5
ba
|
3,940
sqft
|
built
1998
1455 Ocean Dr, Miami Beach, FL 33139
$-52,623
Cash flow
-34.3%
Cash-on-Cash Return
-1.8%
Cap rate
0.1%
Rent to Value Ratio
Active
$203,500
bds
|
1
ba
|
507
sqft
|
built
1974
1250 Alton Rd, Miami Beach, FL 33139
$-625
Cash flow
-16.0%
Cash-on-Cash Return
2.5%
Cap rate
0.8%
Rent to Value Ratio
Active
$324,900
1
bds
|
1
ba
|
454
sqft
|
built
2016
1215 West Ave, Miami Beach, FL 33139
$-725
Cash flow
-11.6%
Cash-on-Cash Return
3.5%
Cap rate
0.9%
Rent to Value Ratio
Active
$1,999,995
1
bds
|
2
ba
|
771
sqft
|
built
2008
4391 Collins Ave, Miami Beach, FL 33140
$-8,090
Cash flow
-21.1%
Cash-on-Cash Return
1.3%
Cap rate
0.4%
Rent to Value Ratio
Active
$4,895,000
5
bds
|
6
ba
|
4,135
sqft
|
built
2005
5959 Collins Ave, Miami Beach, FL 33140
$-28,881
Cash flow
-30.8%
Cash-on-Cash Return
-0.9%
Cap rate
0.2%
Rent to Value Ratio
Active
$465,000
1
bds
|
1
ba
|
656
sqft
|
built
1969
465 Ocean Dr, Miami Beach, FL 33139
$-1,259
Cash flow
-14.1%
Cash-on-Cash Return
2.9%
Cap rate
0.7%
Rent to Value Ratio
Active
$784,000
3
bds
|
2
ba
|
1,280
sqft
|
built
1968
5601 Collins Ave, Miami Beach, FL 33140
$-2,955
Cash flow
-19.7%
Cash-on-Cash Return
1.6%
Cap rate
0.6%
Rent to Value Ratio
Active
$8,750,000
4
bds
|
4
ba
|
3,008
sqft
|
built
1932
433 E Dilido Dr, Miami Beach, FL 33139
$-41,247
Cash flow
-24.6%
Cash-on-Cash Return
0.5%
Cap rate
0.1%
Rent to Value Ratio
Active
$1,125,000
2
bds
|
3
ba
|
1,210
sqft
|
built
1998
1 Century Ln, Miami Beach, FL 33139
$-3,980
Cash flow
-18.5%
Cash-on-Cash Return
1.9%
Cap rate
0.6%
Rent to Value Ratio
Active
$460,000
1
bds
|
1
ba
|
852
sqft
|
built
1968
1000 West Ave, Miami Beach, FL 33139
$-1,272
Cash flow
-14.4%
Cash-on-Cash Return
2.8%
Cap rate
0.7%
Rent to Value Ratio

Active
$4,259,000
3
bds
|
3
ba
|
2,049
sqft
|
built
1989
19216 Fisher Island Dr, Miami Beach, FL 33109
$-21,187
Cash flow
-26.0%
Cash-on-Cash Return
0.2%
Cap rate
0.2%
Rent to Value Ratio
Active
$245,000
1
bds
|
1
ba
|
418
sqft
|
built
1967
524 Washington Ave, Miami Beach, FL 33139
$-236
Cash flow
-5.0%
Cash-on-Cash Return
5.0%
Cap rate
0.9%
Rent to Value Ratio

Active
$485,000
1
bds
|
2
ba
|
1,560
sqft
|
built
1963
5255 Collins Ave, Miami Beach, FL 33140
$-2,990
Cash flow
-32.2%
Cash-on-Cash Return
-1.3%
Cap rate
0.7%
Rent to Value Ratio
Active
$469,000
1
bds
|
1
ba
|
474
sqft
|
built
2005
1052 Ocean Dr, Miami Beach, FL 33139
$-1,385
Cash flow
-15.4%
Cash-on-Cash Return
2.6%
Cap rate
0.9%
Rent to Value Ratio

Active
$390,000
1
bds
|
1
ba
|
743
sqft
|
built
1945
1000 Meridian Ave, Miami Beach, FL 33139
$-1,103
Cash flow
-14.8%
Cash-on-Cash Return
2.8%
Cap rate
0.6%
Rent to Value Ratio

Active
$1,220,000
2
bds
|
2
ba
|
1,220
sqft
|
built
1996
6301 Collins Ave, Miami Beach, FL 33141
$-4,345
Cash flow
-18.6%
Cash-on-Cash Return
1.9%
Cap rate
0.5%
Rent to Value Ratio
Active
$1,250,000
2
bds
|
2
ba
|
1,360
sqft
|
built
1966
5151 Collins Ave, Miami Beach, FL 33140
$-4,274
Cash flow
-17.8%
Cash-on-Cash Return
2.0%
Cap rate
0.4%
Rent to Value Ratio
Active
$389,000
bds
|
1
ba
|
550
sqft
|
built
1965
100 Lincoln Rd, Miami Beach, FL 33139
$-1,245
Cash flow
-16.7%
Cash-on-Cash Return
2.3%
Cap rate
0.6%
Rent to Value Ratio
Active
$385,000
1
bds
|
1
ba
|
584
sqft
|
built
1960
1500 Bay Rd, Miami Beach, FL 33139
$-1,578
Cash flow
-21.4%
Cash-on-Cash Return
1.2%
Cap rate
0.6%
Rent to Value Ratio
Active
$315,000
bds
|
2
ba
|
500
sqft
|
built
2006
1437 Collins Ave, Miami Beach, FL 33139
$-2,218
Cash flow
-36.7%
Cash-on-Cash Return
-2.3%
Cap rate
0.8%
Rent to Value Ratio

Active
$1,149,000
2
bds
|
2
ba
|
1,322
sqft
|
built
2004
6365 Collins Ave, Miami Beach, FL 33141
$-4,962
Cash flow
-22.5%
Cash-on-Cash Return
1.0%
Cap rate
0.5%
Rent to Value Ratio
Active
$760,000
1
bds
|
2
ba
|
808
sqft
|
built
2004
6365 Collins Ave, Miami Beach, FL 33141
$-3,079
Cash flow
-21.1%
Cash-on-Cash Return
1.3%
Cap rate
0.5%
Rent to Value Ratio
Active
$990,000
3
bds
|
3
ba
|
1,430
sqft
|
built
1967
5401 Collins Ave, Miami Beach, FL 33140
$-4,040
Cash flow
-21.3%
Cash-on-Cash Return
1.2%
Cap rate
0.5%
Rent to Value Ratio