Miami Beach, FL Investment Properties for Sale
Browse homes for sale and investment properties in Miami Beach, FL. Refine your search by price, property type, or more.
Best cash flowing properties in Miami Beach, FL
Active
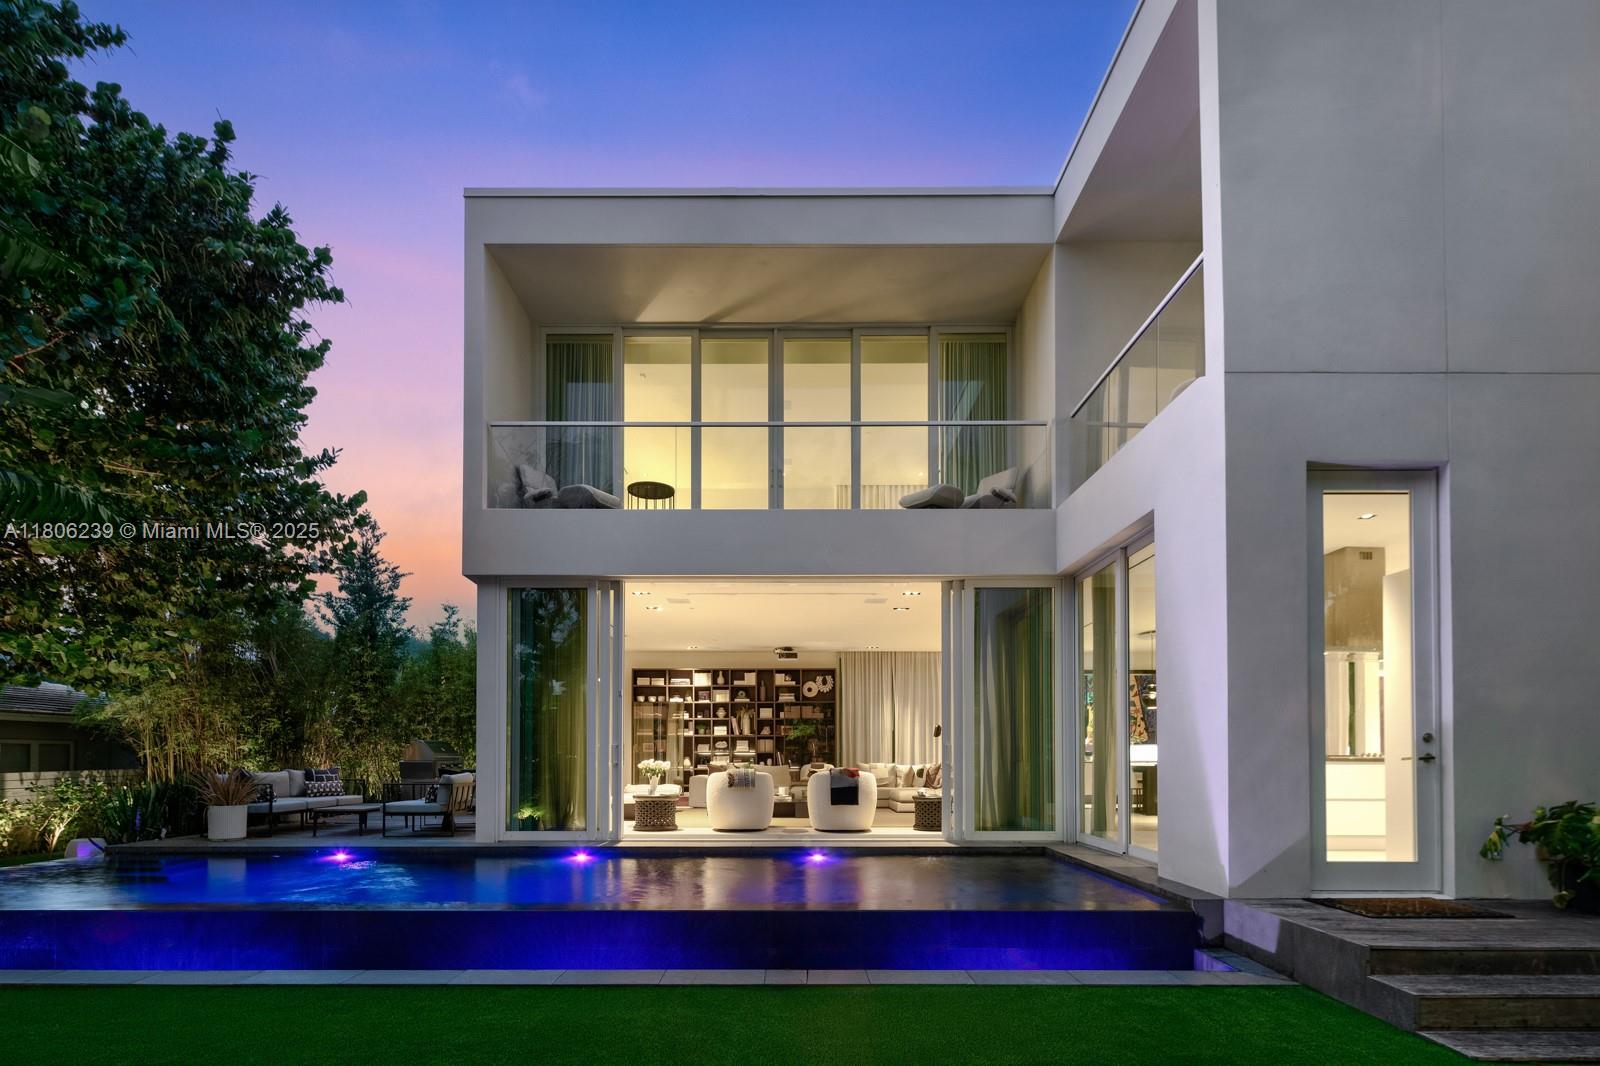
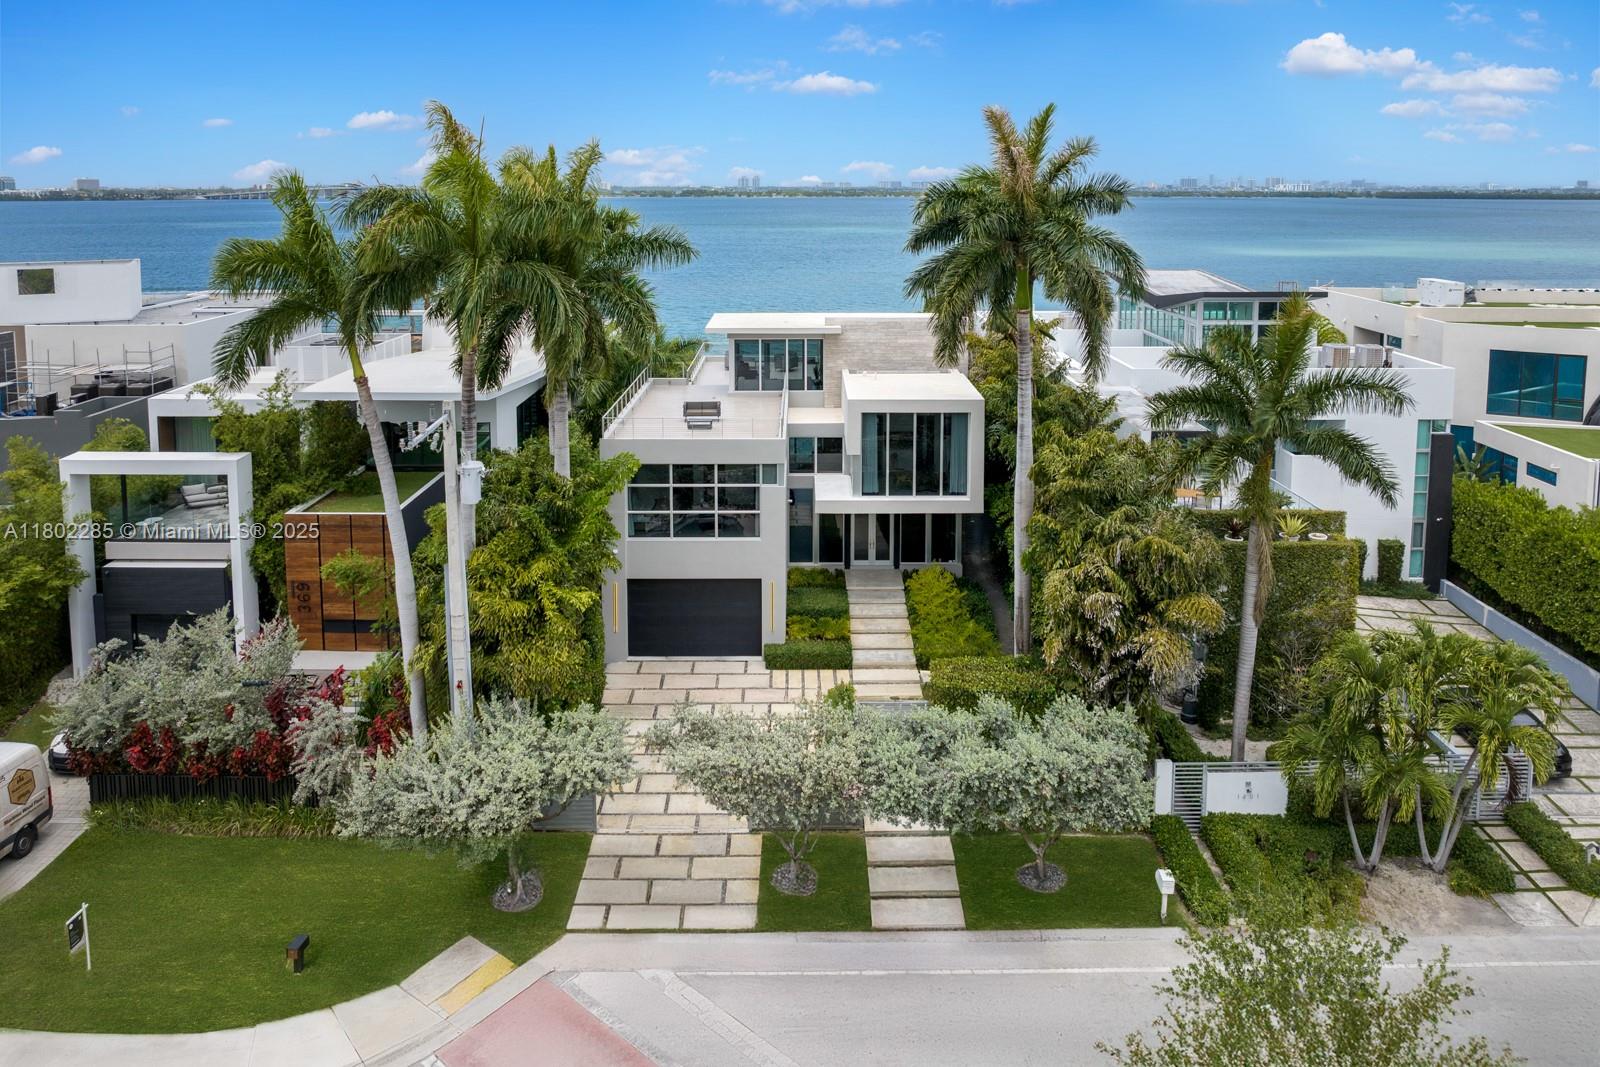
$6,250,000
3
bds
|
4
ba
|
4,185
sqft
|
built
2021
4700 N Meridian Ave, Miami Beach, FL 33140
n/a
Cash flow
n/a
Cash-on-Cash Return
n/a
Cap rate
n/a
Rent to Value Ratio

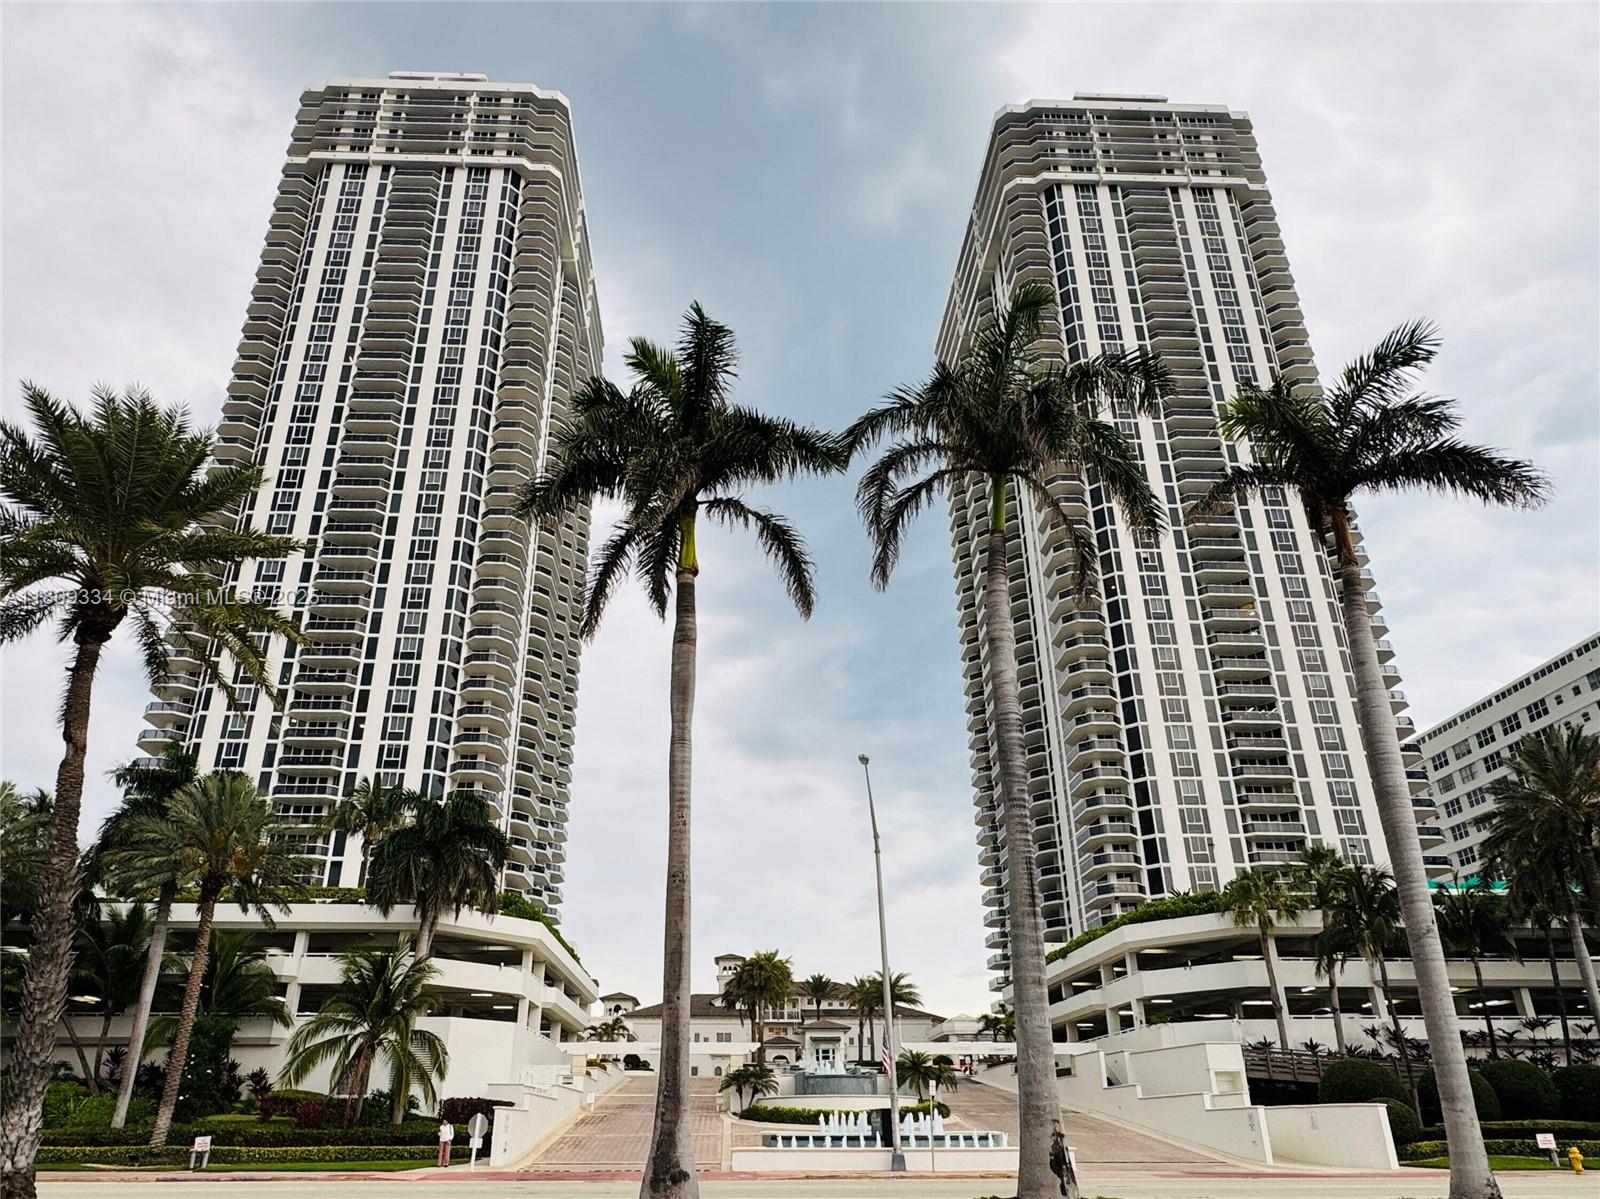
Active
$355,000
0
bds
|
1
ba
|
400
sqft
|
built
1966
5445 Collins Ave, Miami Beach, FL 33140
$-297
Cash flow
-4.4%
Cash-on-Cash Return
5.3%
Cap rate
0.8%
Rent to Value Ratio
1,992 out of 2,195 properties for sale in Miami Beach, FL
Limited Results Shown
Create a free account, or log in to reveal all property listings and enjoy the complete experience.
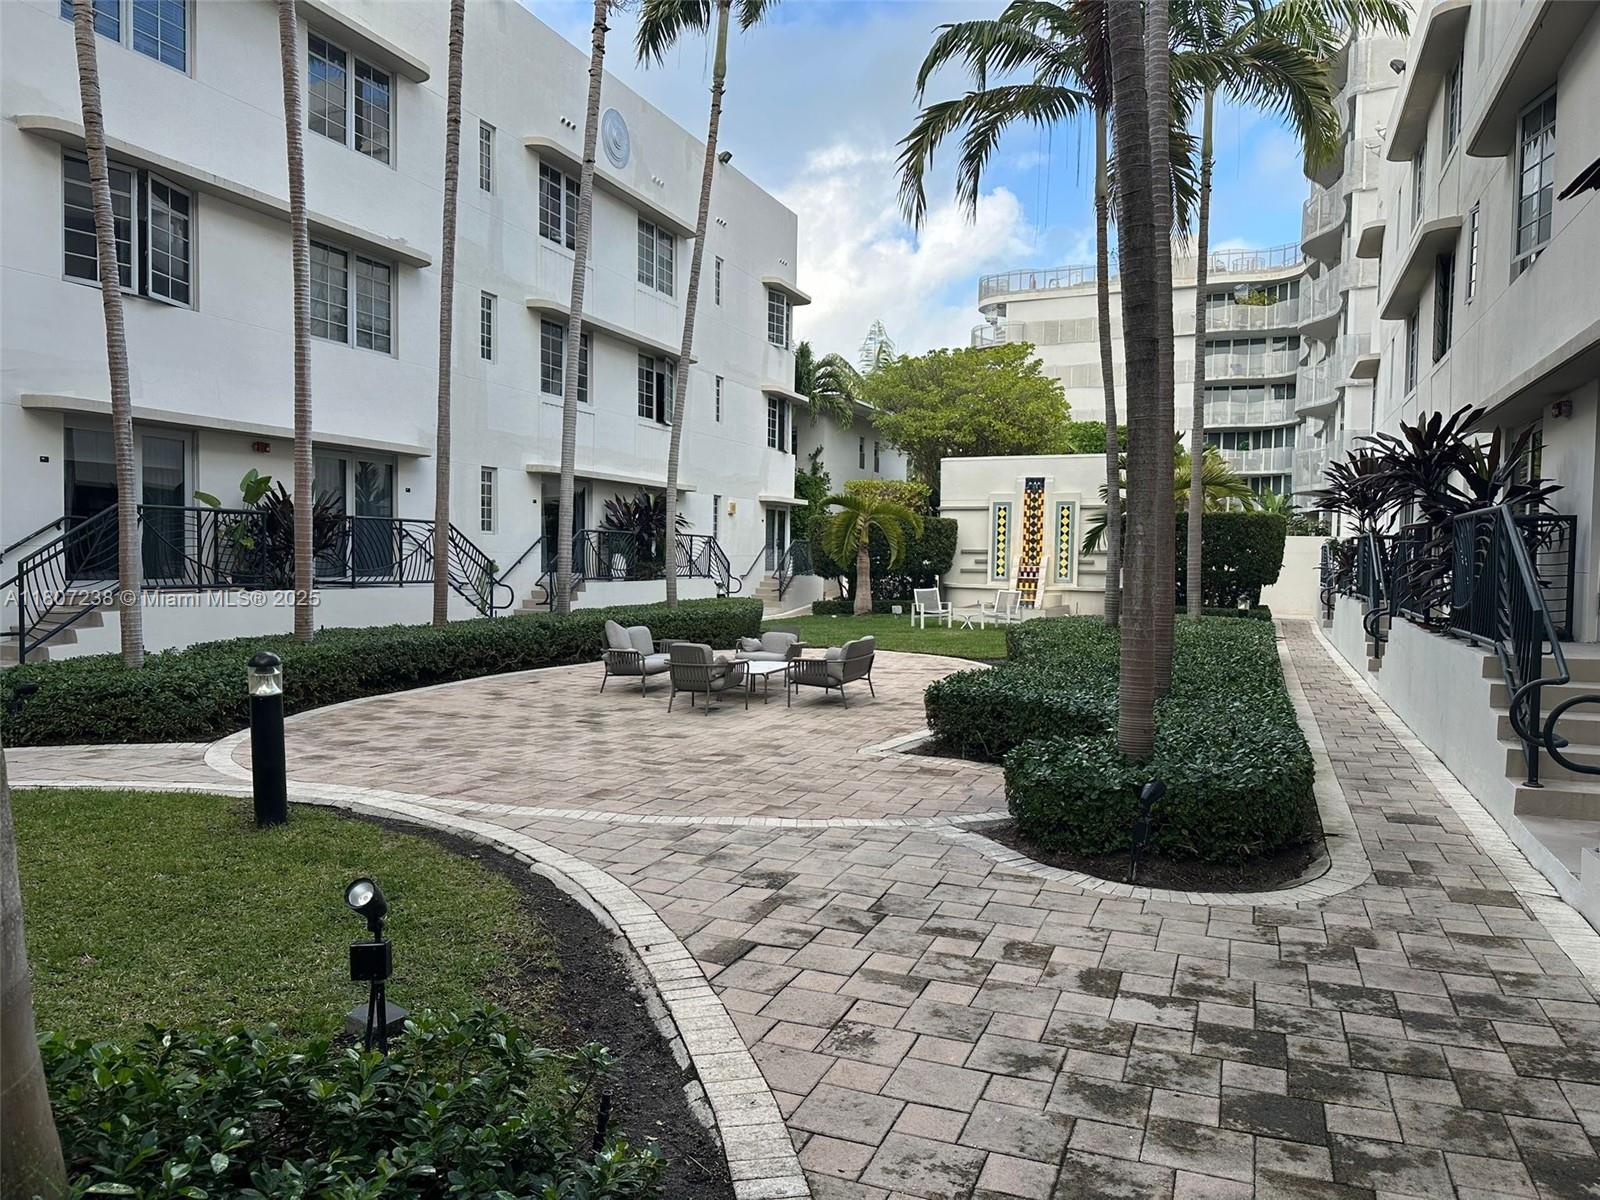
Active
$1,175,000
1
bds
|
2
ba
|
1,100
sqft
|
built
2000
4779 Collins Ave, Miami Beach, FL 33140
$-5,115
Cash flow
-22.7%
Cash-on-Cash Return
1.1%
Cap rate
0.5%
Rent to Value Ratio
Active
$287,800
1
bds
|
1
ba
|
590
sqft
|
built
1936
435 21st St, Miami Beach, FL 33139
$-1,124
Cash flow
-20.4%
Cash-on-Cash Return
1.6%
Cap rate
0.9%
Rent to Value Ratio
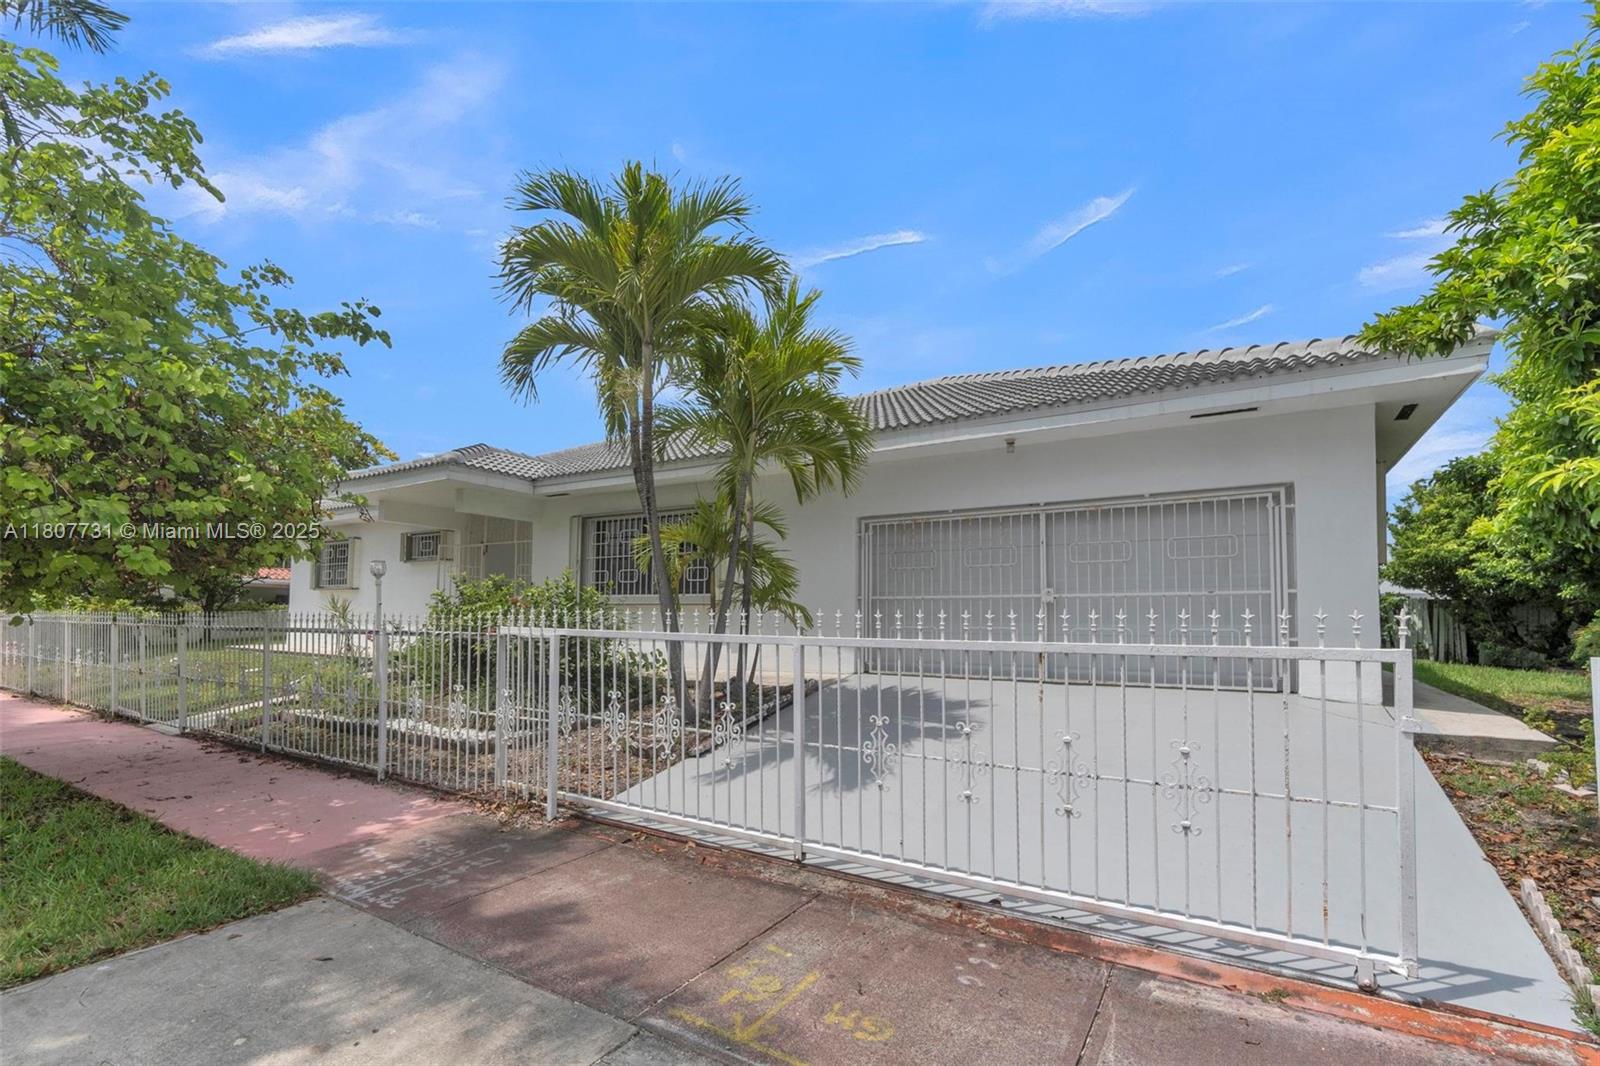
Active
$1,299,000
4
bds
|
3
ba
|
2,620
sqft
|
built
1989
1500 71st St, Miami Beach, FL 33141
$-2,268
Cash flow
-9.1%
Cash-on-Cash Return
4.2%
Cap rate
0.6%
Rent to Value Ratio
Active
$489,000
1
bds
|
2
ba
|
1,075
sqft
|
built
1963
900 Bay Dr, Miami Beach, FL 33141
$-885
Cash flow
-9.4%
Cash-on-Cash Return
4.1%
Cap rate
0.6%
Rent to Value Ratio
Active
$750,000
1
bds
|
2
ba
|
1,503
sqft
|
built
1976
6423 Collins Ave, Miami Beach, FL 33141
$-2,721
Cash flow
-18.9%
Cash-on-Cash Return
1.9%
Cap rate
0.6%
Rent to Value Ratio
Active
$264,000
1
bds
|
1
ba
|
410
sqft
|
built
1976
710 Washington Ave, Miami Beach, FL 33139
$-1,000
Cash flow
-19.8%
Cash-on-Cash Return
1.7%
Cap rate
0.8%
Rent to Value Ratio
Active
$1,299,900
2
bds
|
2
ba
|
1,250
sqft
|
built
1996
6301 Collins Ave, Miami Beach, FL 33141
$-4,657
Cash flow
-18.7%
Cash-on-Cash Return
2.0%
Cap rate
0.6%
Rent to Value Ratio
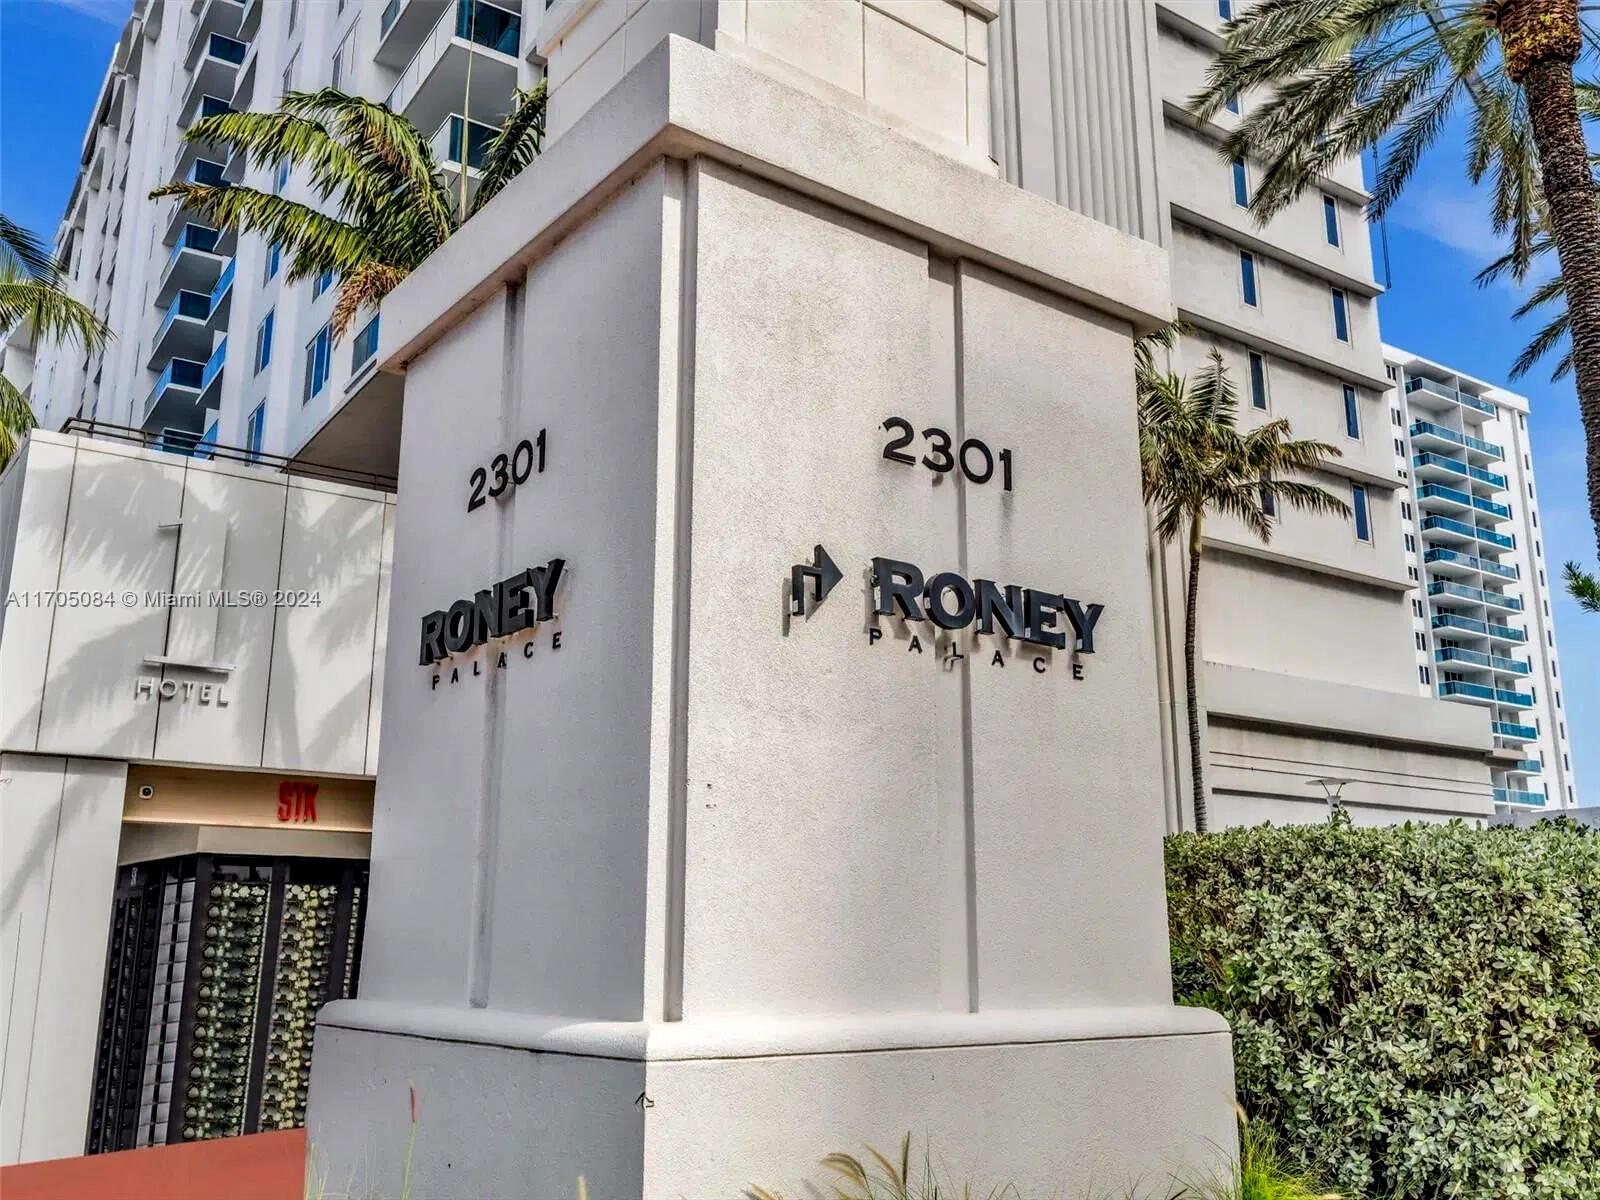
Active
$1,490,000
1
bds
|
2
ba
|
960
sqft
|
built
1926
2301 Collins Ave, Miami Beach, FL 33139
$-6,761
Cash flow
-23.7%
Cash-on-Cash Return
0.8%
Cap rate
0.5%
Rent to Value Ratio
Active
$3,550,000
3
bds
|
3
ba
|
2,158
sqft
|
built
2005
450 Alton Rd, Miami Beach, FL 33139
$-18,903
Cash flow
-27.8%
Cash-on-Cash Return
-0.1%
Cap rate
0.3%
Rent to Value Ratio
Active
$245,000
1
bds
|
2
ba
|
794
sqft
|
built
1970
7850 Byron Ave, Miami Beach, FL 33141
$-702
Cash flow
-14.9%
Cash-on-Cash Return
2.8%
Cap rate
0.9%
Rent to Value Ratio
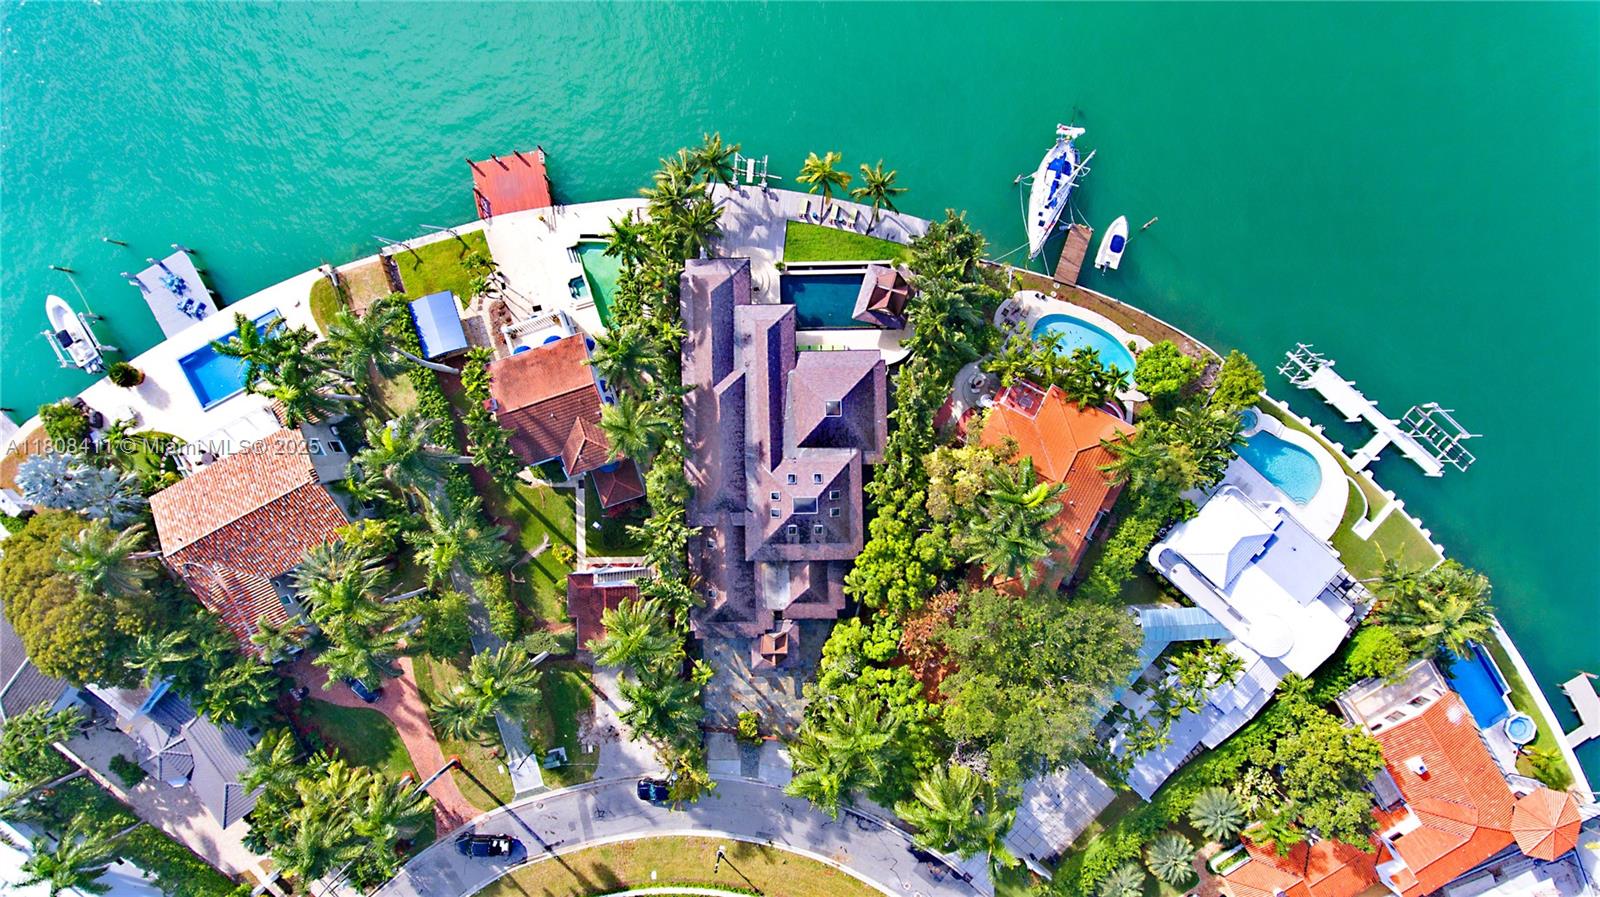
Active
$24,000,000
6
bds
|
6
ba
|
5,146
sqft
|
built
2002
14 W San Marino Dr, Miami Beach, FL 33139
$-134,264
Cash flow
-29.2%
Cash-on-Cash Return
-0.4%
Cap rate
0.0%
Rent to Value Ratio
Active
$330,000
1
bds
|
1
ba
|
452
sqft
|
built
1940
7326 Collins Ave, Miami Beach, FL 33141
$-1,182
Cash flow
-18.7%
Cash-on-Cash Return
2.0%
Cap rate
0.6%
Rent to Value Ratio
Active
$340,000
1
bds
|
2
ba
|
676
sqft
|
built
1971
6969 Collins Ave, Miami Beach, FL 33141
$-1,219
Cash flow
-18.7%
Cash-on-Cash Return
2.0%
Cap rate
0.7%
Rent to Value Ratio
Active
$399,000
1
bds
|
2
ba
|
988
sqft
|
built
1964
5005 Collins Ave, Miami Beach, FL 33140
$-1,747
Cash flow
-22.8%
Cash-on-Cash Return
1.0%
Cap rate
0.8%
Rent to Value Ratio
Active
$1,195,000
2
bds
|
2
ba
|
1,262
sqft
|
built
2001
1330 West Ave, Miami Beach, FL 33139
$-4,628
Cash flow
-20.2%
Cash-on-Cash Return
1.6%
Cap rate
0.5%
Rent to Value Ratio
Active
$165,000
bds
|
1
ba
|
305
sqft
|
built
1936
763 Pennsylvania Ave, Miami Beach, FL 33139
$-697
Cash flow
-22.0%
Cash-on-Cash Return
1.2%
Cap rate
1.2%
Rent to Value Ratio
Active
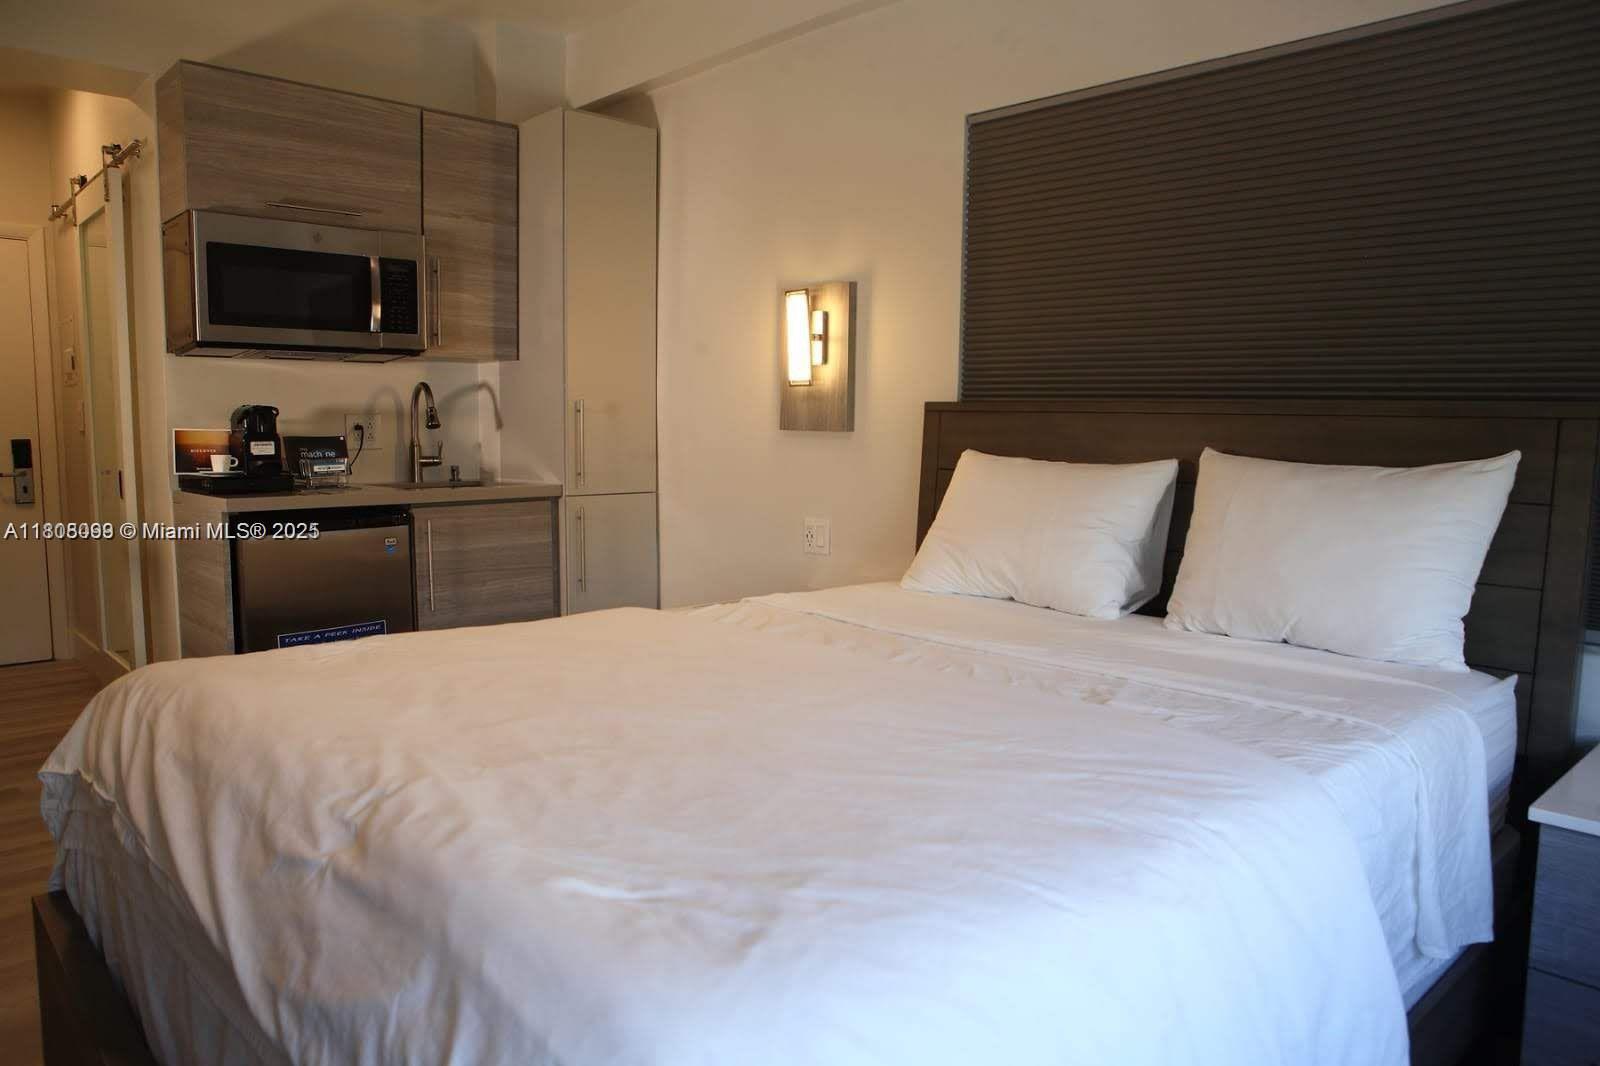
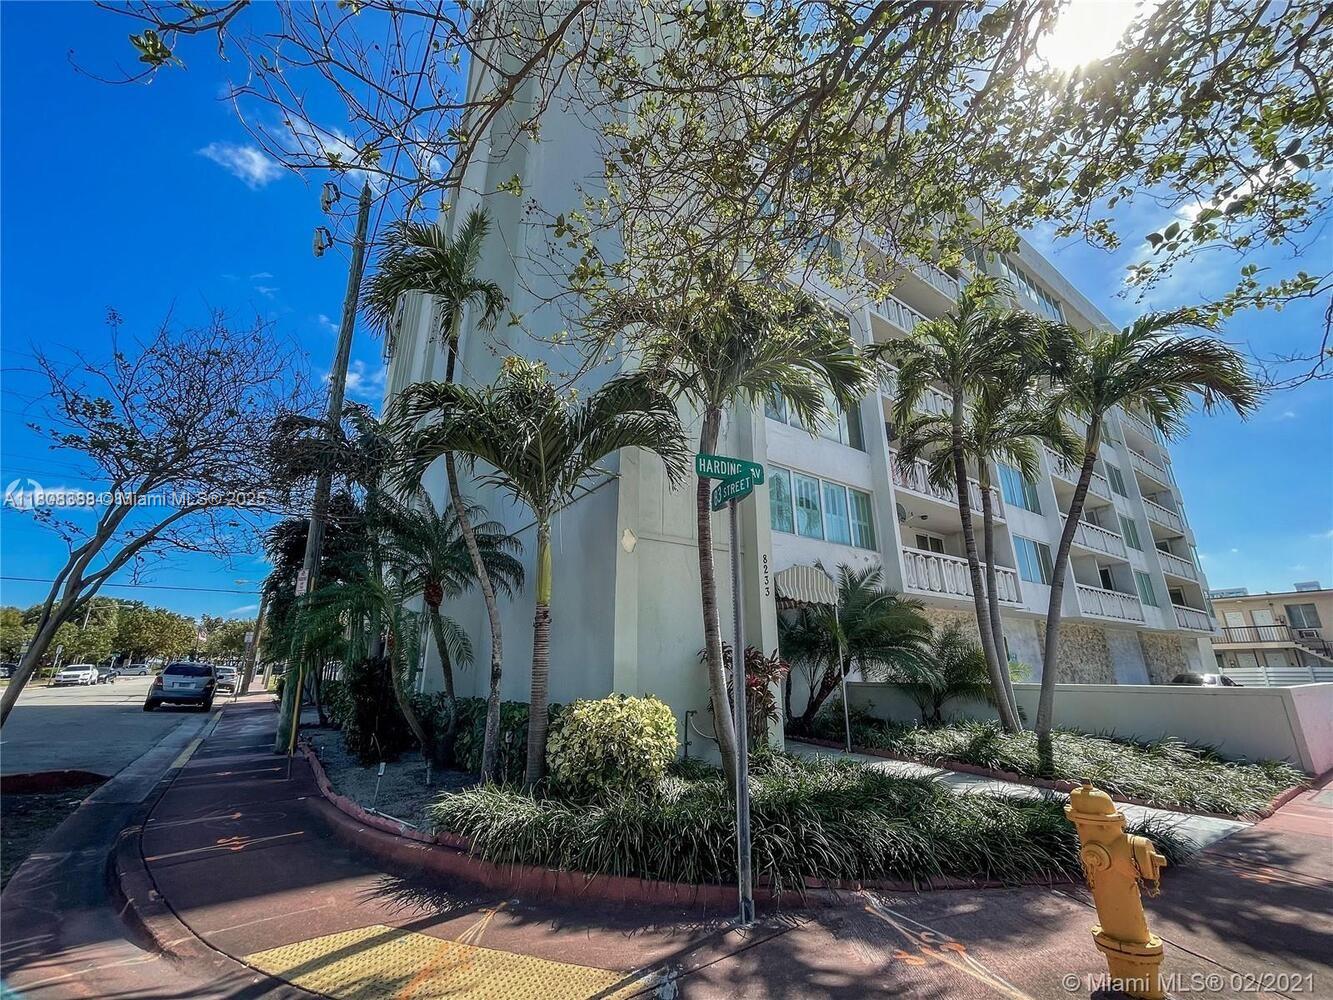
$288,000
1
bds
|
2
ba
|
864
sqft
|
built
1967
8233 Harding Ave, Miami Beach, FL 33141
$-832
Cash flow
-15.1%
Cash-on-Cash Return
2.8%
Cap rate
0.8%
Rent to Value Ratio

Active
$1,649,000
2
bds
|
2
ba
|
1,147
sqft
|
built
1997
650 West Ave, Miami Beach, FL 33139
$-7,068
Cash flow
-22.4%
Cash-on-Cash Return
1.1%
Cap rate
0.4%
Rent to Value Ratio
Active
$285,000
1
bds
|
1
ba
|
650
sqft
|
built
1958
1220 Alton Rd, Miami Beach, FL 33139
$-692
Cash flow
-12.7%
Cash-on-Cash Return
3.4%
Cap rate
0.8%
Rent to Value Ratio
Active
$335,000
2
bds
|
2
ba
|
1,003
sqft
|
built
1963
900 Bay Dr, Miami Beach, FL 33141
$-1,223
Cash flow
-19.0%
Cash-on-Cash Return
1.9%
Cap rate
0.8%
Rent to Value Ratio
Active
$16,500,000
5
bds
|
5
ba
|
5,303
sqft
|
built
2017
1379 N Venetian Way, Miami Beach, FL 33139
$-99,341
Cash flow
-31.4%
Cash-on-Cash Return
-0.9%
Cap rate
0.1%
Rent to Value Ratio

Active
$950,000
2
bds
|
2
ba
|
1,305
sqft
|
built
1980
2625 Collins Ave, Miami Beach, FL 33140
$-3,394
Cash flow
-18.6%
Cash-on-Cash Return
2.0%
Cap rate
0.5%
Rent to Value Ratio
Active
$3,750,000
2
bds
|
3
ba
|
1,121
sqft
|
built
2009
2201 Collins Ave, Miami Beach, FL 33139
$-21,172
Cash flow
-29.5%
Cash-on-Cash Return
-0.5%
Cap rate
0.2%
Rent to Value Ratio
Active
$1,570,000
2
bds
|
3
ba
|
1,428
sqft
|
built
2006
734 Michigan Ave, Miami Beach, FL 33139
$-4,728
Cash flow
-15.7%
Cash-on-Cash Return
2.7%
Cap rate
0.4%
Rent to Value Ratio
Active
$3,890,000
2
bds
|
3
ba
|
1,950
sqft
|
built
1992
5235 Fisher Island Dr, Miami Beach, FL 33109
$-23,633
Cash flow
-31.7%
Cash-on-Cash Return
-1.0%
Cap rate
0.2%
Rent to Value Ratio
Active
$750,000
1
bds
|
2
ba
|
825
sqft
|
built
1969
5701 Collins Ave, Miami Beach, FL 33140
$-3,736
Cash flow
-26.0%
Cash-on-Cash Return
0.3%
Cap rate
0.4%
Rent to Value Ratio
Active
$319,000
1
bds
|
2
ba
|
910
sqft
|
built
1968
6770 Indian Creek Dr, Miami Beach, FL 33141
$-1,222
Cash flow
-20.0%
Cash-on-Cash Return
1.7%
Cap rate
0.8%
Rent to Value Ratio
Active
$355,000
0
bds
|
1
ba
|
400
sqft
|
built
1966
5445 Collins Ave, Miami Beach, FL 33140
$-297
Cash flow
-4.4%
Cash-on-Cash Return
5.3%
Cap rate
0.8%
Rent to Value Ratio
Active
$10,895,000
5
bds
|
6
ba
|
4,473
sqft
|
built
2016
1825 Cleveland Rd, Miami Beach, FL 33141
$-57,222
Cash flow
-27.4%
Cash-on-Cash Return
0.0%
Cap rate
0.1%
Rent to Value Ratio
Active
$275,000
1
bds
|
1
ba
|
520
sqft
|
built
1925
1242 Drexel Ave, Miami Beach, FL 33139
$-841
Cash flow
-16.0%
Cash-on-Cash Return
2.6%
Cap rate
0.7%
Rent to Value Ratio
Active
$6,250,000
3
bds
|
4
ba
|
4,185
sqft
|
built
2021
4700 N Meridian Ave, Miami Beach, FL 33140
n/a
Cash flow
n/a
Cash-on-Cash Return
n/a
Cap rate
n/a
Rent to Value Ratio
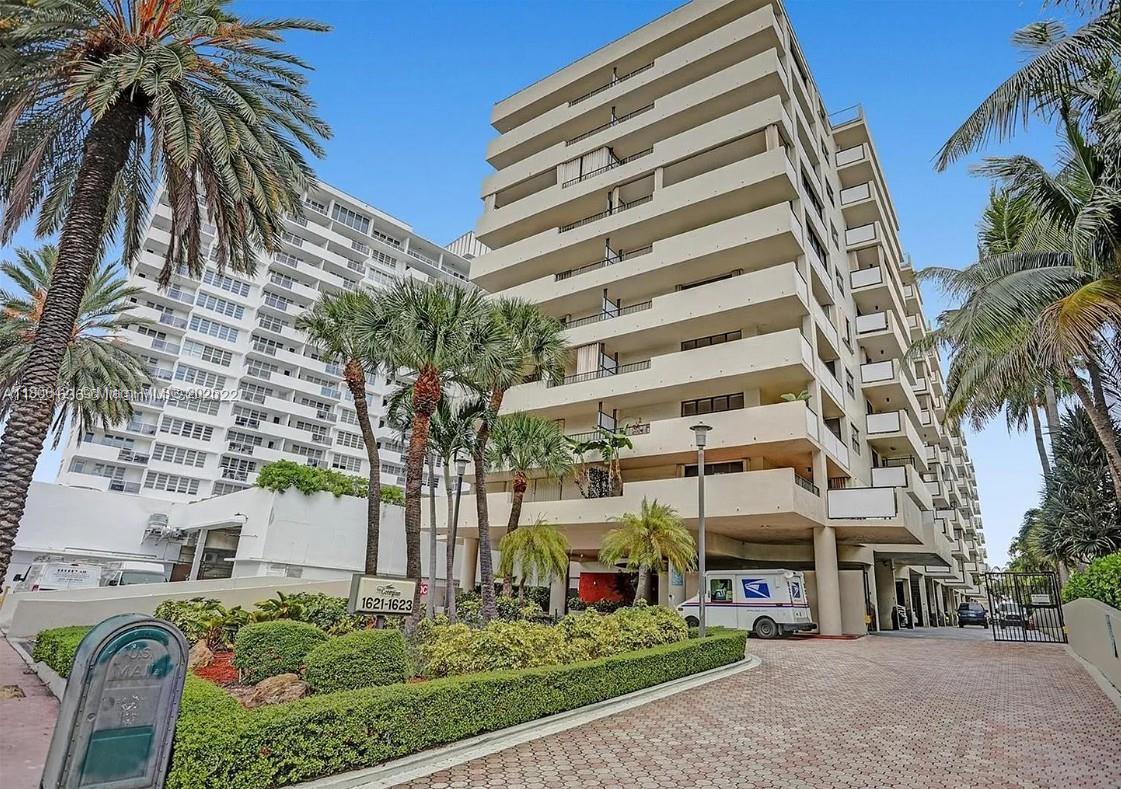
Active
$675,000
2
bds
|
2
ba
|
874
sqft
|
built
1980
1621 Collins Ave, Miami Beach, FL 33139
$-2,259
Cash flow
-17.5%
Cash-on-Cash Return
2.3%
Cap rate
0.5%
Rent to Value Ratio

Active
$390,000
2
bds
|
2
ba
|
900
sqft
|
built
1968
2829 Indian Creek Dr, Miami Beach, FL 33140
$-1,065
Cash flow
-14.2%
Cash-on-Cash Return
3.0%
Cap rate
0.7%
Rent to Value Ratio
Active
$3,690,000
3
bds
|
3
ba
|
2,340
sqft
|
built
1996
300 S Pointe Dr, Miami Beach, FL 33139
$-20,605
Cash flow
-29.1%
Cash-on-Cash Return
-0.4%
Cap rate
0.3%
Rent to Value Ratio

Active
$419,000
1
bds
|
1
ba
|
826
sqft
|
built
1940
1025 Michigan Ave, Miami Beach, FL 33139
$-1,005
Cash flow
-12.5%
Cash-on-Cash Return
3.4%
Cap rate
0.8%
Rent to Value Ratio
Active
$2,100,000
1
bds
|
0
ba
|
0
sqft
|
built
1948
847 81st St, Miami Beach, FL 33141
$-12,277
Cash flow
-30.5%
Cash-on-Cash Return
-0.7%
Cap rate
0.1%
Rent to Value Ratio
Active
$235,000
1
bds
|
1
ba
|
373
sqft
|
built
1925
1244 Pennsylvania Ave, Miami Beach, FL 33139
$-406
Cash flow
-9.0%
Cash-on-Cash Return
4.2%
Cap rate
0.9%
Rent to Value Ratio
Active
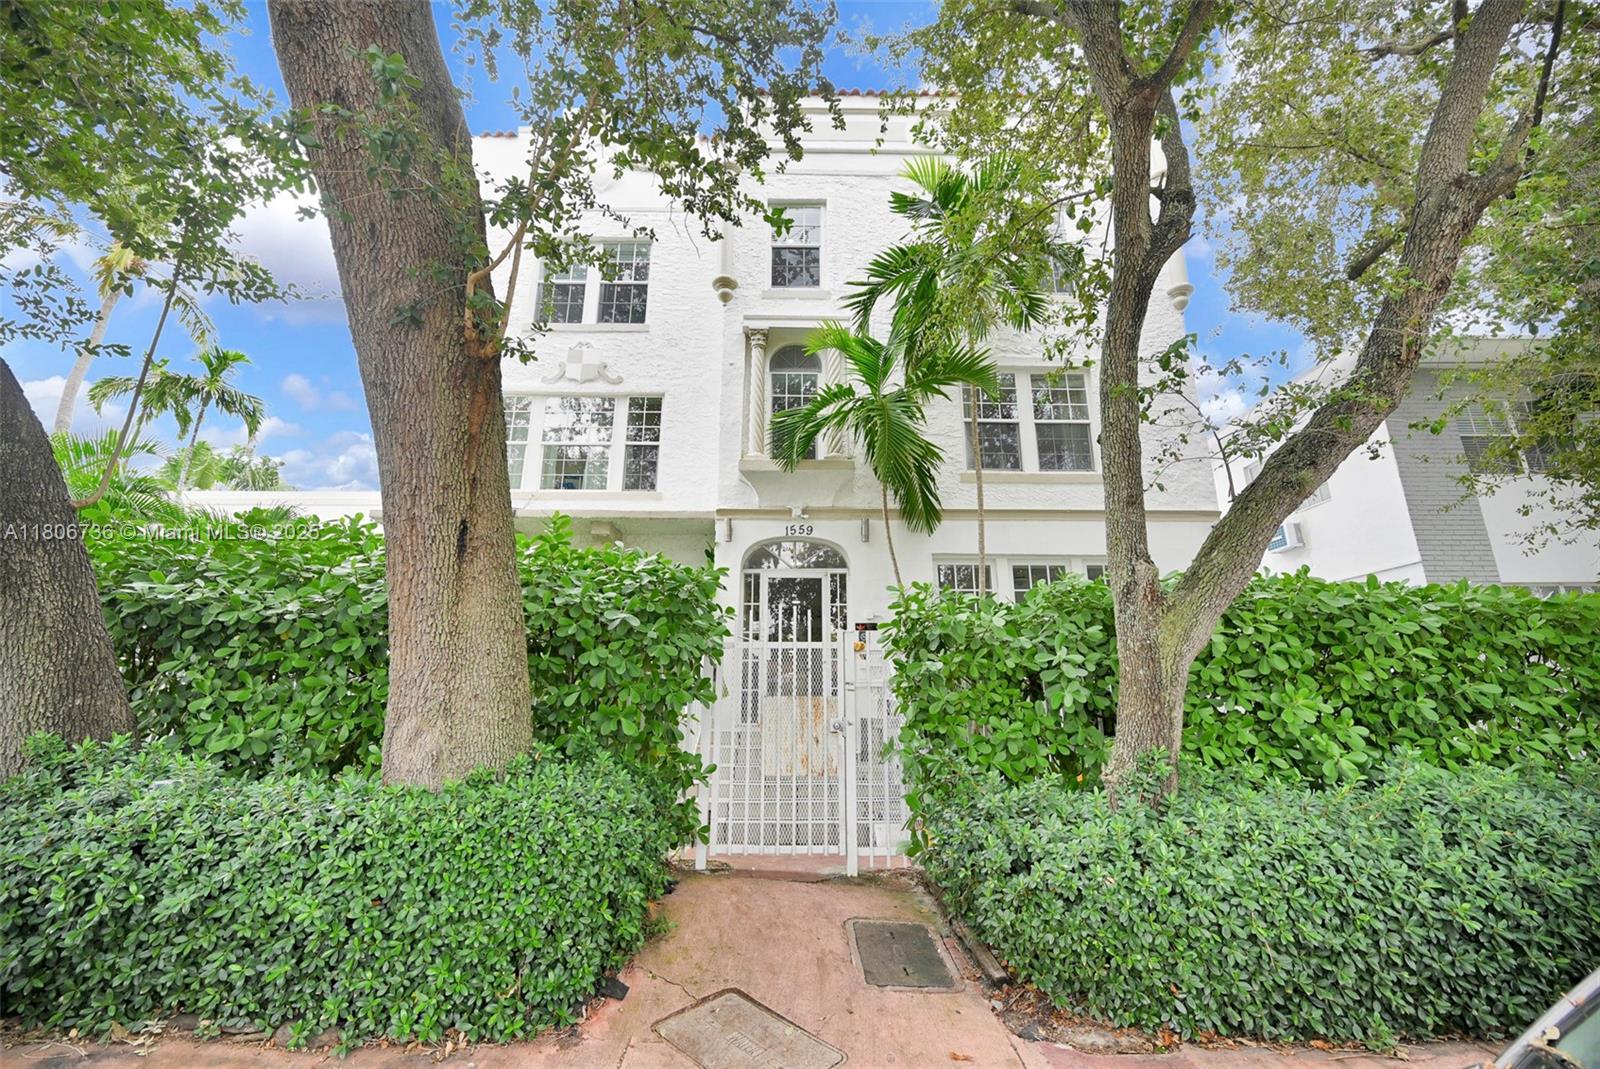
$352,999
2
bds
|
1
ba
|
691
sqft
|
built
1925
1559 Michigan Ave, Miami Beach, FL 33139
$-941
Cash flow
-13.9%
Cash-on-Cash Return
3.1%
Cap rate
0.8%
Rent to Value Ratio
Active
$1,499,000
2
bds
|
3
ba
|
2,534
sqft
|
built
1963
5255 Collins Ave, Miami Beach, FL 33140
$-9,529
Cash flow
-33.2%
Cash-on-Cash Return
-1.3%
Cap rate
0.3%
Rent to Value Ratio
Pending
$595,000
1
bds
|
1
ba
|
793
sqft
|
built
2001
1330 West Ave, Miami Beach, FL 33139
$-2,546
Cash flow
-22.3%
Cash-on-Cash Return
1.1%
Cap rate
0.5%
Rent to Value Ratio