Miami Beach, FL Investment Properties for Sale
Browse homes for sale and investment properties in Miami Beach, FL. Refine your search by price, property type, or more.
Best cash flowing properties in Miami Beach, FL

Active
$250,000
bds
|
1
ba
|
460
sqft
|
built
1953
4201 Indian Creek Dr, Miami Beach, FL 33140
$-65
Cash flow
-1.4%
Cash-on-Cash Return
5.8%
Cap rate
0.9%
Rent to Value Ratio

Active
$285,000
1
bds
|
1
ba
|
460
sqft
|
built
1925
1618 Michigan Ave, Miami Beach, FL 33139
$-451
Cash flow
-8.3%
Cash-on-Cash Return
4.2%
Cap rate
0.9%
Rent to Value Ratio
1,992 out of 2,195 properties for sale in Miami Beach, FL
Limited Results Shown
Create a free account, or log in to reveal all property listings and enjoy the complete experience.
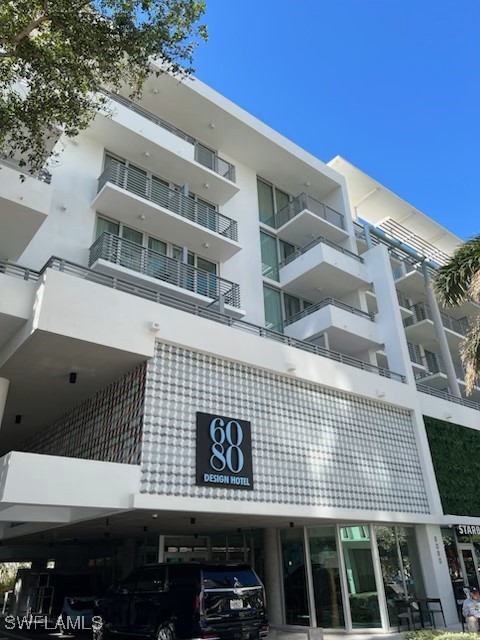
Active
$295,000
1
bds
|
1
ba
|
331
sqft
|
built
2019
6080 Collins Ave, Miami Beach, FL 33140
$-616
Cash flow
-10.9%
Cash-on-Cash Return
3.6%
Cap rate
1.1%
Rent to Value Ratio
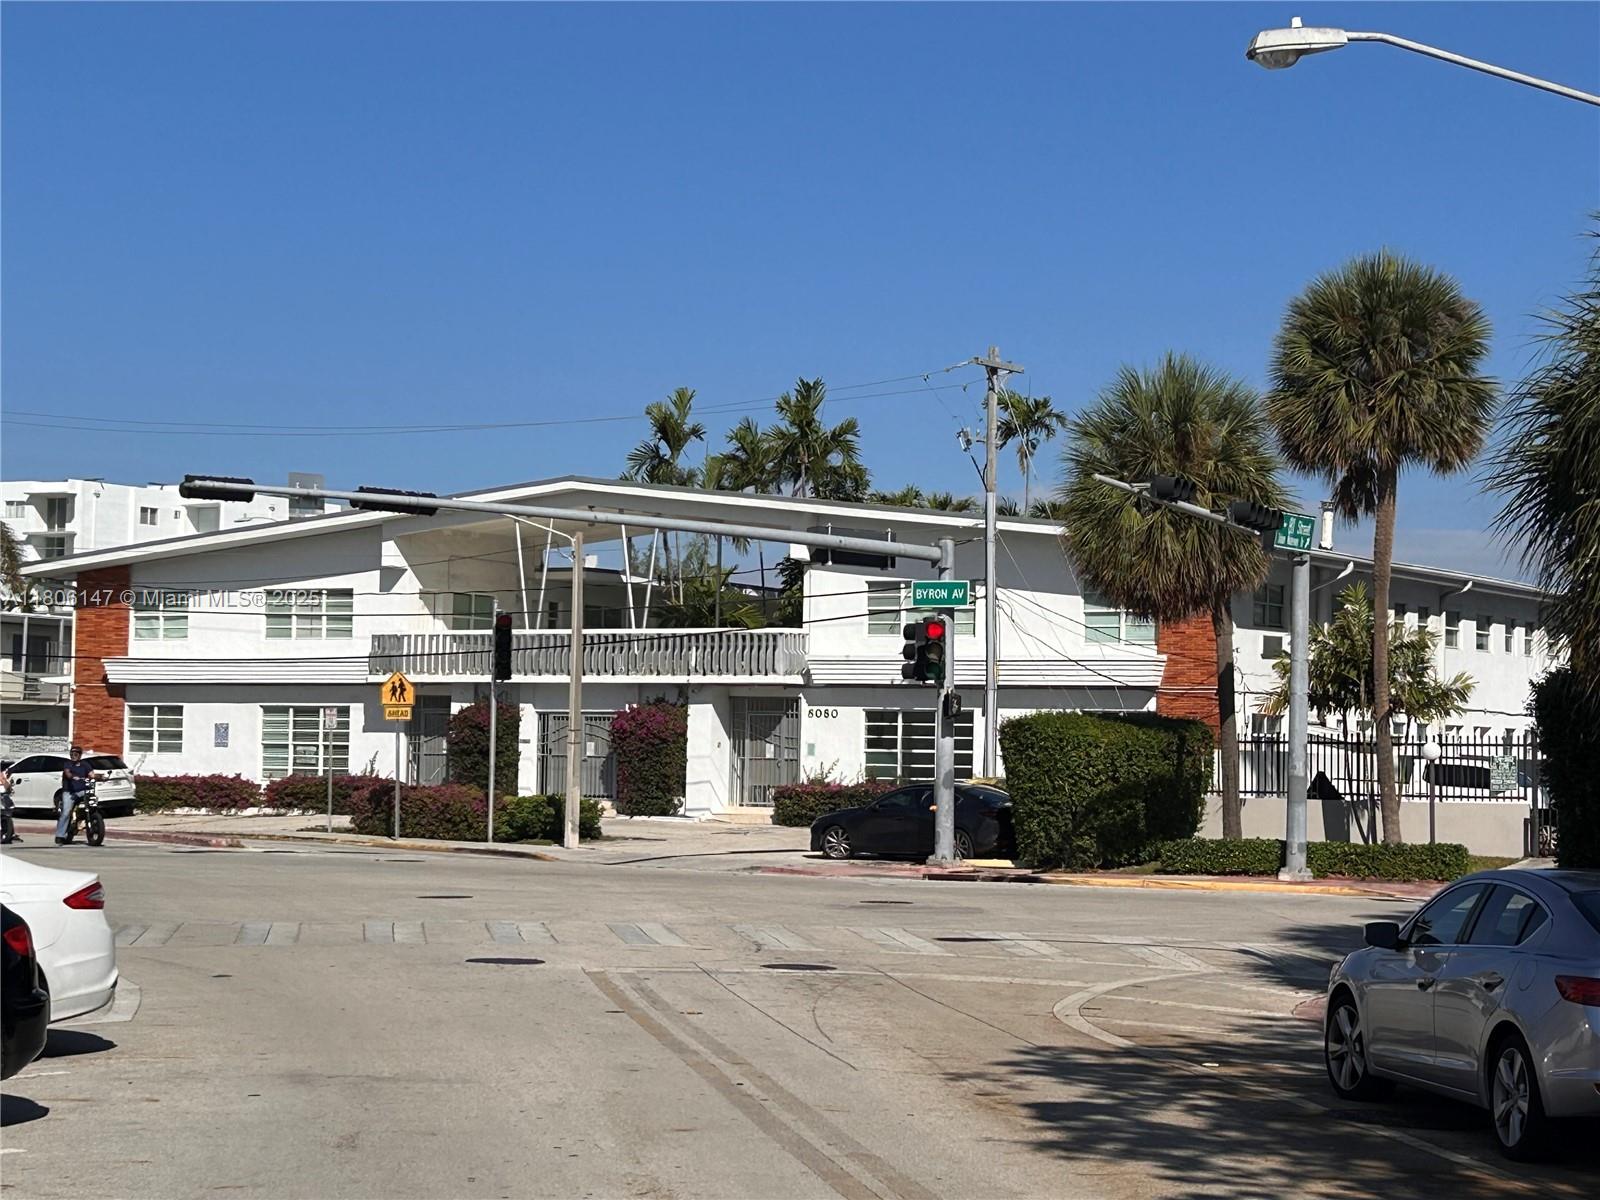
Active
$190,000
0
bds
|
1
ba
|
465
sqft
|
built
1957
8080 Tatum Waterway Dr, Miami Beach, FL 33141
$-560
Cash flow
-15.4%
Cash-on-Cash Return
2.6%
Cap rate
0.8%
Rent to Value Ratio
Active
$1,470,000
2
bds
|
2
ba
|
1,381
sqft
|
built
2006
734 Michigan Ave, Miami Beach, FL 33139
$-4,864
Cash flow
-17.3%
Cash-on-Cash Return
2.2%
Cap rate
0.4%
Rent to Value Ratio
Active
$520,000
2
bds
|
2
ba
|
960
sqft
|
built
1962
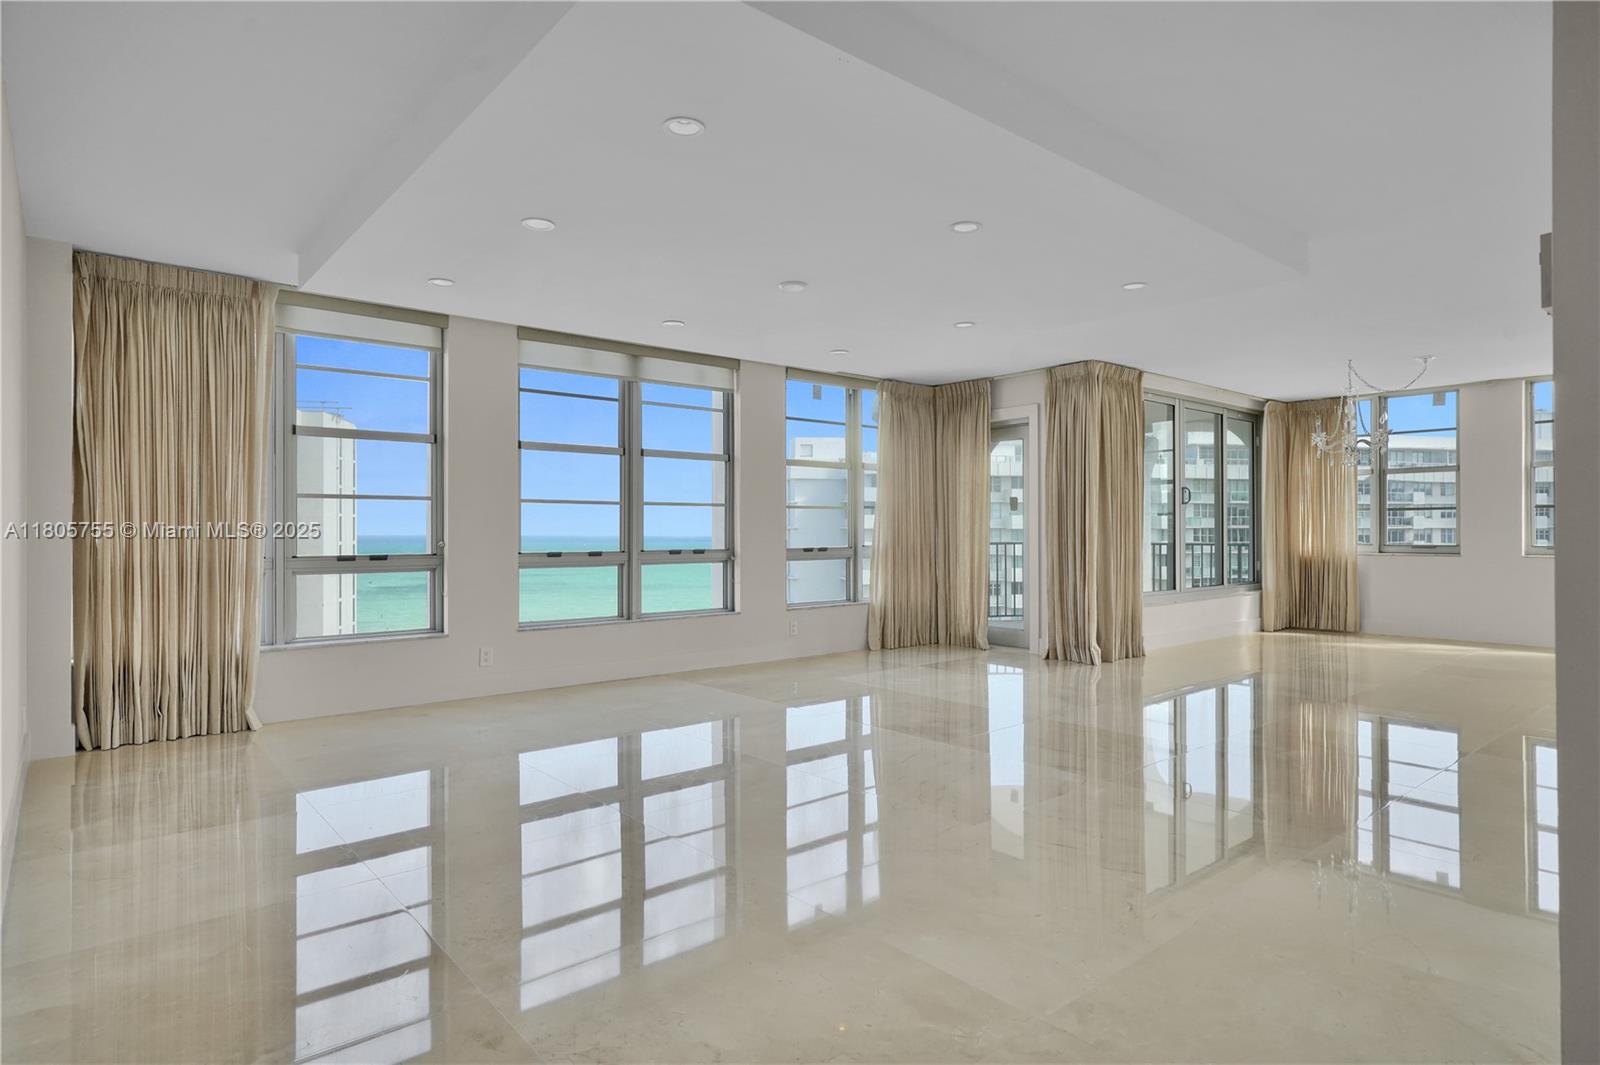
5225 Collins Ave, Miami Beach, FL 33140
$-2,348
Cash flow
-23.6%
Cash-on-Cash Return
0.7%
Cap rate
0.8%
Rent to Value Ratio
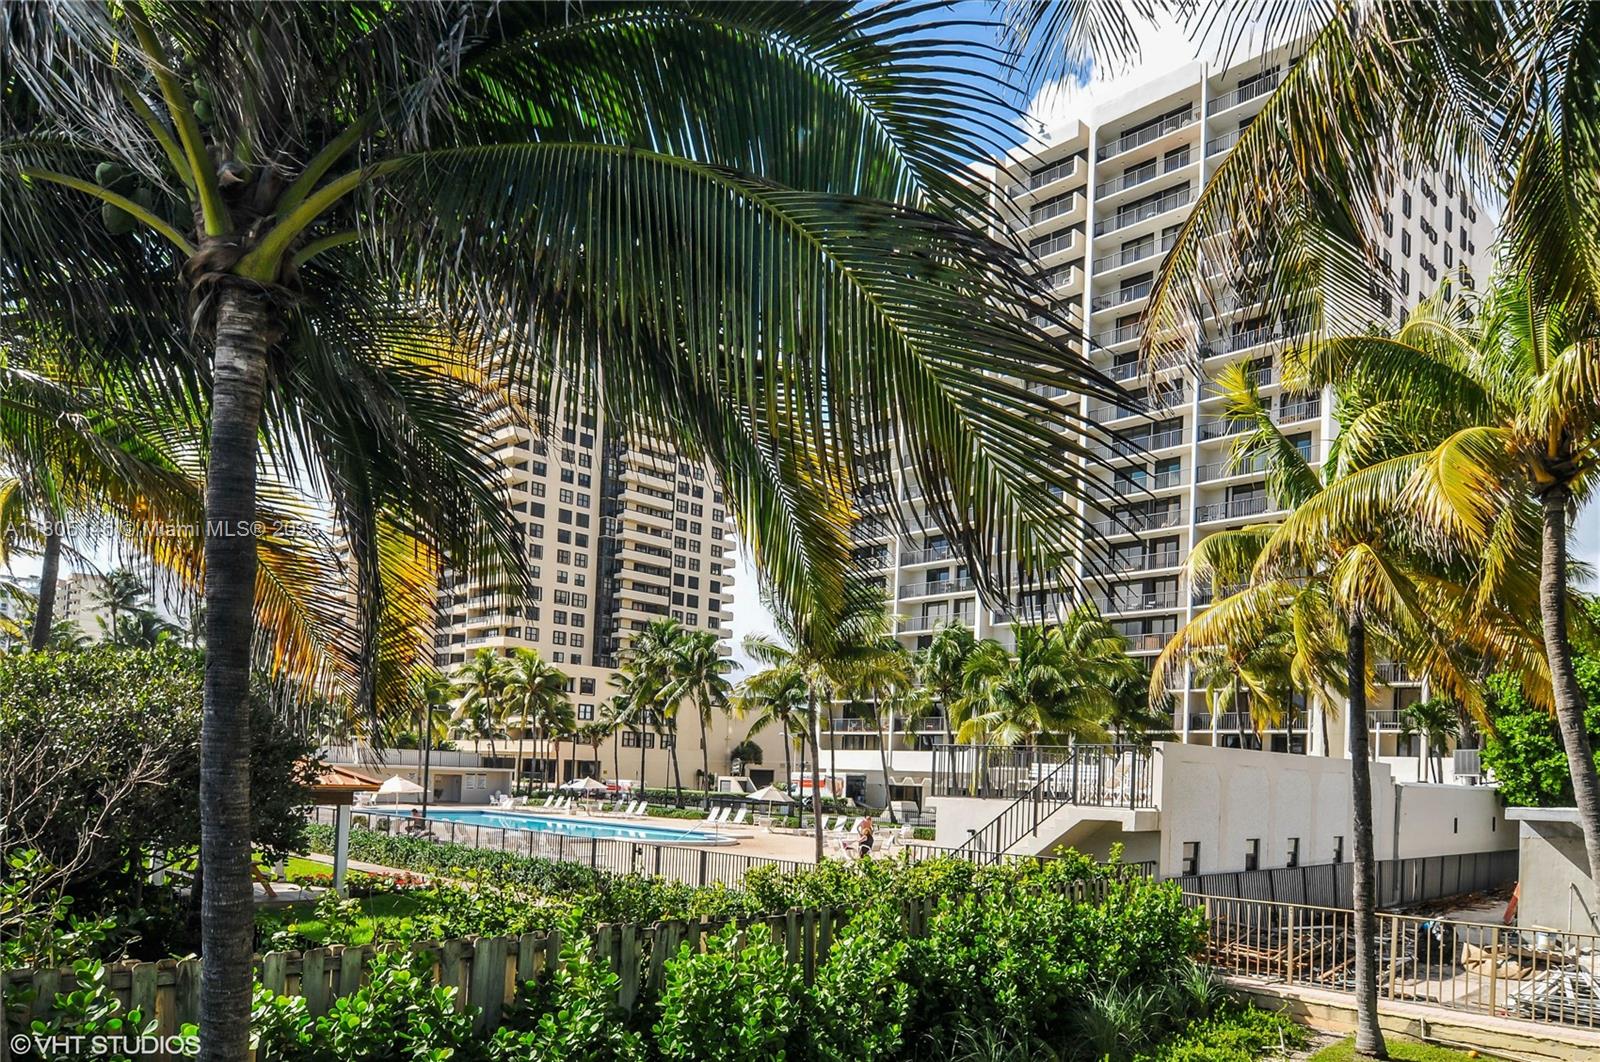
Active
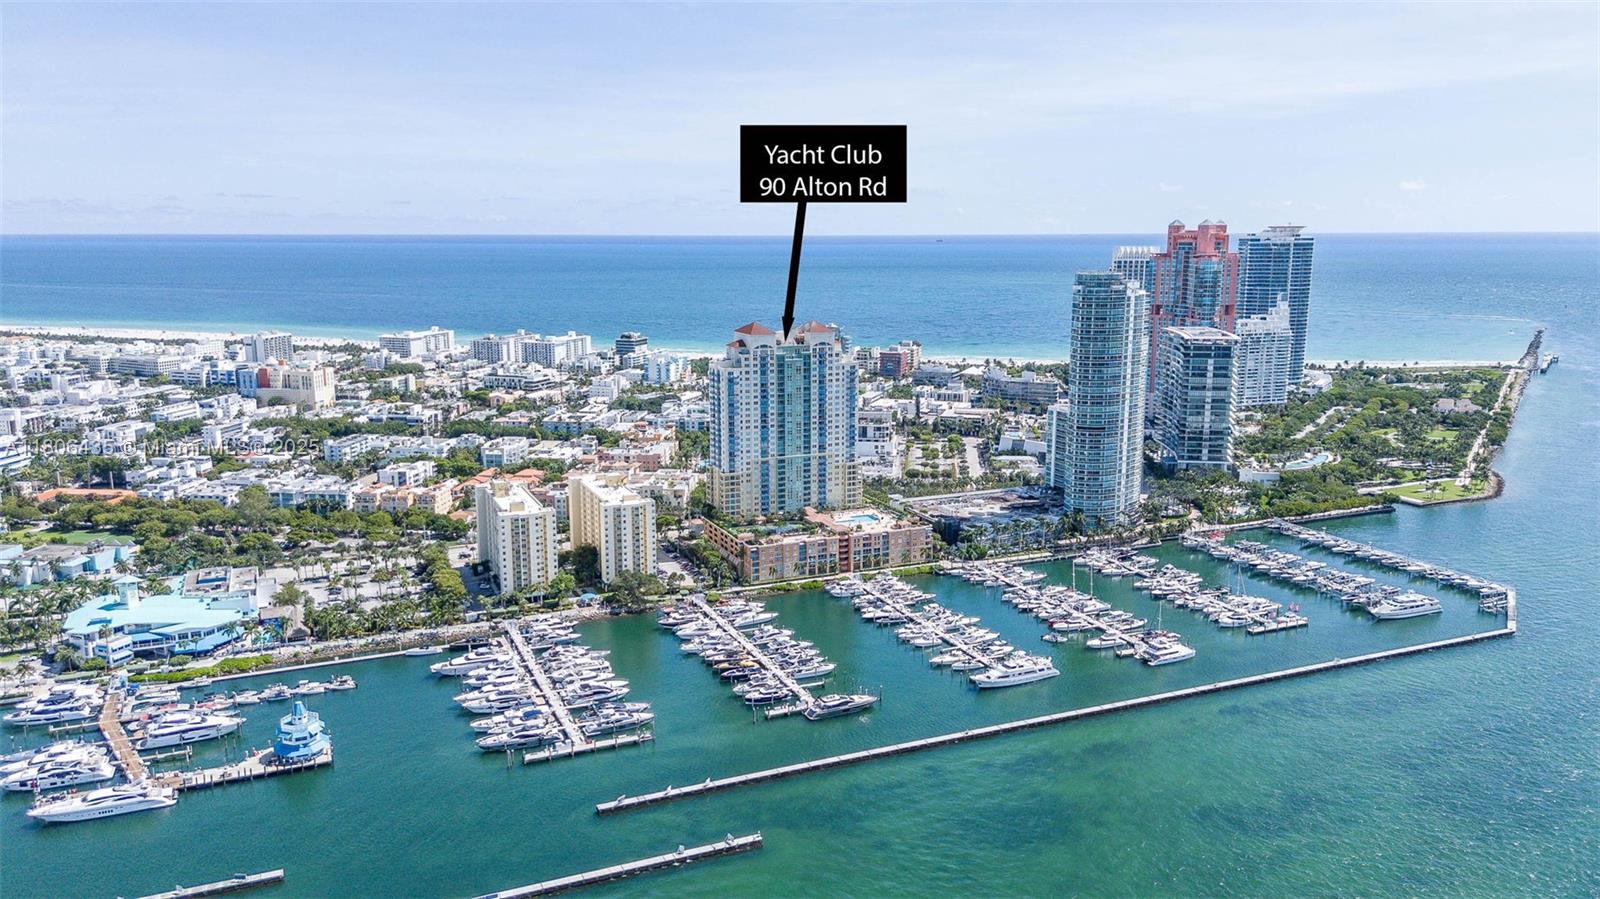
$950,000
2
bds
|
2
ba
|
1,080
sqft
|
built
1999
90 Alton Rd, Miami Beach, FL 33139
$-3,283
Cash flow
-18.0%
Cash-on-Cash Return
2.0%
Cap rate
0.7%
Rent to Value Ratio

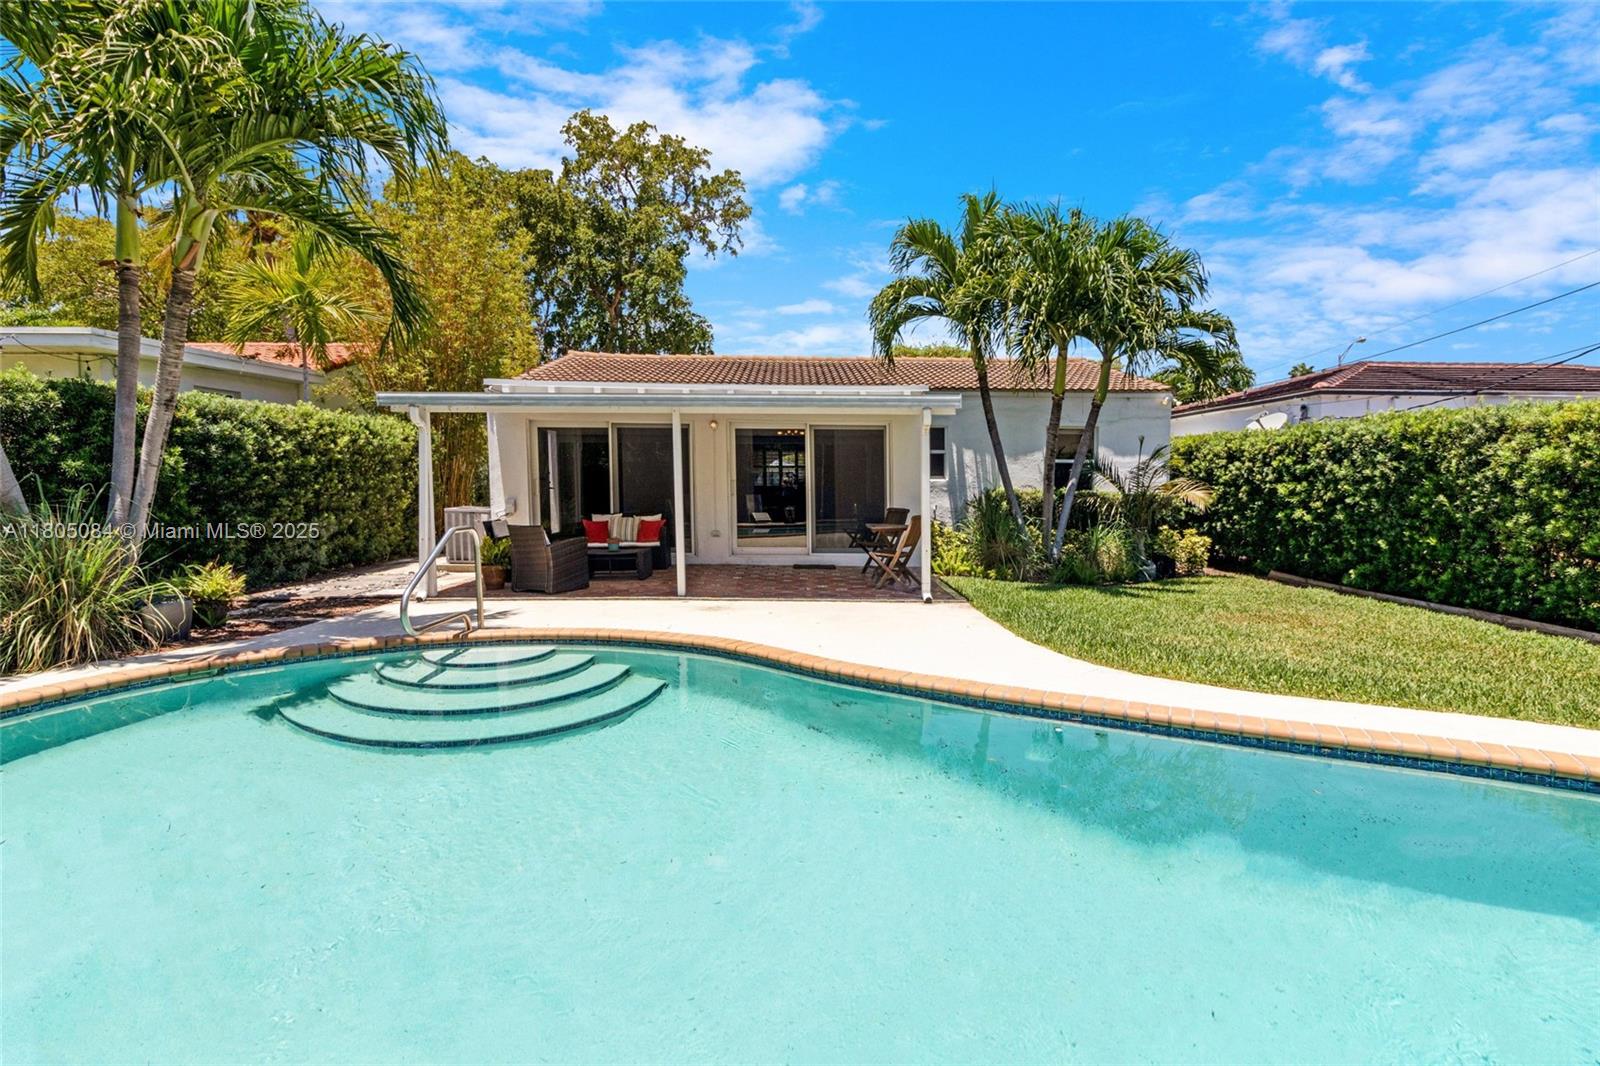
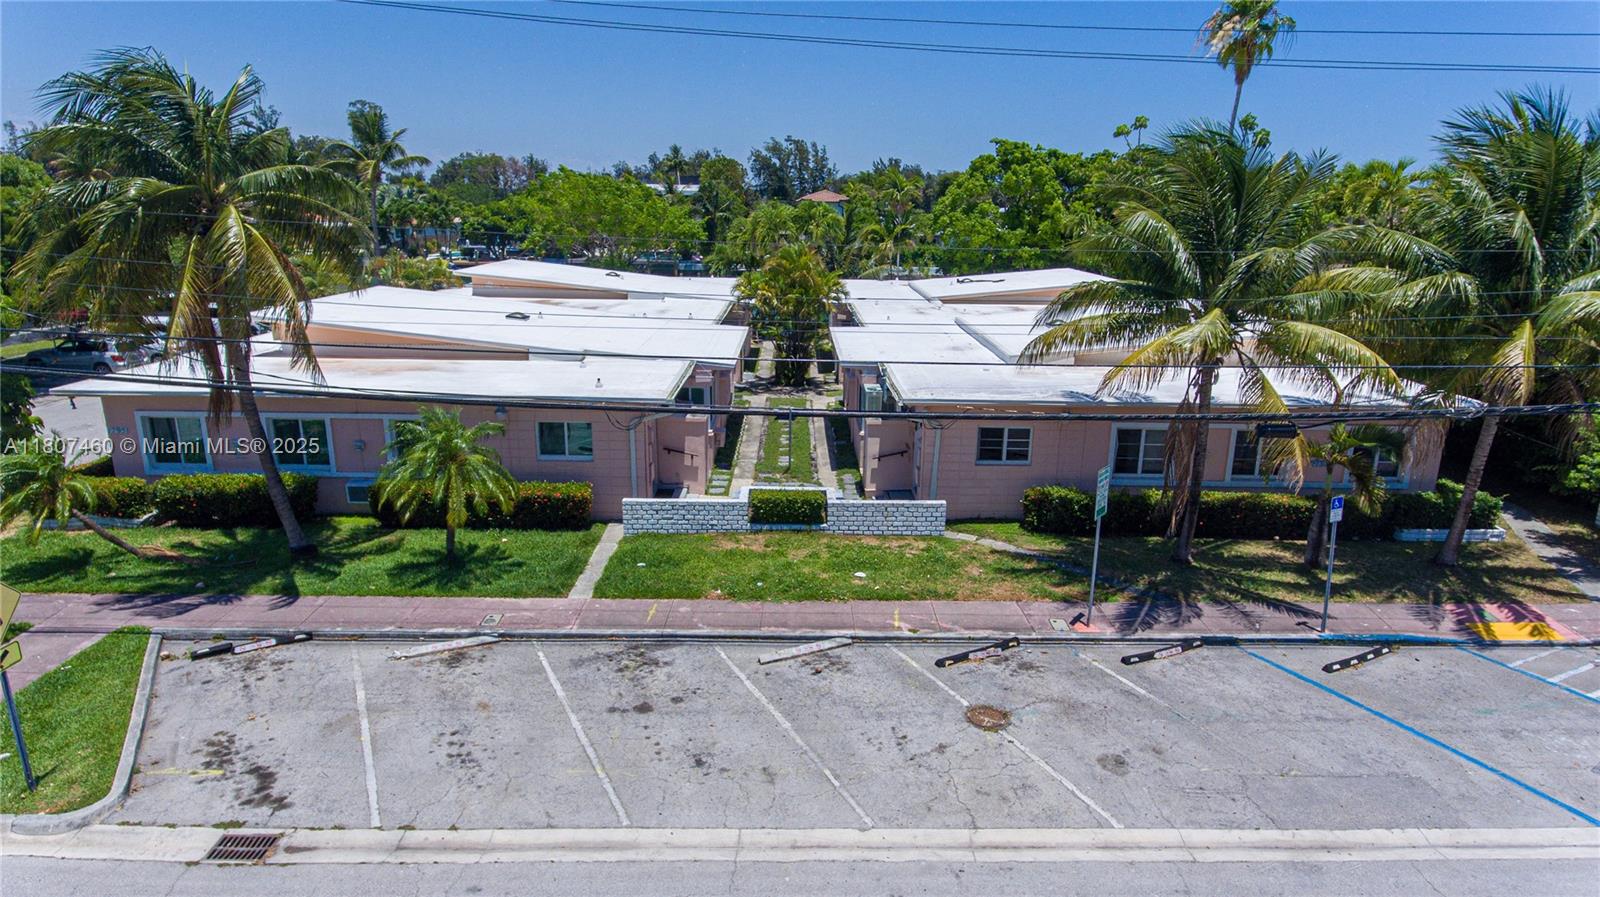
Active
$1,849,900
6
bds
|
0
ba
|
2,668
sqft
|
built
1946
7411 Carlyle Ave, Miami Beach, FL 33141
$-9,602
Cash flow
-27.1%
Cash-on-Cash Return
-0.1%
Cap rate
0.1%
Rent to Value Ratio
Active
$2,425,000
2
bds
|
3
ba
|
1,334
sqft
|
built
2016
1201 20th St, Miami Beach, FL 33139
$-12,096
Cash flow
-26.0%
Cash-on-Cash Return
0.2%
Cap rate
0.3%
Rent to Value Ratio
Active
$250,000
bds
|
1
ba
|
460
sqft
|
built
1953
4201 Indian Creek Dr, Miami Beach, FL 33140
$-65
Cash flow
-1.4%
Cash-on-Cash Return
5.8%
Cap rate
0.9%
Rent to Value Ratio
Active
$295,000
1
bds
|
1
ba
|
380
sqft
|
built
1960
75 Washington Ave, Miami Beach, FL 33139
$-920
Cash flow
-16.3%
Cash-on-Cash Return
2.4%
Cap rate
0.7%
Rent to Value Ratio
Active
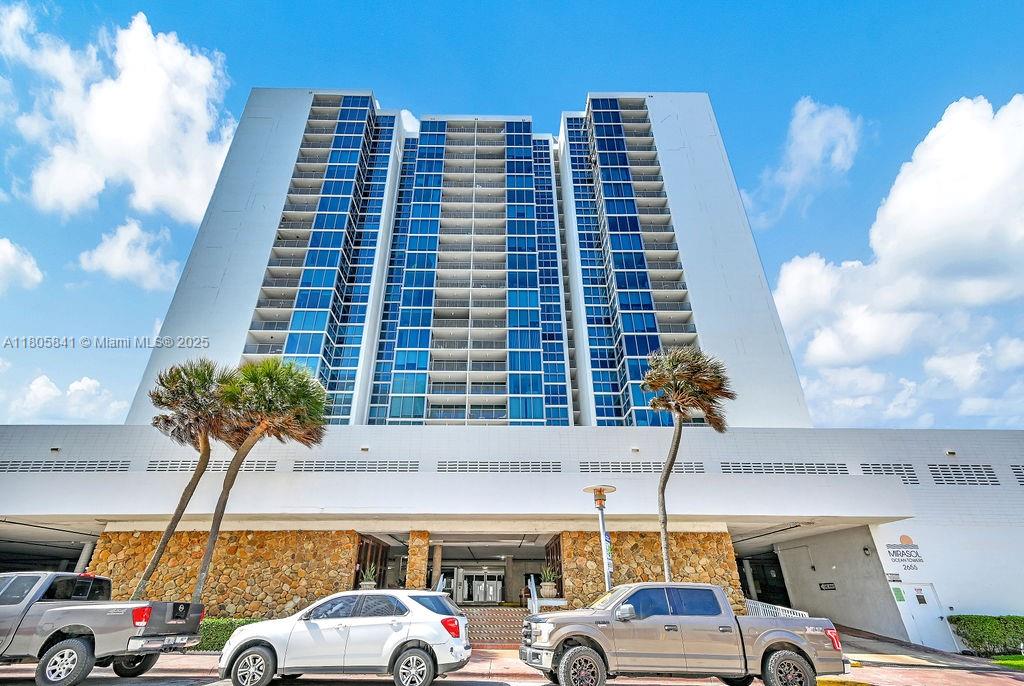
$895,000
3
bds
|
2
ba
|
1,645
sqft
|
built
1975
2655 Collins Ave, Miami Beach, FL 33140
$-3,171
Cash flow
-18.5%
Cash-on-Cash Return
1.9%
Cap rate
0.6%
Rent to Value Ratio
Active
$990,000
2
bds
|
3
ba
|
2,210
sqft
|
built
1970
5660 Collins Ave, Miami Beach, FL 33140
$-3,755
Cash flow
-19.8%
Cash-on-Cash Return
1.6%
Cap rate
0.7%
Rent to Value Ratio
Active
$250,000
0
bds
|
1
ba
|
400
sqft
|
built
1947
1611 Euclid Ave, Miami Beach, FL 33139
$-492
Cash flow
-10.3%
Cash-on-Cash Return
3.8%
Cap rate
0.8%
Rent to Value Ratio
Active
$1,075,000
2
bds
|
2
ba
|
1,645
sqft
|
built
1973
2655 Collins Ave, Miami Beach, FL 33140
$-3,986
Cash flow
-19.3%
Cash-on-Cash Return
1.7%
Cap rate
0.6%
Rent to Value Ratio
Active
$595,000
2
bds
|
2
ba
|
940
sqft
|
built
1966
701 Collins Ave, Miami Beach, FL 33139
$-2,537
Cash flow
-22.2%
Cash-on-Cash Return
1.0%
Cap rate
0.5%
Rent to Value Ratio
Active
$890,000
2
bds
|
1
ba
|
1,322
sqft
|
built
1939
1558 Normandy Dr, Miami Beach, FL 33141
$-1,120
Cash flow
-6.6%
Cash-on-Cash Return
4.6%
Cap rate
0.6%
Rent to Value Ratio
Active
$449,000
1
bds
|
2
ba
|
1,075
sqft
|
built
1980
2625 Collins Ave, Miami Beach, FL 33140
$-912
Cash flow
-10.6%
Cash-on-Cash Return
3.7%
Cap rate
0.8%
Rent to Value Ratio

Active
$620,000
1
bds
|
2
ba
|
966
sqft
|
built
2005
2001 Meridian Ave, Miami Beach, FL 33139
$-1,737
Cash flow
-14.6%
Cash-on-Cash Return
2.8%
Cap rate
0.8%
Rent to Value Ratio
Active
$1,125,000
2
bds
|
2
ba
|
890
sqft
|
built
1951
1785 Calais Dr, Miami Beach, FL 33141
$-4,458
Cash flow
-20.7%
Cash-on-Cash Return
1.4%
Cap rate
0.2%
Rent to Value Ratio
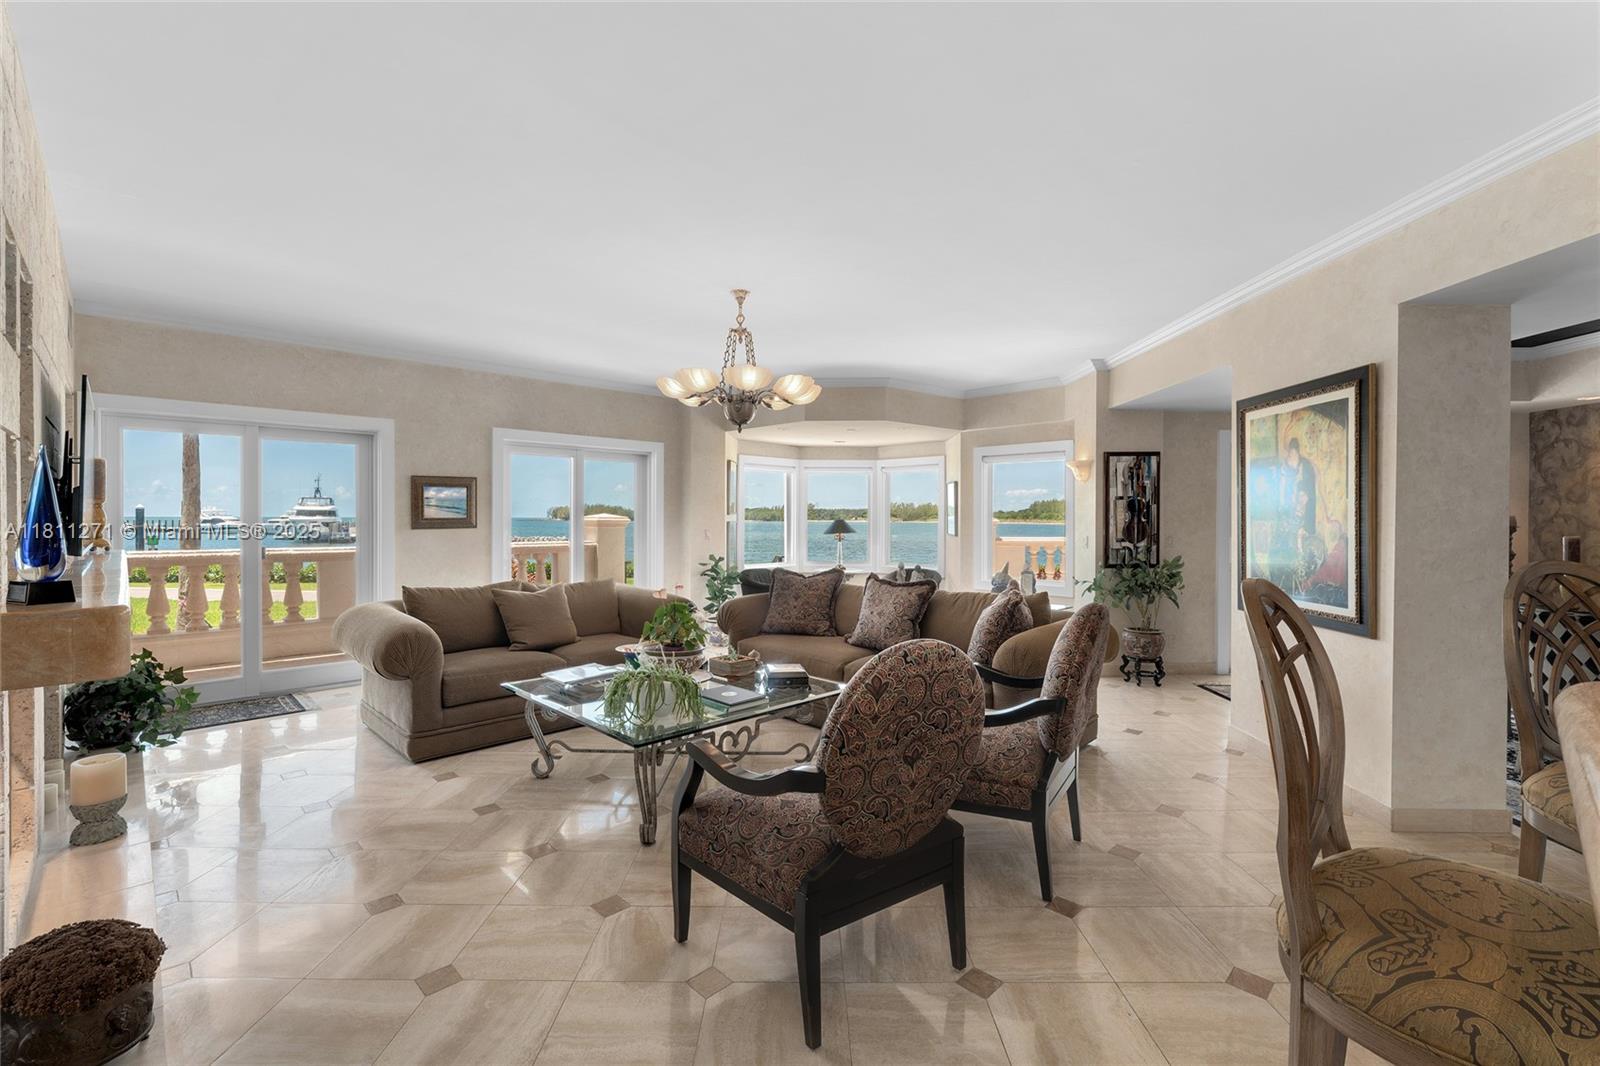
Active
$5,800,000
4
bds
|
4
ba
|
3,192
sqft
|
built
1986
2213 Fisher Island Dr, Miami Beach, FL 33109
$-30,363
Cash flow
-27.3%
Cash-on-Cash Return
-0.1%
Cap rate
0.1%
Rent to Value Ratio
Active
$450,000
2
bds
|
2
ba
|
960
sqft
|
built
1983
1775 Washington Ave, Miami Beach, FL 33139
$-1,575
Cash flow
-18.3%
Cash-on-Cash Return
1.9%
Cap rate
0.7%
Rent to Value Ratio

Active
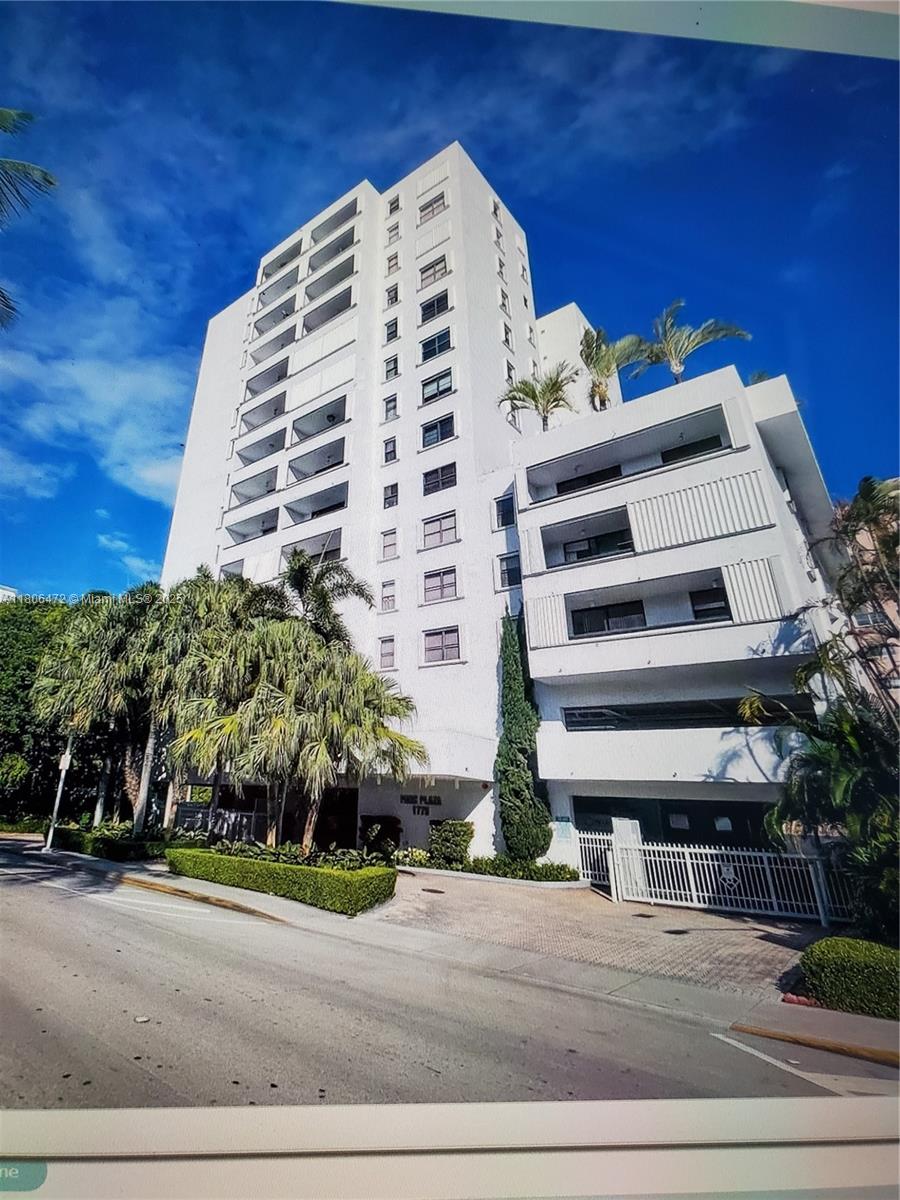
$369,000
1
bds
|
1
ba
|
620
sqft
|
built
1960
65 Washington Ave, Miami Beach, FL 33139
$-1,548
Cash flow
-21.9%
Cash-on-Cash Return
1.1%
Cap rate
0.5%
Rent to Value Ratio
Active
$3,499,000
3
bds
|
3
ba
|
3,068
sqft
|
built
1943
5860 Lagorce Dr, Miami Beach, FL 33140
$-13,068
Cash flow
-19.5%
Cash-on-Cash Return
1.7%
Cap rate
0.3%
Rent to Value Ratio
Active
$1,095,000
2
bds
|
2
ba
|
0
sqft
|
built
1982
2555 Collins Ave, Miami Beach, FL 33140
$-4,484
Cash flow
-21.4%
Cash-on-Cash Return
1.2%
Cap rate
0.5%
Rent to Value Ratio
Active
$550,000
1
bds
|
2
ba
|
960
sqft
|
built
1968
5601 Collins Ave, Miami Beach, FL 33140
$-1,428
Cash flow
-13.5%
Cash-on-Cash Return
3.0%
Cap rate
0.5%
Rent to Value Ratio
Active
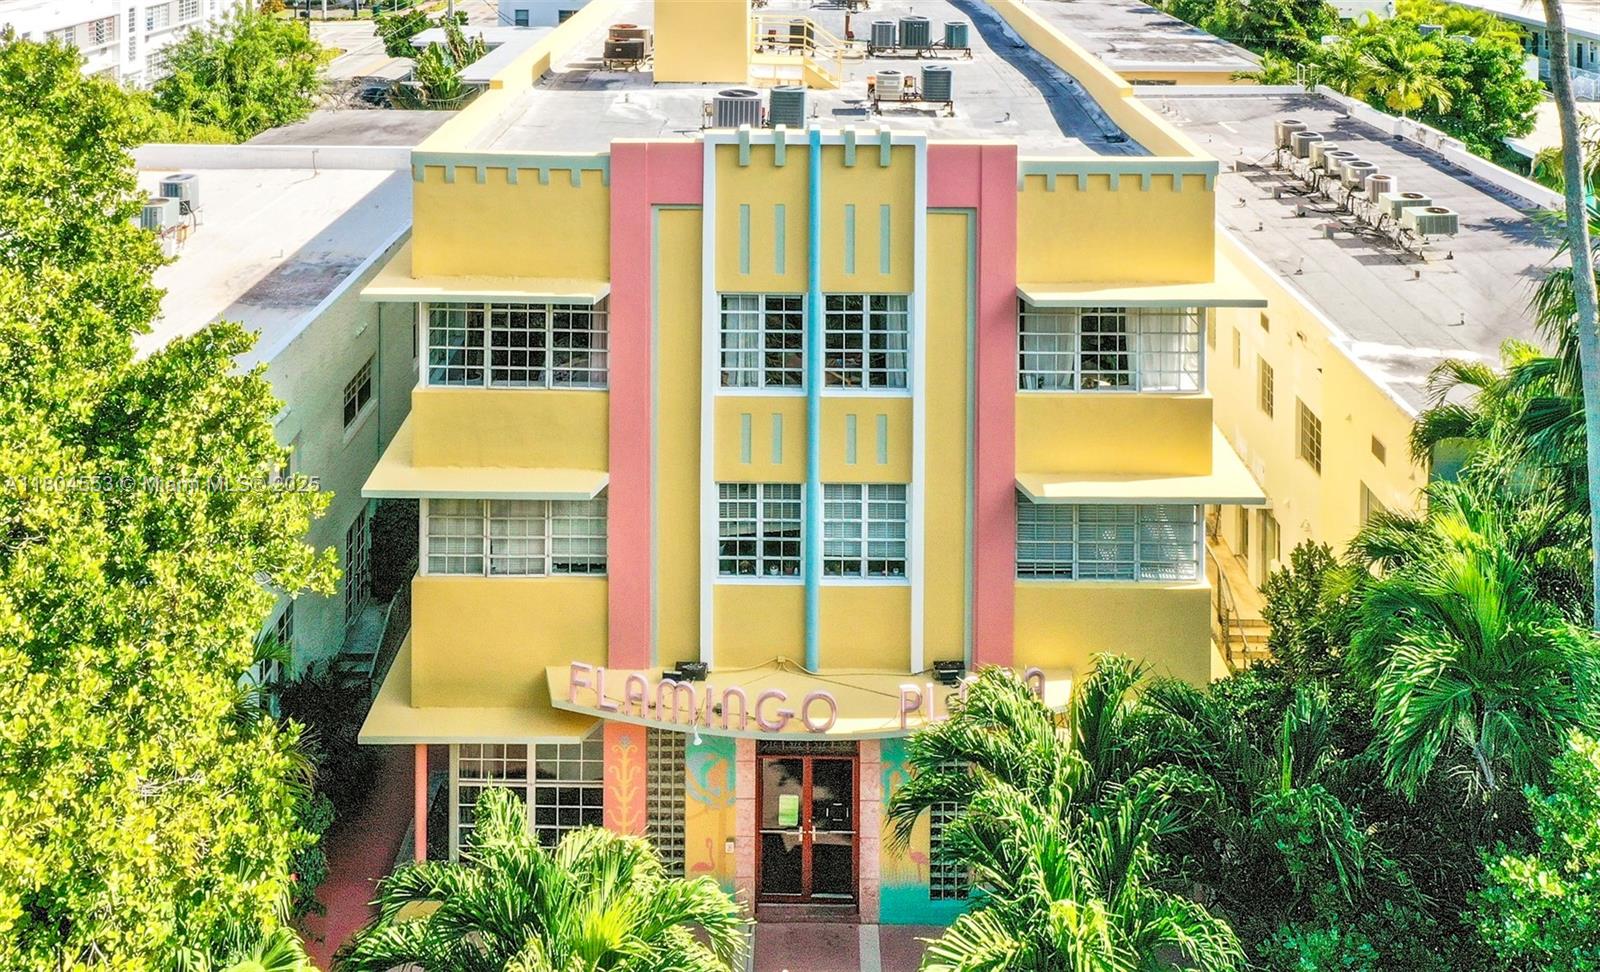
$285,000
1
bds
|
1
ba
|
460
sqft
|
built
1925
1618 Michigan Ave, Miami Beach, FL 33139
$-451
Cash flow
-8.3%
Cash-on-Cash Return
4.2%
Cap rate
0.9%
Rent to Value Ratio
Active
$265,000
1
bds
|
1
ba
|
540
sqft
|
built
1937
1051 Meridian Ave, Miami Beach, FL 33139
$-806
Cash flow
-15.9%
Cash-on-Cash Return
2.5%
Cap rate
0.8%
Rent to Value Ratio
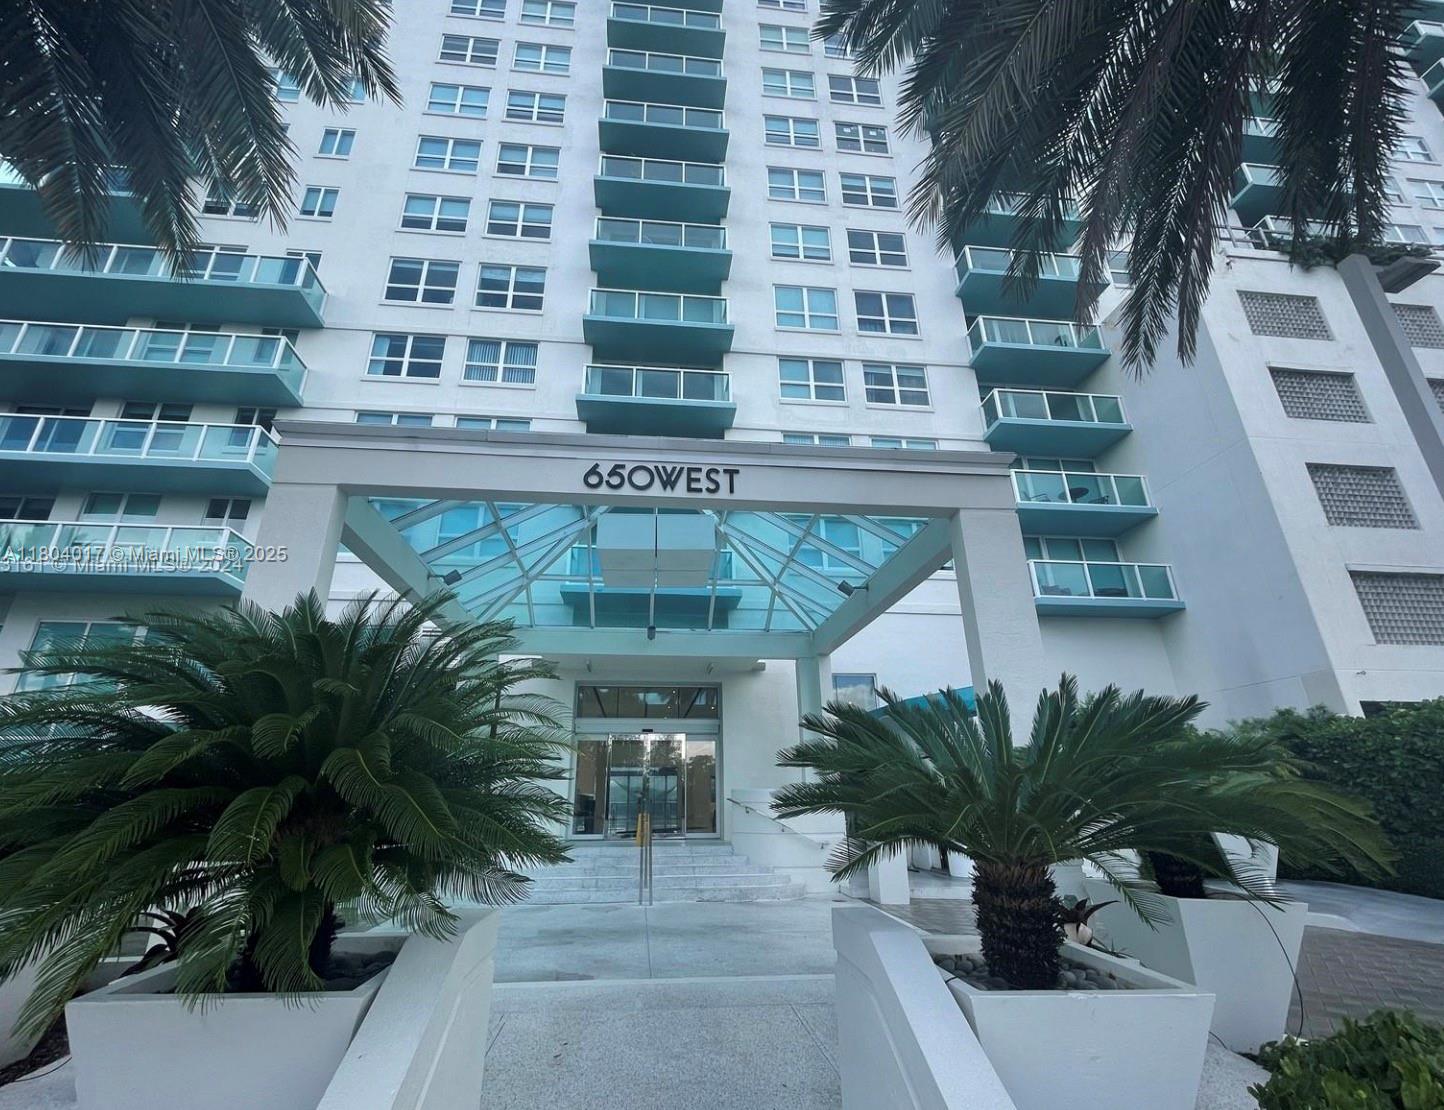
Active
$579,000
1
bds
|
1
ba
|
746
sqft
|
built
1997
650 West Ave, Miami Beach, FL 33139
$-2,527
Cash flow
-22.8%
Cash-on-Cash Return
0.9%
Cap rate
0.5%
Rent to Value Ratio
Active
$275,000
1
bds
|
1
ba
|
534
sqft
|
built
1976
1530 Pennsylvania Ave, Miami Beach, FL 33139
$-593
Cash flow
-11.3%
Cash-on-Cash Return
3.6%
Cap rate
0.7%
Rent to Value Ratio

Active
$474,000
1
bds
|
2
ba
|
750
sqft
|
built
1971
1228 West Ave, Miami Beach, FL 33139
$-1,446
Cash flow
-15.9%
Cash-on-Cash Return
2.5%
Cap rate
0.7%
Rent to Value Ratio
Active
$850,000
1
bds
|
1
ba
|
760
sqft
|
built
1926
2301 Collins Ave, Miami Beach, FL 33139
$-3,419
Cash flow
-21.0%
Cash-on-Cash Return
1.3%
Cap rate
0.5%
Rent to Value Ratio
Active
$375,000
2
bds
|
2
ba
|
1,044
sqft
|
built
1925
900 16th St, Miami Beach, FL 33139
$-1,564
Cash flow
-21.8%
Cash-on-Cash Return
1.1%
Cap rate
0.7%
Rent to Value Ratio

Active
$284,900
1
bds
|
1
ba
|
700
sqft
|
built
1965
1150 Euclid Ave, Miami Beach, FL 33139
$-734
Cash flow
-13.4%
Cash-on-Cash Return
3.1%
Cap rate
0.9%
Rent to Value Ratio
Active
$2,145,000
4
bds
|
4
ba
|
2,163
sqft
|
built
1998
1024 Lenox Ave, Miami Beach, FL 33139
$-7,129
Cash flow
-17.3%
Cash-on-Cash Return
2.2%
Cap rate
0.5%
Rent to Value Ratio
Active
$1,695,000
2
bds
|
2
ba
|
1,440
sqft
|
built
1981
9 Island Ave, Miami Beach, FL 33139
$-7,271
Cash flow
-22.4%
Cash-on-Cash Return
1.0%
Cap rate
0.4%
Rent to Value Ratio
Active
$2,275,000
3
bds
|
3
ba
|
2,008
sqft
|
built
1942
5120 Cherokee Ave, Miami Beach, FL 33140
$-8,380
Cash flow
-19.2%
Cash-on-Cash Return
1.7%
Cap rate
0.4%
Rent to Value Ratio

Active
$315,000
1
bds
|
1
ba
|
689
sqft
|
built
1966
949 Pennsylvania Ave, Miami Beach, FL 33139
$-934
Cash flow
-15.5%
Cash-on-Cash Return
2.6%
Cap rate
0.7%
Rent to Value Ratio

Active
$900,000
2
bds
|
2
ba
|
1,078
sqft
|
built
1997
650 West Ave, Miami Beach, FL 33139
$-4,009
Cash flow
-23.2%
Cash-on-Cash Return
0.8%
Cap rate
0.5%
Rent to Value Ratio
Active
$325,000
1
bds
|
1
ba
|
748
sqft
|
built
1970
947 Lenox Ave, Miami Beach, FL 33139
$-925
Cash flow
-14.8%
Cash-on-Cash Return
2.7%
Cap rate
0.8%
Rent to Value Ratio
Active
$219,900
0
bds
|
1
ba
|
446
sqft
|
built
1937
741 15th St, Miami Beach, FL 33139
$-547
Cash flow
-13.0%
Cash-on-Cash Return
3.2%
Cap rate
0.8%
Rent to Value Ratio

Active
$2,400,000
4
bds
|
5
ba
|
2,474
sqft
|
built
1946
3020 Alton Rd, Miami Beach, FL 33140
$-7,571
Cash flow
-16.5%
Cash-on-Cash Return
2.4%
Cap rate
0.4%
Rent to Value Ratio