Miami Beach, FL Investment Properties for Sale
Browse homes for sale and investment properties in Miami Beach, FL. Refine your search by price, property type, or more.
Best cash flowing properties in Miami Beach, FL
Active
$330,000
1
bds
|
1
ba
|
570
sqft
|
built
1967
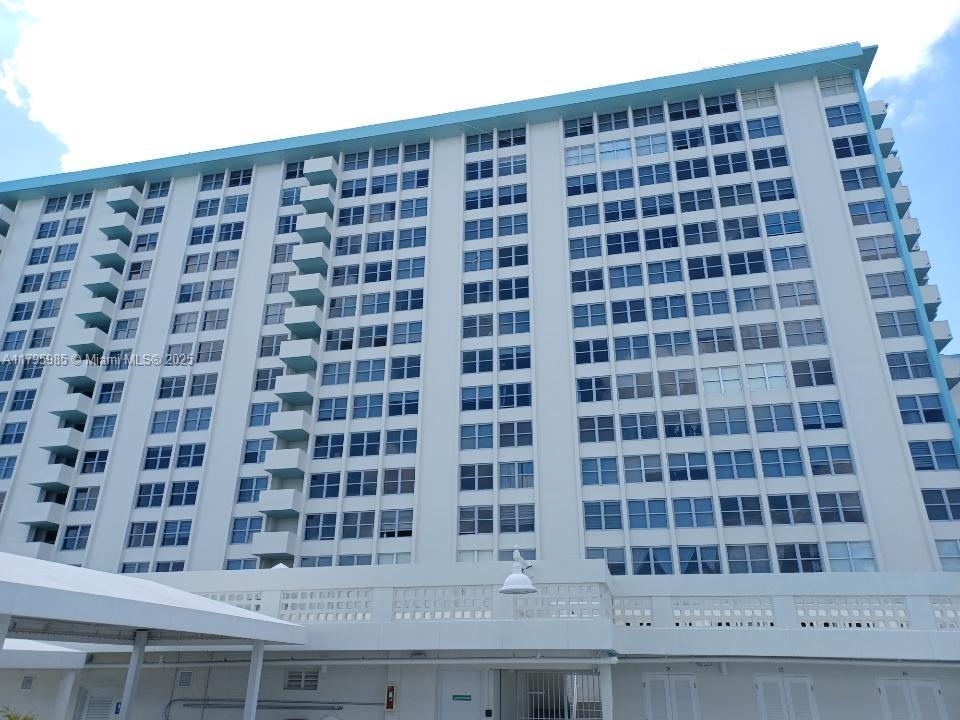
5401 Collins Ave, Miami Beach, FL 33140
$-54
Cash flow
-0.9%
Cash-on-Cash Return
5.9%
Cap rate
0.9%
Rent to Value Ratio
Active
$200,000
bds
|
1
ba
|
260
sqft
|
built
1941
255 W 24th St, Miami Beach, FL 33140
$-717
Cash flow
-18.7%
Cash-on-Cash Return
1.8%
Cap rate
1.0%
Rent to Value Ratio
1,968 out of 2,170 properties for sale in Miami Beach, FL
Limited Results Shown
Create a free account, or log in to reveal all property listings and enjoy the complete experience.
Active
$900,000
bds
|
1
ba
|
760
sqft
|
built
1926
2301 Collins Ave, Miami Beach, FL 33139
$-2,734
Cash flow
-15.8%
Cash-on-Cash Return
2.5%
Cap rate
0.7%
Rent to Value Ratio
Active
$375,000
1
bds
|
1
ba
|
726
sqft
|
built
1966
2899 Collins Ave, Miami Beach, FL 33140
$-854
Cash flow
-11.9%
Cash-on-Cash Return
3.4%
Cap rate
0.7%
Rent to Value Ratio
Active
$850,000
bds
|
1
ba
|
760
sqft
|
built
1926
2301 Collins Ave, Miami Beach, FL 33139
$-4,264
Cash flow
-26.2%
Cash-on-Cash Return
0.1%
Cap rate
0.4%
Rent to Value Ratio
Active
$330,000
1
bds
|
1
ba
|
570
sqft
|
built
1967
5401 Collins Ave, Miami Beach, FL 33140
$-54
Cash flow
-0.9%
Cash-on-Cash Return
5.9%
Cap rate
0.9%
Rent to Value Ratio
Active
$4,550,000
3
bds
|
4
ba
|
2,133
sqft
|
built
2019
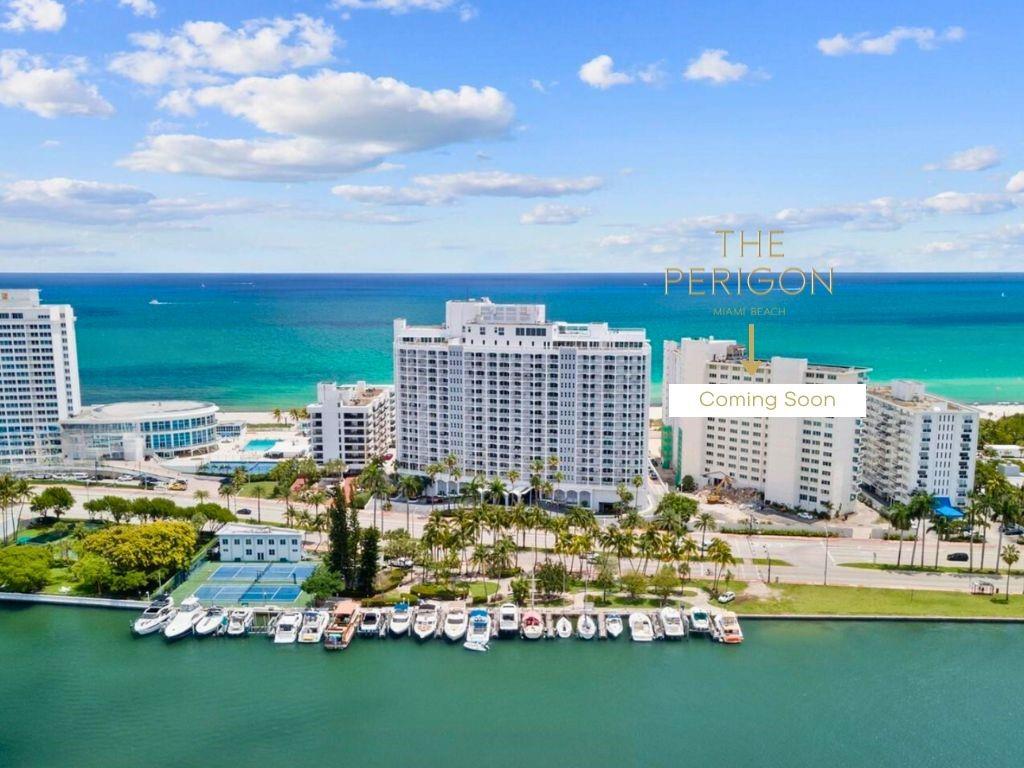
6901 Collins Ave, Miami Beach, FL 33141
$-29,971
Cash flow
-34.4%
Cash-on-Cash Return
-1.8%
Cap rate
0.2%
Rent to Value Ratio

Active
$835,000
1
bds
|
2
ba
|
805
sqft
|
built
2004
6515 Collins Ave, Miami Beach, FL 33141
$-2,070
Cash flow
-12.9%
Cash-on-Cash Return
3.2%
Cap rate
0.8%
Rent to Value Ratio

Active
$285,000
1
bds
|
1
ba
|
750
sqft
|
built
1970
716 Michigan Ave, Miami Beach, FL 33139
$-804
Cash flow
-14.7%
Cash-on-Cash Return
2.8%
Cap rate
0.9%
Rent to Value Ratio
Active
$4,399,900
4
bds
|
3
ba
|
2,618
sqft
|
built
1954
6100 Lagorce Dr, Miami Beach, FL 33140
$-20,314
Cash flow
-24.1%
Cash-on-Cash Return
0.6%
Cap rate
0.2%
Rent to Value Ratio
Active
$25,000,000
3
bds
|
3
ba
|
4,434
sqft
|
built
1952
250 W San Marino Dr, Miami Beach, FL 33139
$-153,153
Cash flow
-32.0%
Cash-on-Cash Return
-1.2%
Cap rate
0.0%
Rent to Value Ratio

Active
$380,000
1
bds
|
1
ba
|
515
sqft
|
built
1965
100 Lincoln Rd, Miami Beach, FL 33139
$-1,382
Cash flow
-19.0%
Cash-on-Cash Return
1.8%
Cap rate
0.7%
Rent to Value Ratio
Active
$4,995,000
7
bds
|
6
ba
|
4,821
sqft
|
built
1924
5812 Alton Rd, Miami Beach, FL 33140
$-23,273
Cash flow
-24.3%
Cash-on-Cash Return
0.6%
Cap rate
0.2%
Rent to Value Ratio

Active
$699,000
2
bds
|
2
ba
|
1,324
sqft
|
built
1972
11 Island Ave, Miami Beach, FL 33139
$-2,038
Cash flow
-15.2%
Cash-on-Cash Return
2.6%
Cap rate
0.9%
Rent to Value Ratio

Active
$1,875,000
3
bds
|
2
ba
|
1,886
sqft
|
built
1968
920 W 47th St, Miami Beach, FL 33140
$-7,037
Cash flow
-19.6%
Cash-on-Cash Return
1.6%
Cap rate
0.3%
Rent to Value Ratio
Active
$1,795,000
2
bds
|
2
ba
|
1,290
sqft
|
built
2008
6899 Collins Ave, Miami Beach, FL 33141
$-3,085
Cash flow
-9.0%
Cash-on-Cash Return
4.1%
Cap rate
0.6%
Rent to Value Ratio

Active
$389,000
1
bds
|
1
ba
|
410
sqft
|
built
1939
335 Ocean Dr, Miami Beach, FL 33139
$-1,465
Cash flow
-19.6%
Cash-on-Cash Return
1.6%
Cap rate
0.6%
Rent to Value Ratio

Pending
$1,999,000
4
bds
|
4
ba
|
2,162
sqft
|
built
1974
4101 Pine Tree Dr, Miami Beach, FL 33140
$-7,086
Cash flow
-18.5%
Cash-on-Cash Return
1.9%
Cap rate
0.3%
Rent to Value Ratio
Active
$925,000
2
bds
|
2
ba
|
1,700
sqft
|
built
2010
6000 Collins Ave, Miami Beach, FL 33140
$-2,527
Cash flow
-14.3%
Cash-on-Cash Return
2.9%
Cap rate
0.8%
Rent to Value Ratio

Active
$718,000
2
bds
|
2
ba
|
1,070
sqft
|
built
1995
1688 West Ave, Miami Beach, FL 33139
$-2,487
Cash flow
-18.1%
Cash-on-Cash Return
2.0%
Cap rate
0.6%
Rent to Value Ratio
Active
$245,000
1
bds
|
1
ba
|
678
sqft
|
built
1963
900 Bay Dr, Miami Beach, FL 33141
$-799
Cash flow
-17.0%
Cash-on-Cash Return
2.2%
Cap rate
0.9%
Rent to Value Ratio
Active
$539,000
1
bds
|
2
ba
|
797
sqft
|
built
1966
2899 Collins Ave, Miami Beach, FL 33140
$-1,882
Cash flow
-18.2%
Cash-on-Cash Return
2.0%
Cap rate
0.5%
Rent to Value Ratio

Active
$430,000
1
bds
|
1
ba
|
655
sqft
|
built
1970
401 Ocean Dr, Miami Beach, FL 33139
$-1,570
Cash flow
-19.0%
Cash-on-Cash Return
1.8%
Cap rate
0.7%
Rent to Value Ratio
Active
$870,000
2
bds
|
2
ba
|
1,088
sqft
|
built
2008
1100 West Ave, Miami Beach, FL 33139
$-959
Cash flow
-5.8%
Cash-on-Cash Return
4.8%
Cap rate
1.0%
Rent to Value Ratio

Active
$477,000
2
bds
|
2
ba
|
832
sqft
|
built
1981
1605 Pennsylvania Ave, Miami Beach, FL 33139
$-25,443
Cash flow
-278.3%
Cash-on-Cash Return
-57.9%
Cap rate
0.7%
Rent to Value Ratio
Active
$399,000
1
bds
|
1
ba
|
662
sqft
|
built
1970
345 Ocean Dr, Miami Beach, FL 33139
$-1,299
Cash flow
-17.0%
Cash-on-Cash Return
2.2%
Cap rate
0.8%
Rent to Value Ratio
Active
$615,000
1
bds
|
1
ba
|
717
sqft
|
built
2008
6801 Collins Ave, Miami Beach, FL 33141
$-2,333
Cash flow
-19.8%
Cash-on-Cash Return
1.6%
Cap rate
0.6%
Rent to Value Ratio
Active
$475,000
1
bds
|
1
ba
|
662
sqft
|
built
2008
6801 Collins Ave, Miami Beach, FL 33141
$-3,395
Cash flow
-37.3%
Cash-on-Cash Return
-2.4%
Cap rate
0.8%
Rent to Value Ratio

Active
$1,349,000
1
bds
|
1
ba
|
1,066
sqft
|
built
2005
4401 Collins Ave, Miami Beach, FL 33140
$-5,630
Cash flow
-21.8%
Cash-on-Cash Return
1.1%
Cap rate
0.5%
Rent to Value Ratio
Active
$849,000
2
bds
|
2
ba
|
1,190
sqft
|
built
1965
100 Lincoln Rd, Miami Beach, FL 33139
$-1,851
Cash flow
-11.4%
Cash-on-Cash Return
3.5%
Cap rate
0.5%
Rent to Value Ratio
Active
$1,190,000
3
bds
|
4
ba
|
2,950
sqft
|
built
1970
5660 Collins Ave, Miami Beach, FL 33140
$-4,995
Cash flow
-21.9%
Cash-on-Cash Return
1.1%
Cap rate
0.7%
Rent to Value Ratio
Active
$1,349,000
3
bds
|
2
ba
|
1,477
sqft
|
built
1981
9 Island Ave, Miami Beach, FL 33139
$-5,296
Cash flow
-20.5%
Cash-on-Cash Return
1.4%
Cap rate
0.5%
Rent to Value Ratio
Active
$3,750,000
1
bds
|
2
ba
|
1,365
sqft
|
built
2002
100 S Pointe Dr, Miami Beach, FL 33139
$-18,929
Cash flow
-26.3%
Cash-on-Cash Return
0.1%
Cap rate
0.3%
Rent to Value Ratio
Active
$200,000
bds
|
1
ba
|
260
sqft
|
built
1941
255 W 24th St, Miami Beach, FL 33140
$-717
Cash flow
-18.7%
Cash-on-Cash Return
1.8%
Cap rate
1.0%
Rent to Value Ratio
Active
$992,000
3
bds
|
3
ba
|
1,440
sqft
|
built
2004
5970 Indian Creek Dr, Miami Beach, FL 33140
$-4,188
Cash flow
-22.0%
Cash-on-Cash Return
1.1%
Cap rate
0.5%
Rent to Value Ratio
Active
$1,925,000
3
bds
|
3
ba
|
1,485
sqft
|
built
1999
125 Jefferson Ave, Miami Beach, FL 33139
$-5,122
Cash flow
-13.9%
Cash-on-Cash Return
3.0%
Cap rate
0.5%
Rent to Value Ratio

Active
$23,500,000
5
bds
|
6
ba
|
7,025
sqft
|
built
2007
7143 Fisher Island Dr, Miami Beach, FL 33109
$-133,344
Cash flow
-29.6%
Cash-on-Cash Return
-0.7%
Cap rate
0.0%
Rent to Value Ratio
Active
$475,000
1
bds
|
1
ba
|
662
sqft
|
built
2008
6801 Collins Ave, Miami Beach, FL 33141
$-4,013
Cash flow
-44.1%
Cash-on-Cash Return
-4.0%
Cap rate
0.7%
Rent to Value Ratio
Active
$3,450,000
2
bds
|
3
ba
|
2,163
sqft
|
built
2004
6365 Collins Ave, Miami Beach, FL 33141
$-17,102
Cash flow
-25.9%
Cash-on-Cash Return
0.2%
Cap rate
0.2%
Rent to Value Ratio

Active
$4,200,000
3
bds
|
3
ba
|
2,008
sqft
|
built
2002
1000 S Pointe Dr, Miami Beach, FL 33139
$-22,774
Cash flow
-28.3%
Cash-on-Cash Return
-0.4%
Cap rate
0.2%
Rent to Value Ratio

Active
$1,425,000
2
bds
|
2
ba
|
1,181
sqft
|
built
2008
6801 Collins Ave, Miami Beach, FL 33141
$-7,586
Cash flow
-27.8%
Cash-on-Cash Return
-0.2%
Cap rate
0.5%
Rent to Value Ratio
Active
$485,000
2
bds
|
2
ba
|
1,030
sqft
|
built
1968
5700 Collins Ave, Miami Beach, FL 33140
$-2,327
Cash flow
-25.0%
Cash-on-Cash Return
0.4%
Cap rate
0.6%
Rent to Value Ratio