Miami, FL Investment Properties for Sale
Browse homes for sale and investment properties in Miami, FL. Refine your search by price, property type, or more.
Best cash flowing properties in Miami, FL
Active
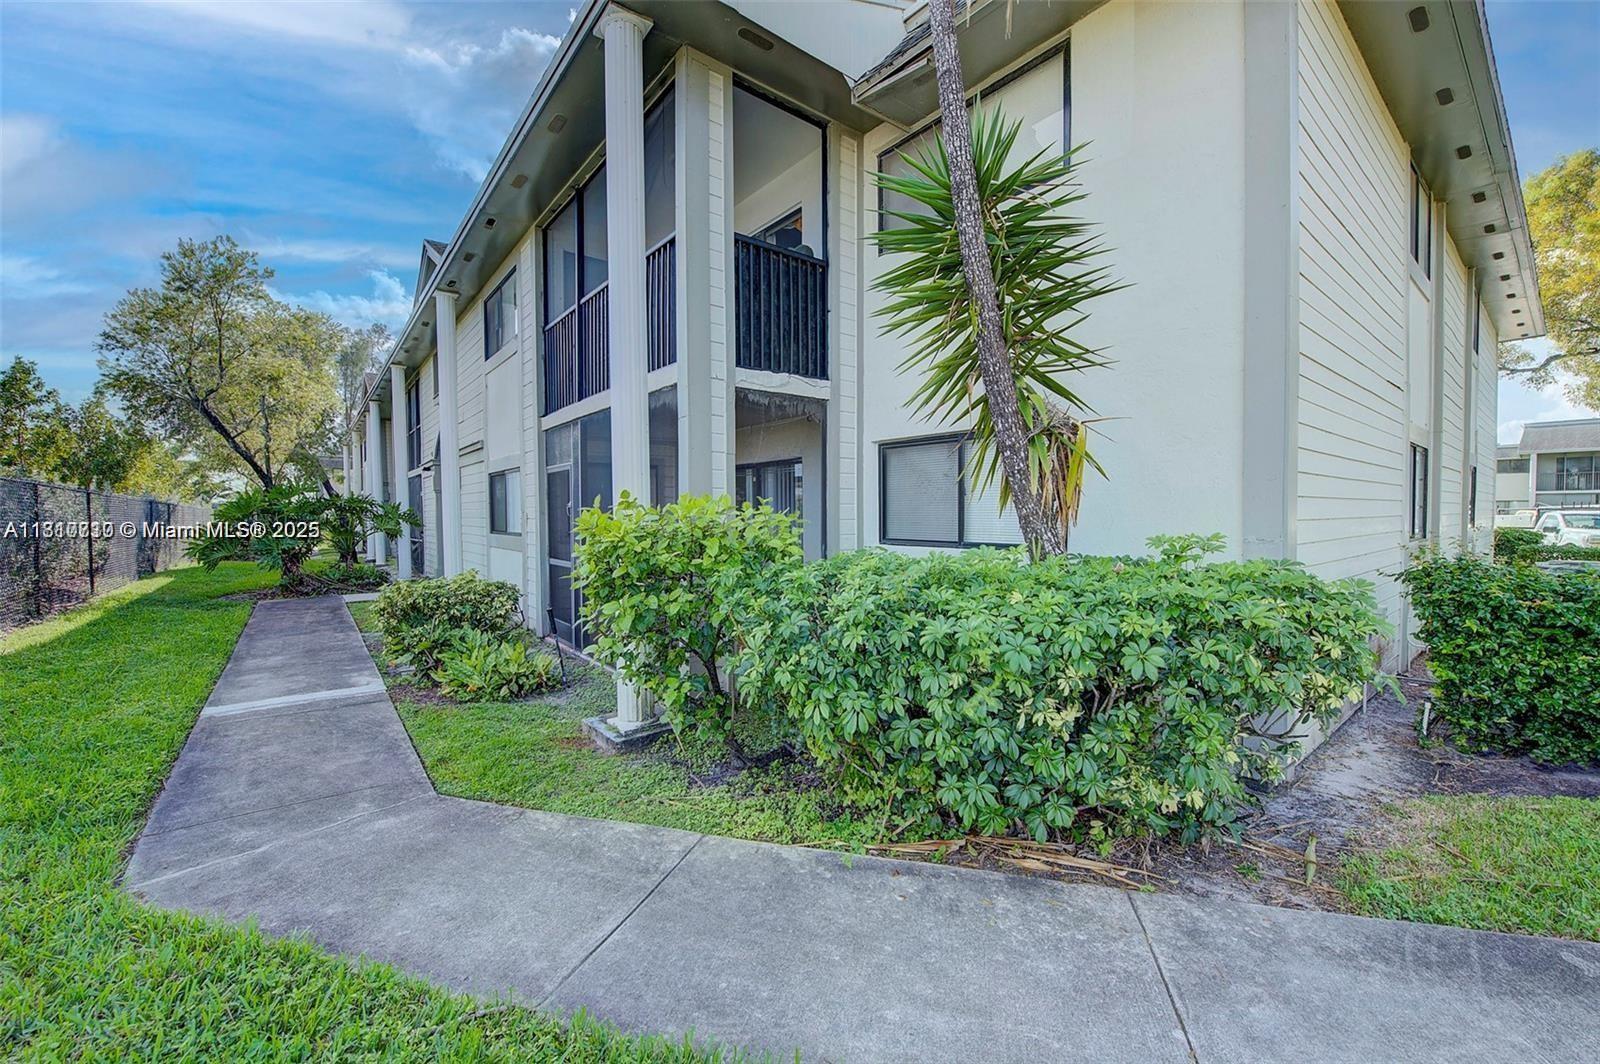
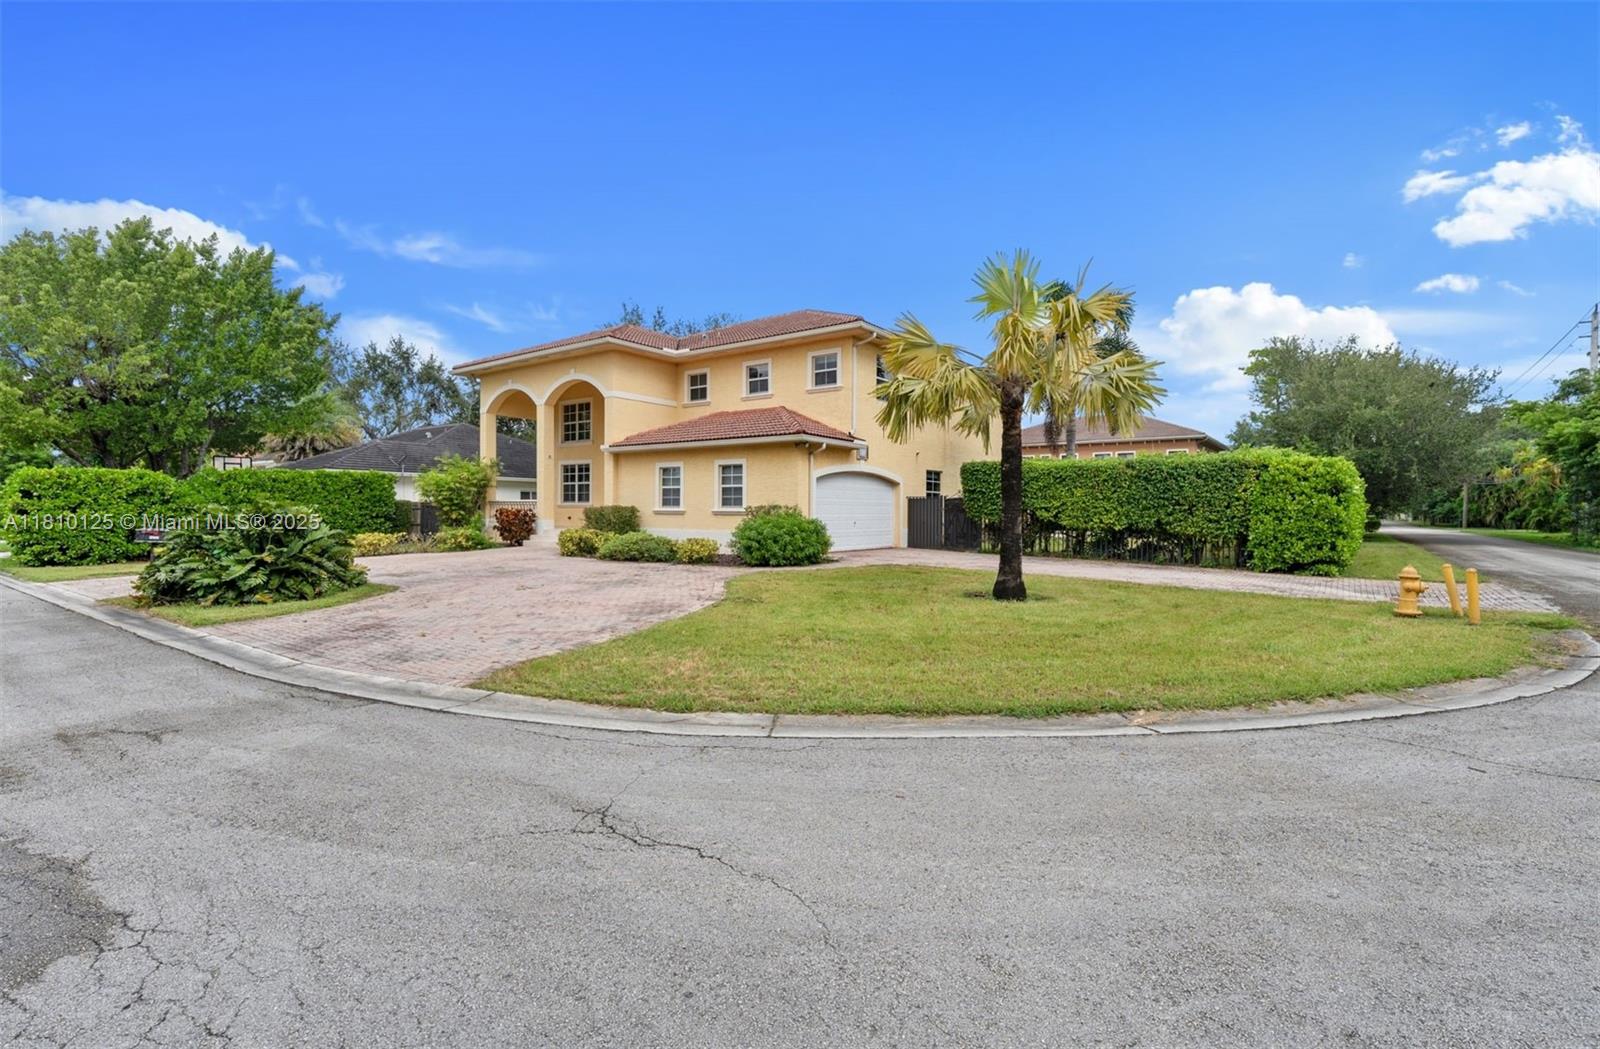
$229,000
2
bds
|
2
ba
|
1,065
sqft
|
built
1991
20760 NE 4th Ct, Miami, FL 33179
$-223
Cash flow
-5.1%
Cash-on-Cash Return
5.0%
Cap rate
1.1%
Rent to Value Ratio
Active
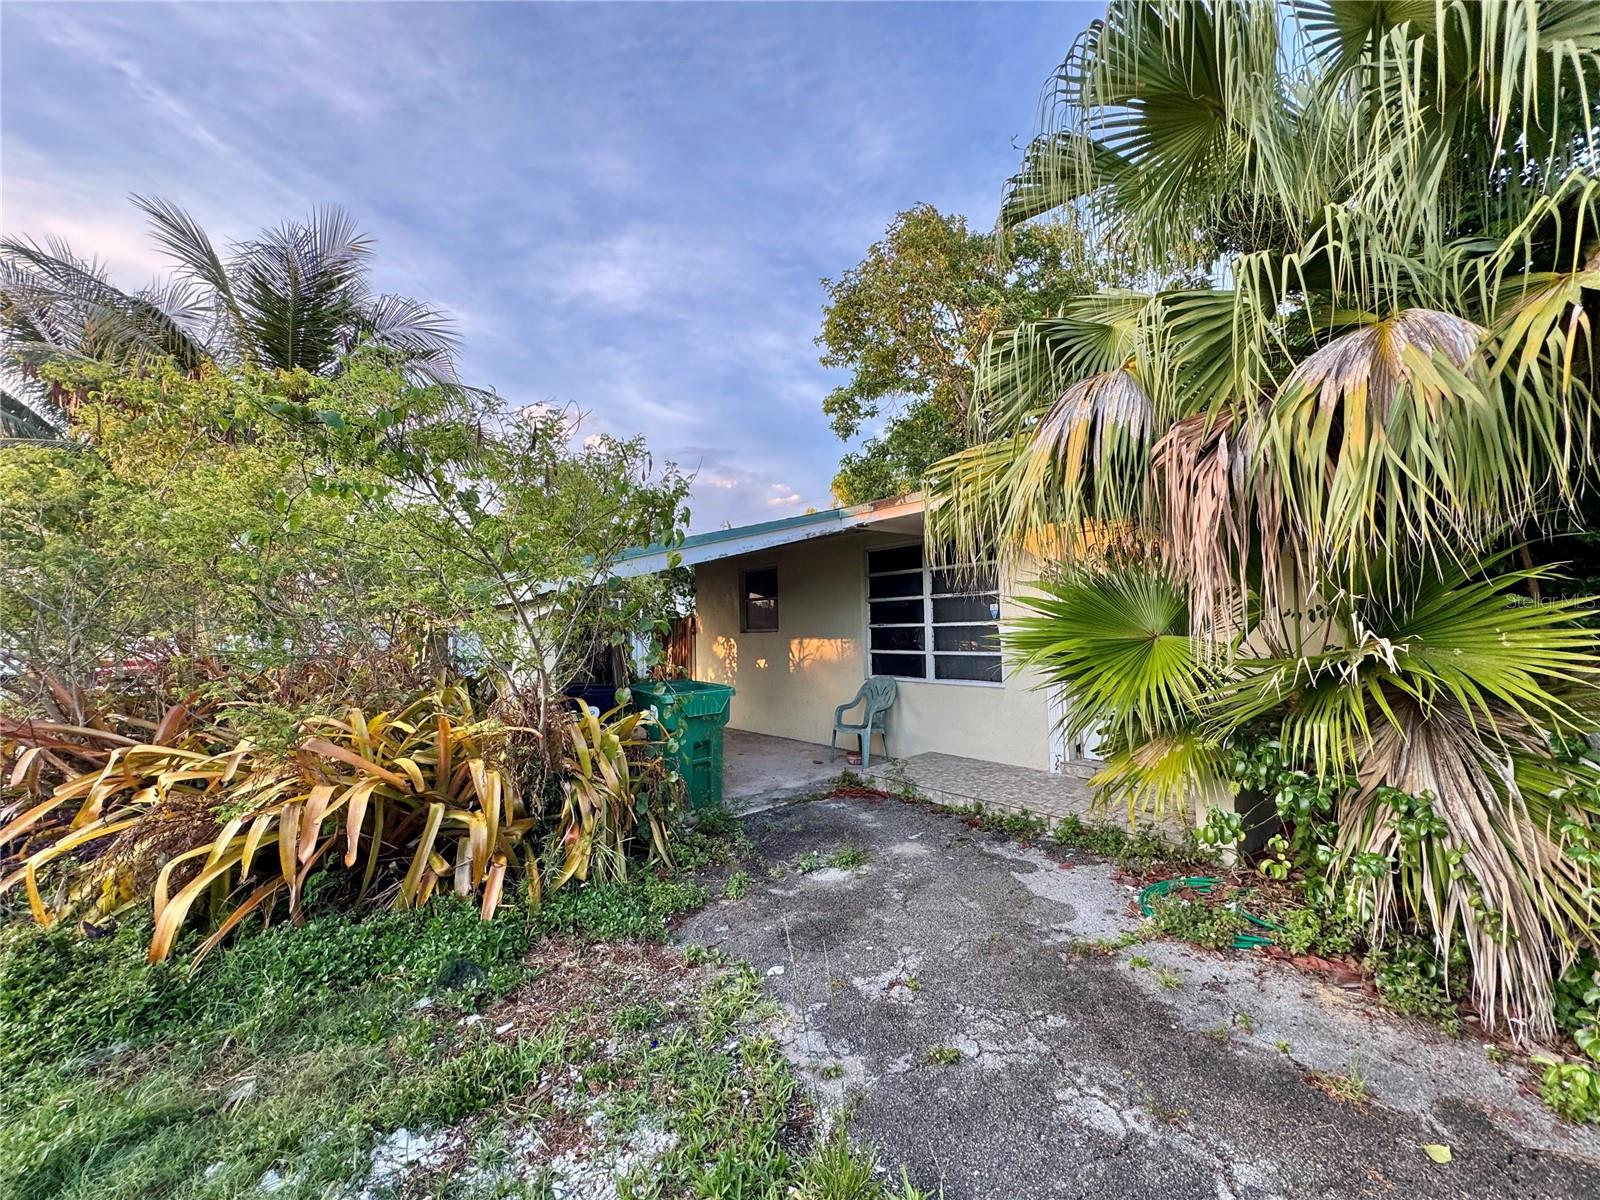
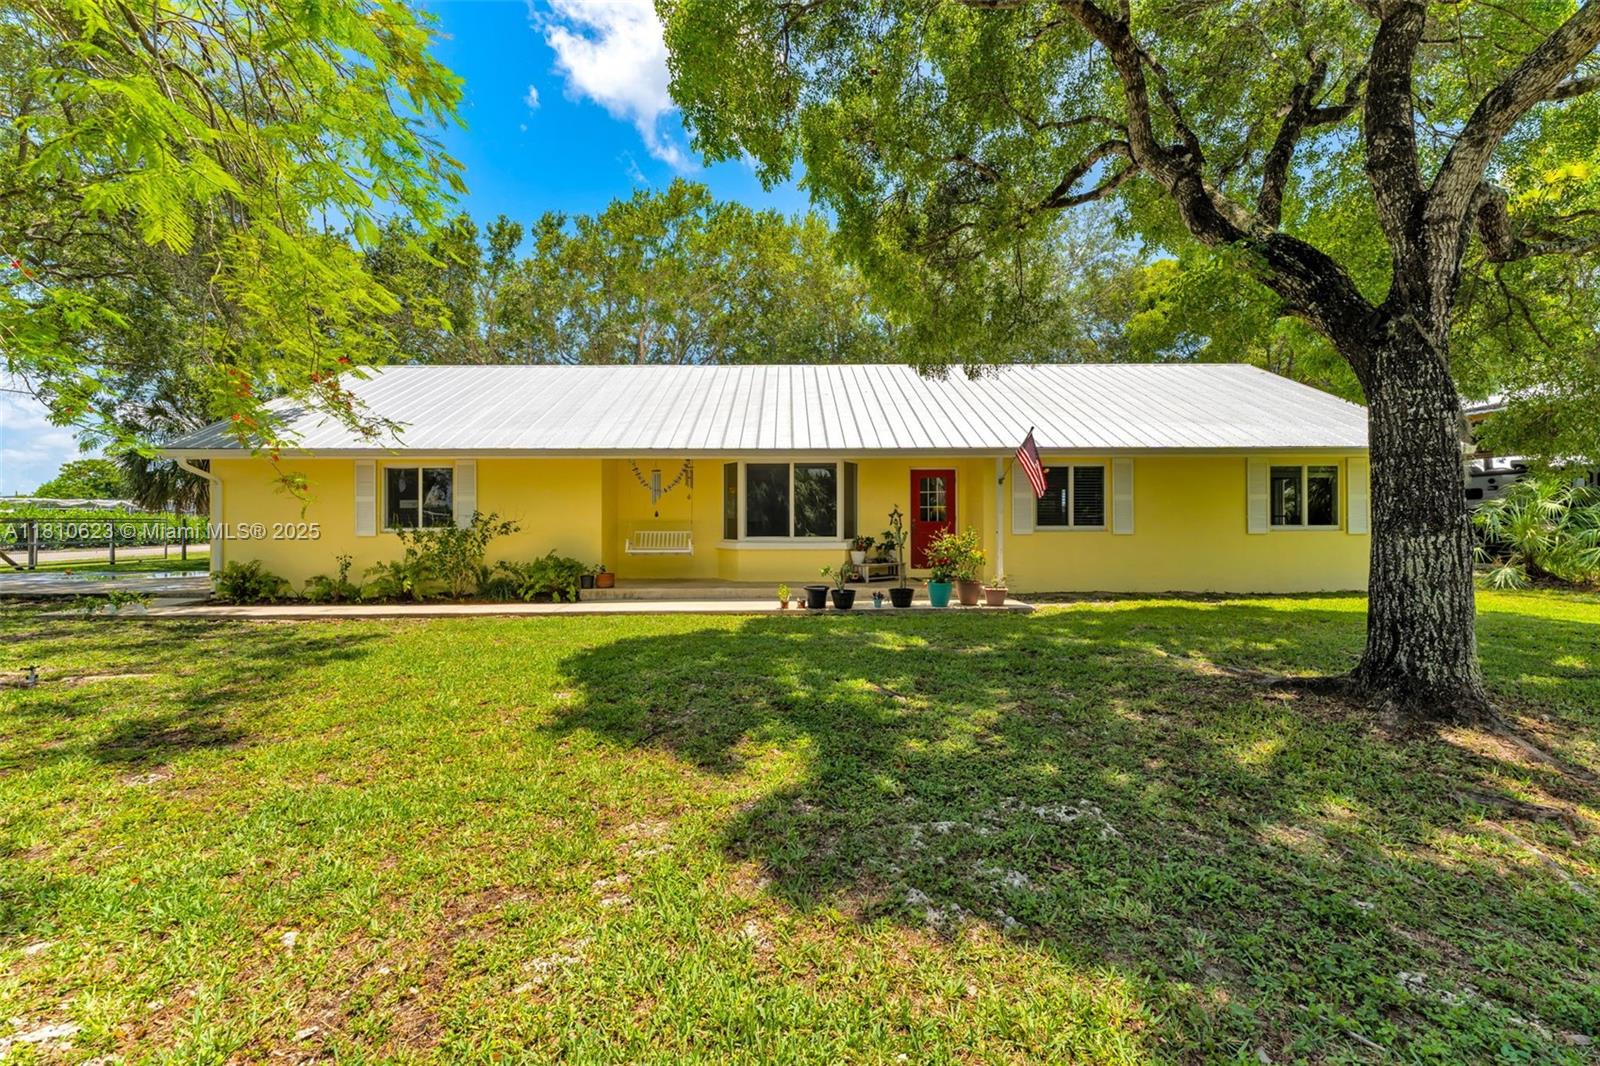
$499,999
4
bds
|
3
ba
|
2,234
sqft
|
built
1961
17781 SW 113th Ave, Miami, FL 33157
$-266
Cash flow
-2.8%
Cash-on-Cash Return
5.5%
Cap rate
0.7%
Rent to Value Ratio
6,367 out of 7,220 properties for sale in Miami, FL
Limited Results Shown
Create a free account, or log in to reveal all property listings and enjoy the complete experience.
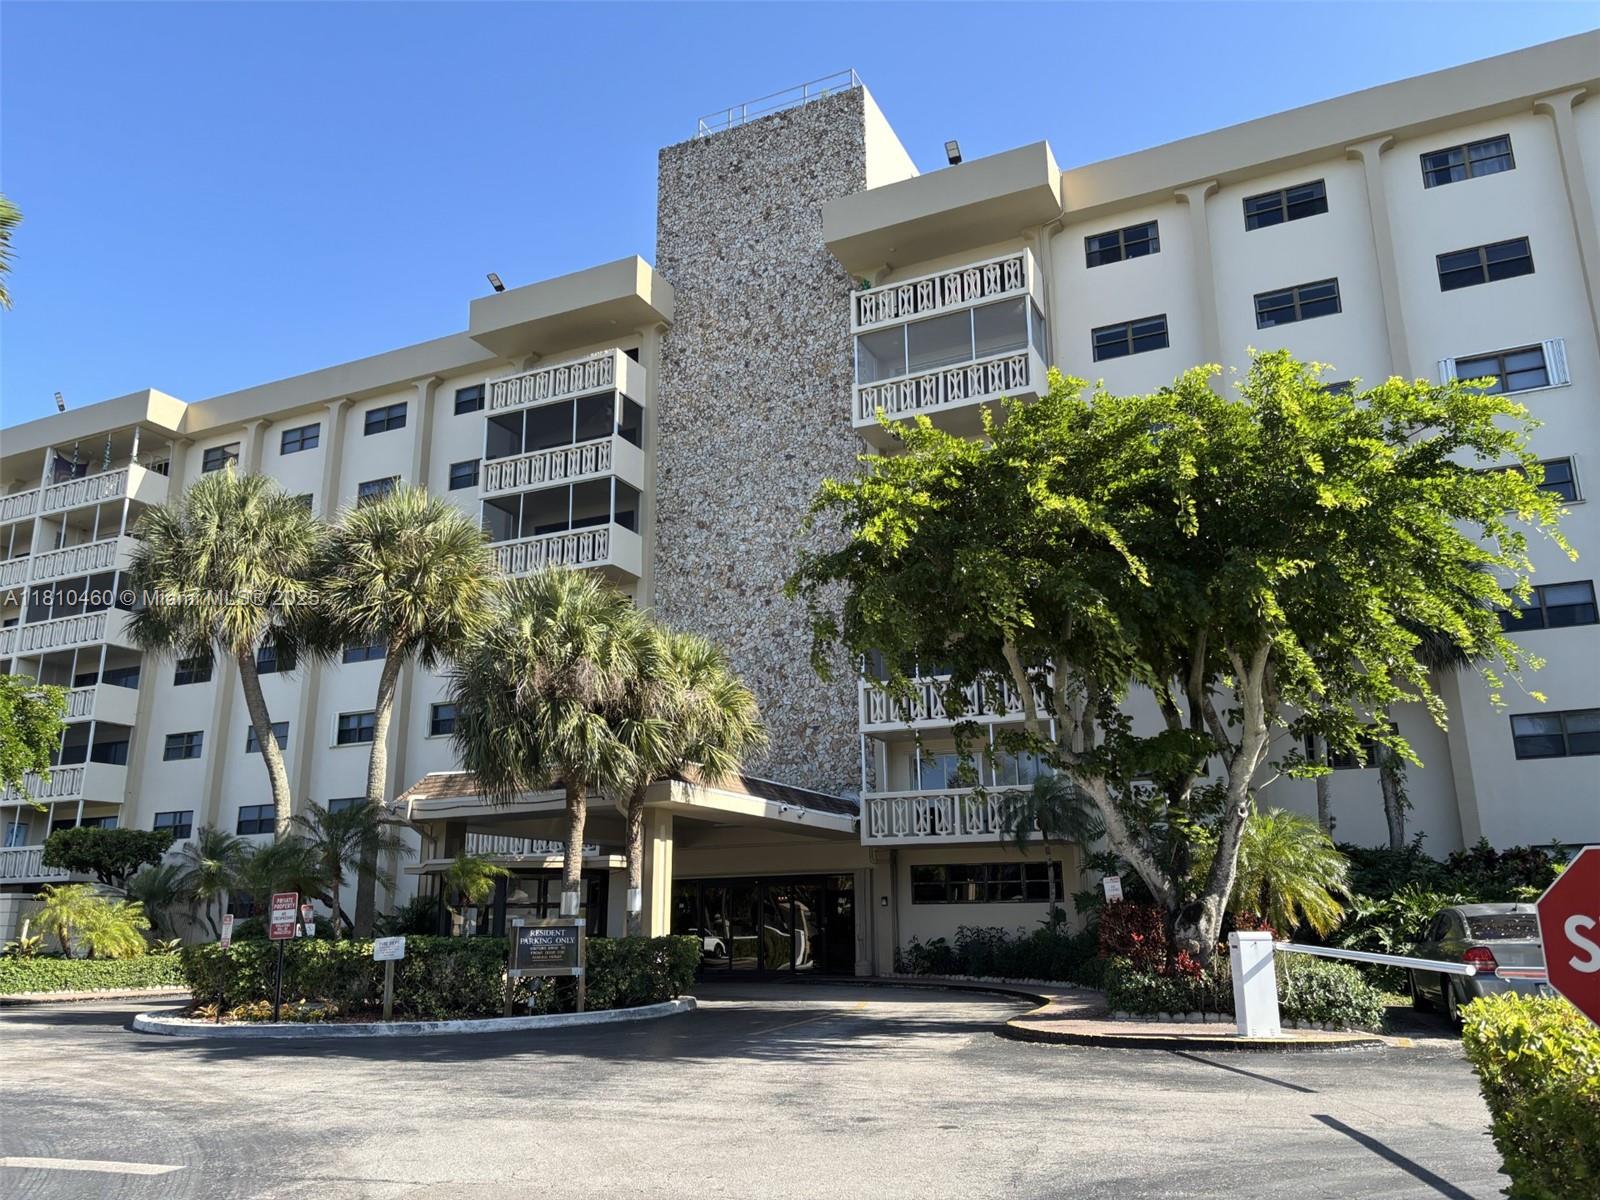
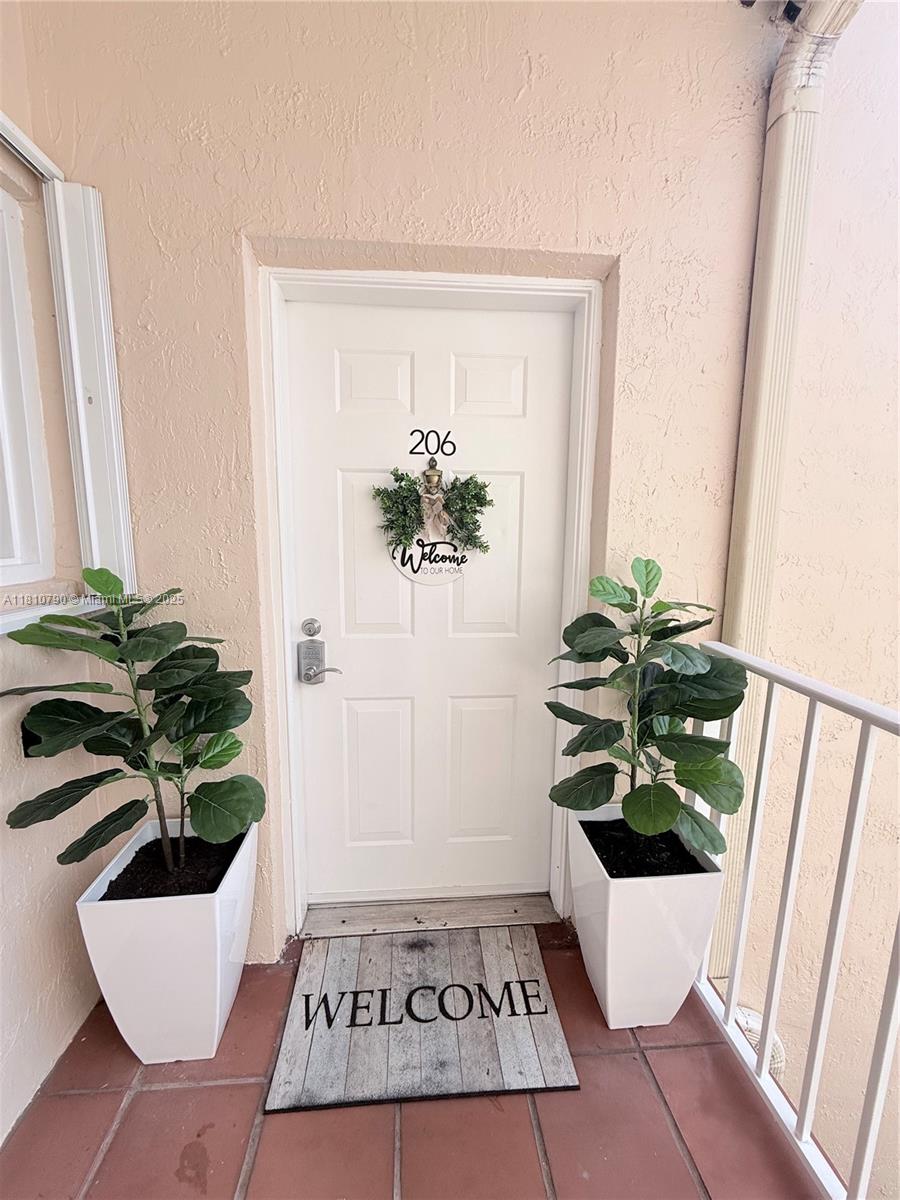
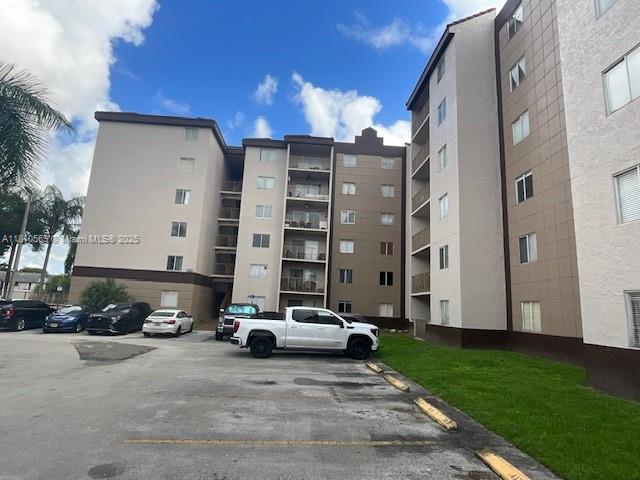
Active
$228,000
2
bds
|
2
ba
|
1,470
sqft
|
built
1969
800 NE 195th St, Miami, FL 33179
$-500
Cash flow
-11.4%
Cash-on-Cash Return
3.5%
Cap rate
1.1%
Rent to Value Ratio
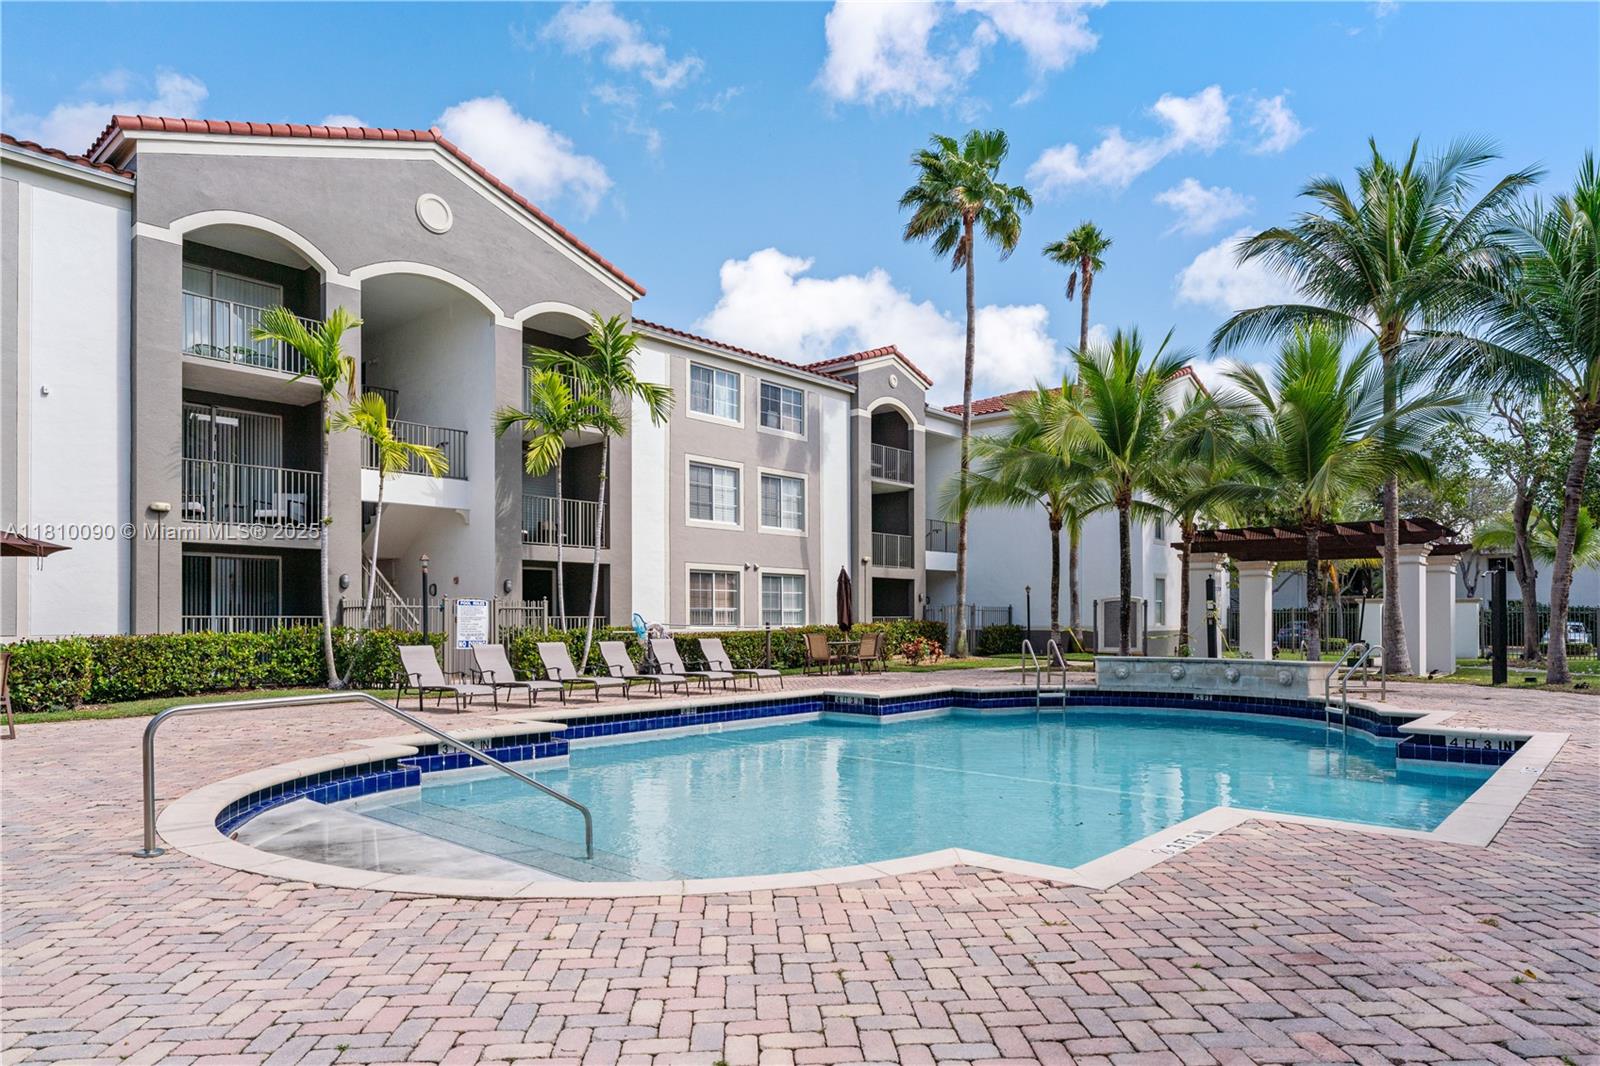
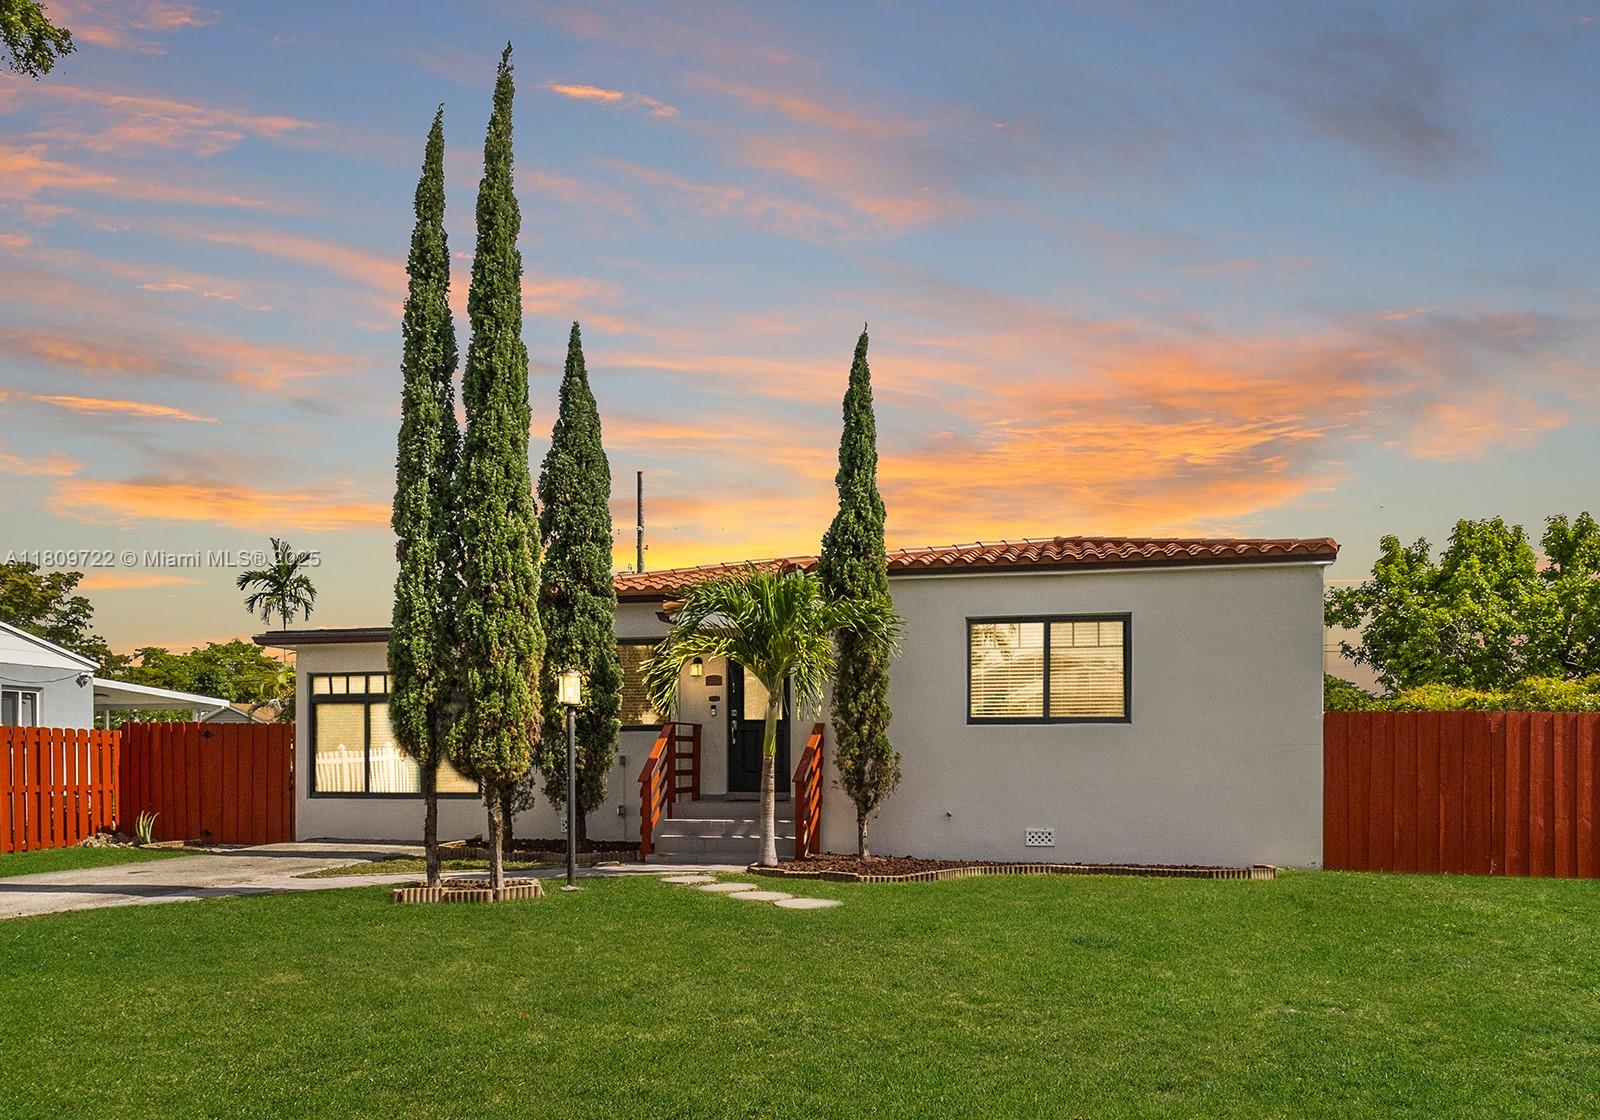
Active
$410,000
2
bds
|
2
ba
|
989
sqft
|
built
2006
6851 SW 44th St, Miami, FL 33155
$-1,179
Cash flow
-15.0%
Cash-on-Cash Return
2.7%
Cap rate
0.7%
Rent to Value Ratio
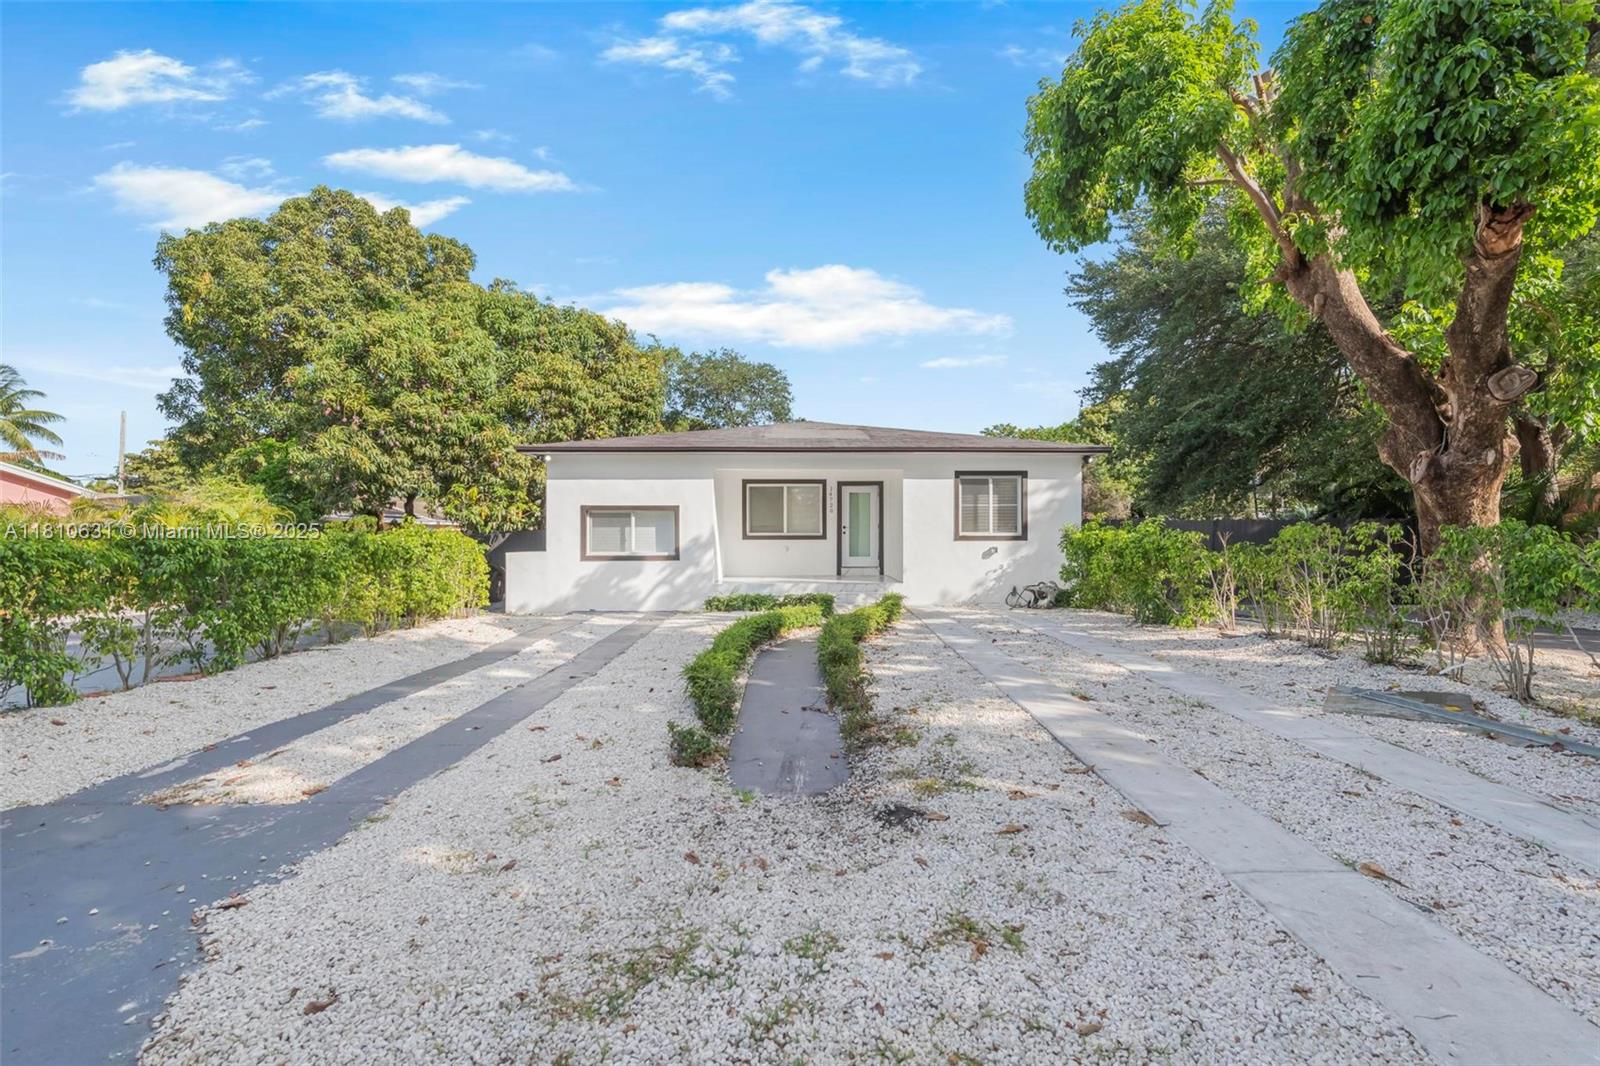
Active
$599,500
3
bds
|
2
ba
|
1,355
sqft
|
built
1949
14720 NW 15th Dr, Miami, FL 33167
$-942
Cash flow
-8.2%
Cash-on-Cash Return
4.3%
Cap rate
0.7%
Rent to Value Ratio
Active
$749,000
4
bds
|
2
ba
|
1,908
sqft
|
built
1966
3202 SW 3rd St, Miami, FL 33135
$-2,245
Cash flow
-15.6%
Cash-on-Cash Return
2.6%
Cap rate
0.5%
Rent to Value Ratio
Active
$555,000
3
bds
|
2
ba
|
1,195
sqft
|
built
2017
20390 SW 119th Ave, Miami, FL 33177
$-934
Cash flow
-8.8%
Cash-on-Cash Return
4.1%
Cap rate
0.6%
Rent to Value Ratio

Active
$850,000
4
bds
|
3
ba
|
2,744
sqft
|
built
1976
13463 SW 66th Ter, Miami, FL 33183
$-2,010
Cash flow
-12.3%
Cash-on-Cash Return
3.3%
Cap rate
0.5%
Rent to Value Ratio
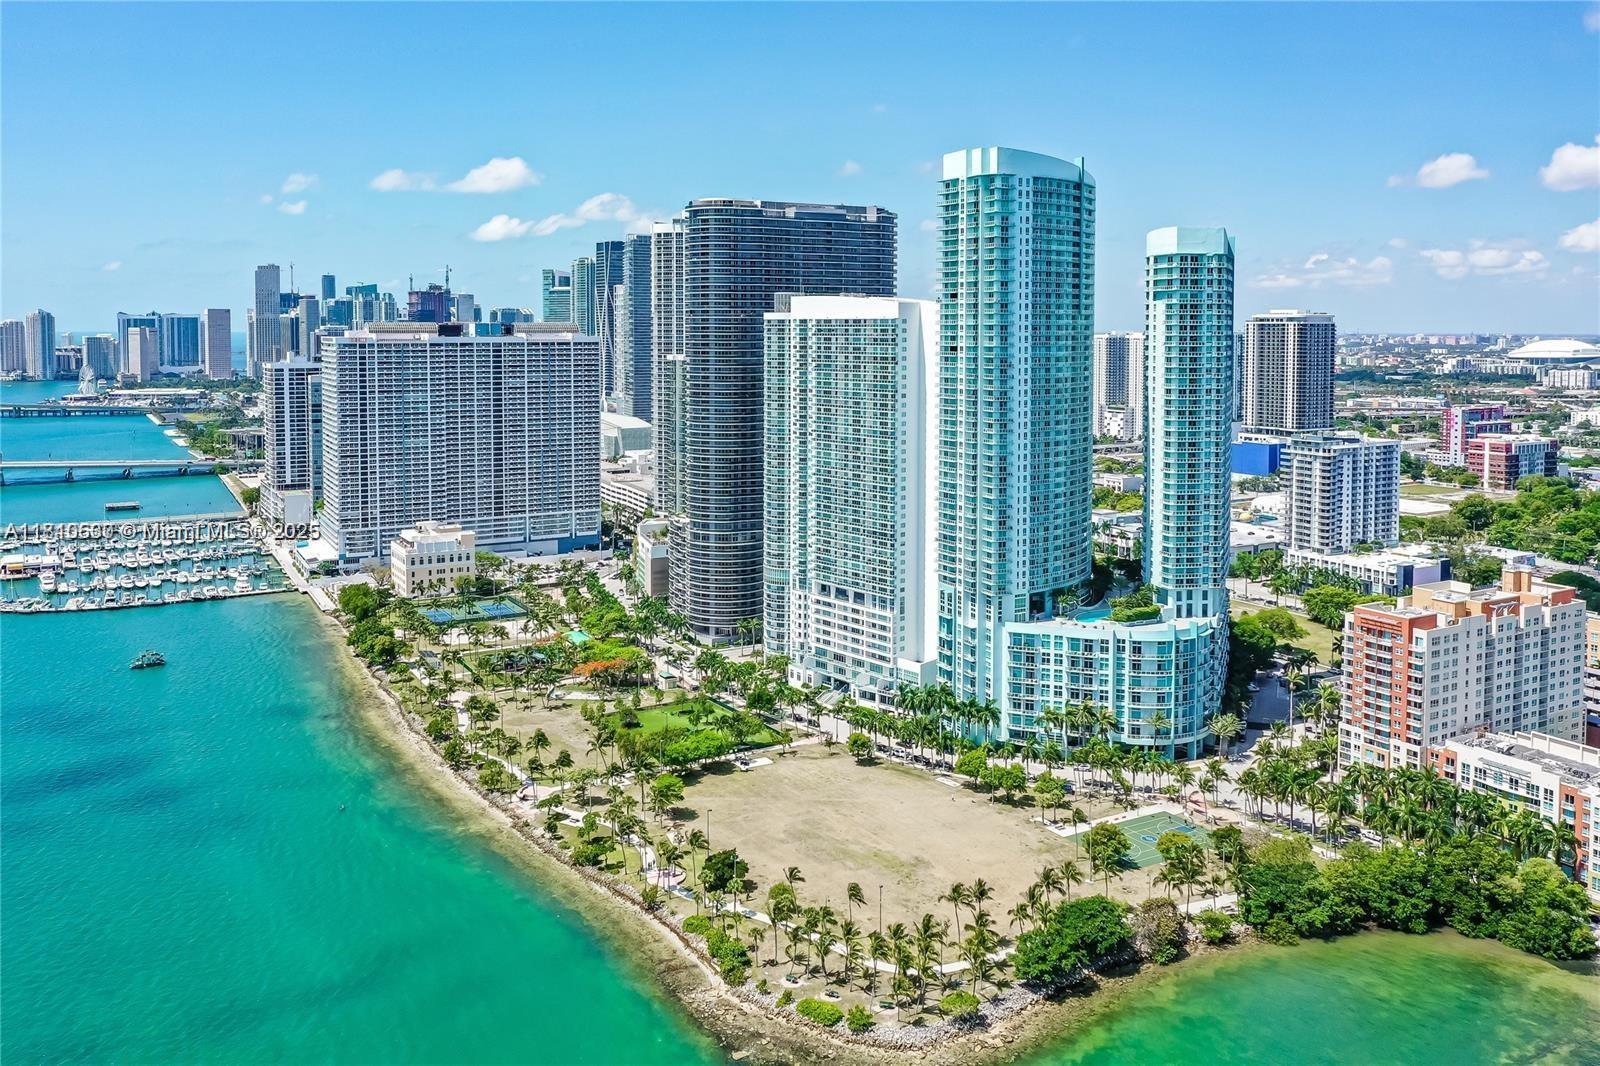
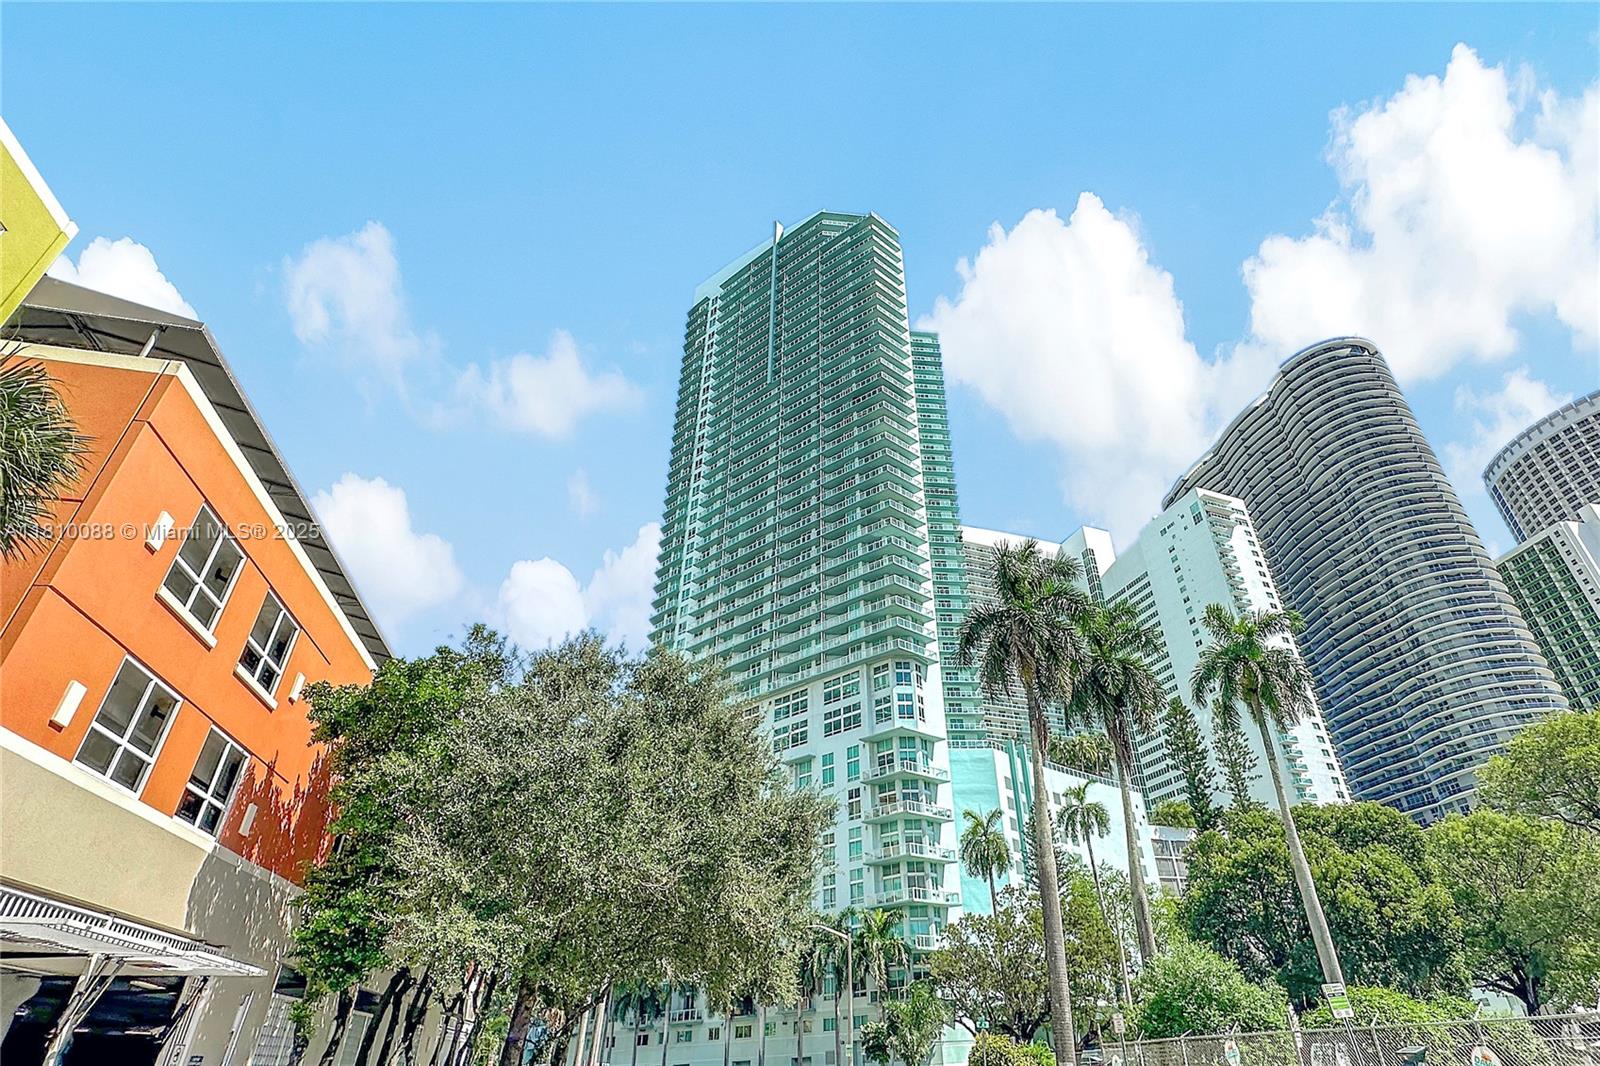
Active
$418,000
1
bds
|
2
ba
|
799
sqft
|
built
2008
1900 N Bayshore Dr, Miami, FL 33132
$-1,471
Cash flow
-18.4%
Cash-on-Cash Return
1.9%
Cap rate
0.7%
Rent to Value Ratio
Active
$575,000
3
bds
|
2
ba
|
1,209
sqft
|
built
1992
1360 NW 59th St, Miami, FL 33142
$-1,279
Cash flow
-11.6%
Cash-on-Cash Return
3.5%
Cap rate
0.5%
Rent to Value Ratio
Active
$229,000
2
bds
|
2
ba
|
1,065
sqft
|
built
1991
20760 NE 4th Ct, Miami, FL 33179
$-223
Cash flow
-5.1%
Cash-on-Cash Return
5.0%
Cap rate
1.1%
Rent to Value Ratio
Active
$789,000
2
bds
|
2
ba
|
986
sqft
|
built
2008
950 Brickell Bay Dr, Miami, FL 33131
$-2,239
Cash flow
-14.8%
Cash-on-Cash Return
2.7%
Cap rate
0.6%
Rent to Value Ratio
Active
$1,675,000
3
bds
|
4
ba
|
1,856
sqft
|
built
2016
68 SE 6th St, Miami, FL 33131
$-6,537
Cash flow
-20.4%
Cash-on-Cash Return
1.5%
Cap rate
0.5%
Rent to Value Ratio
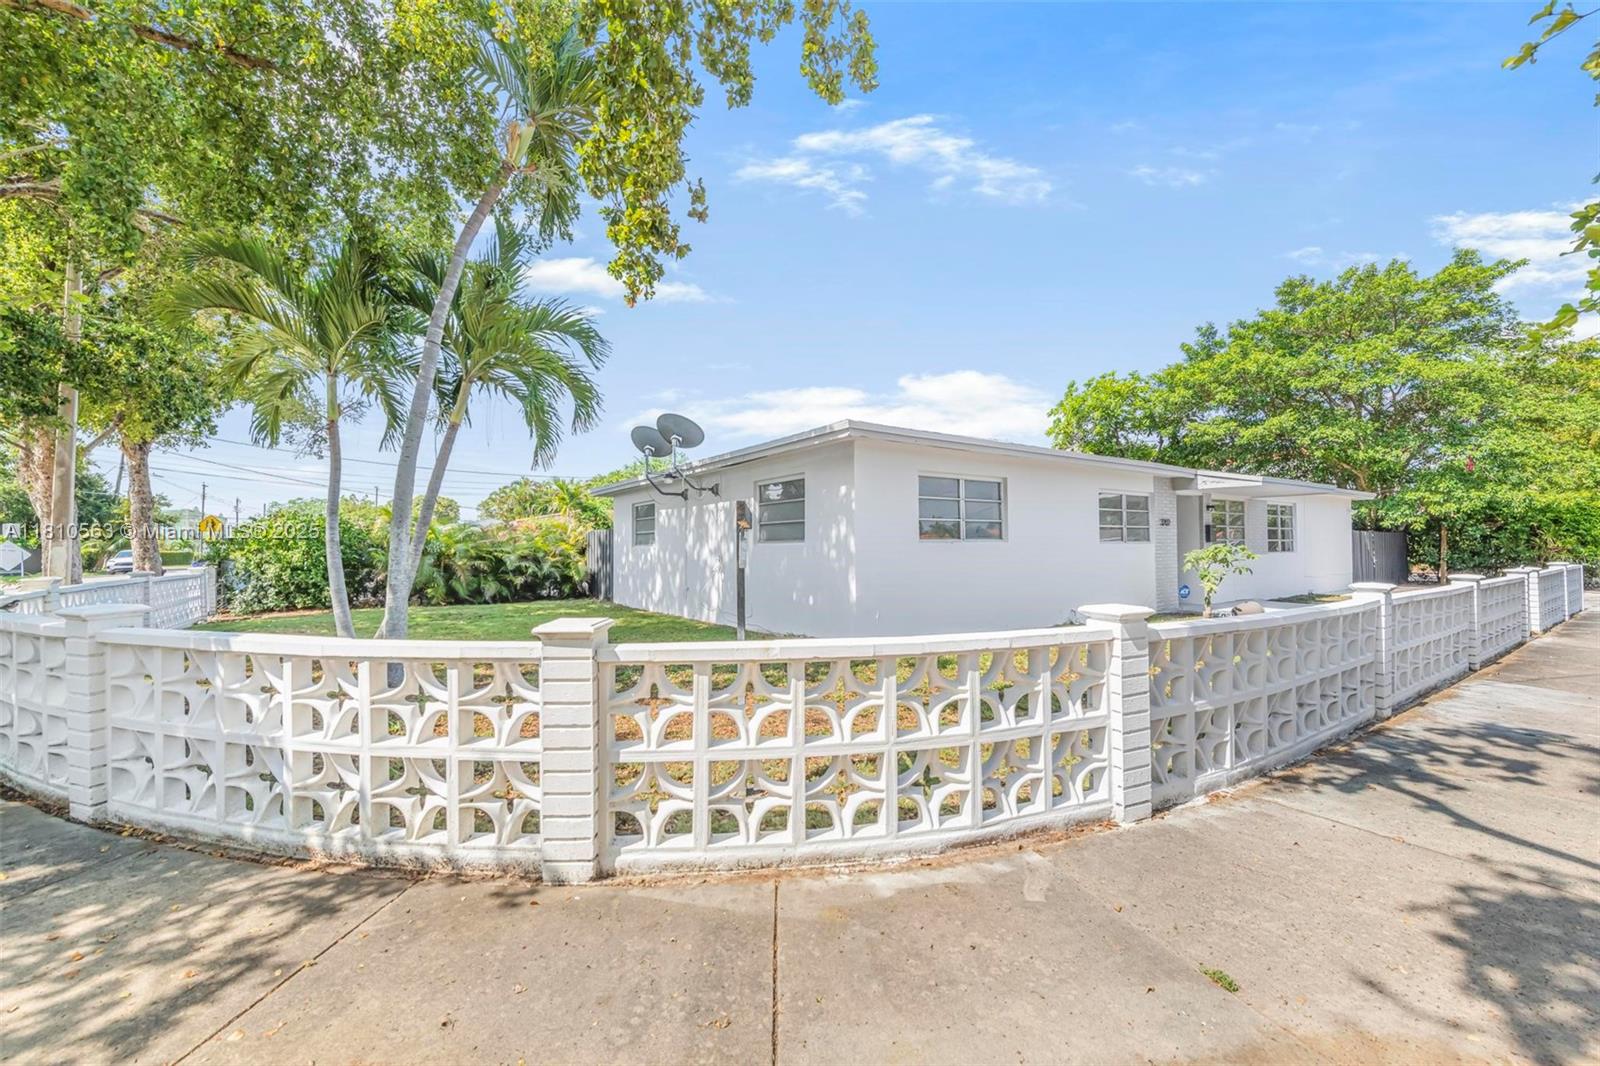
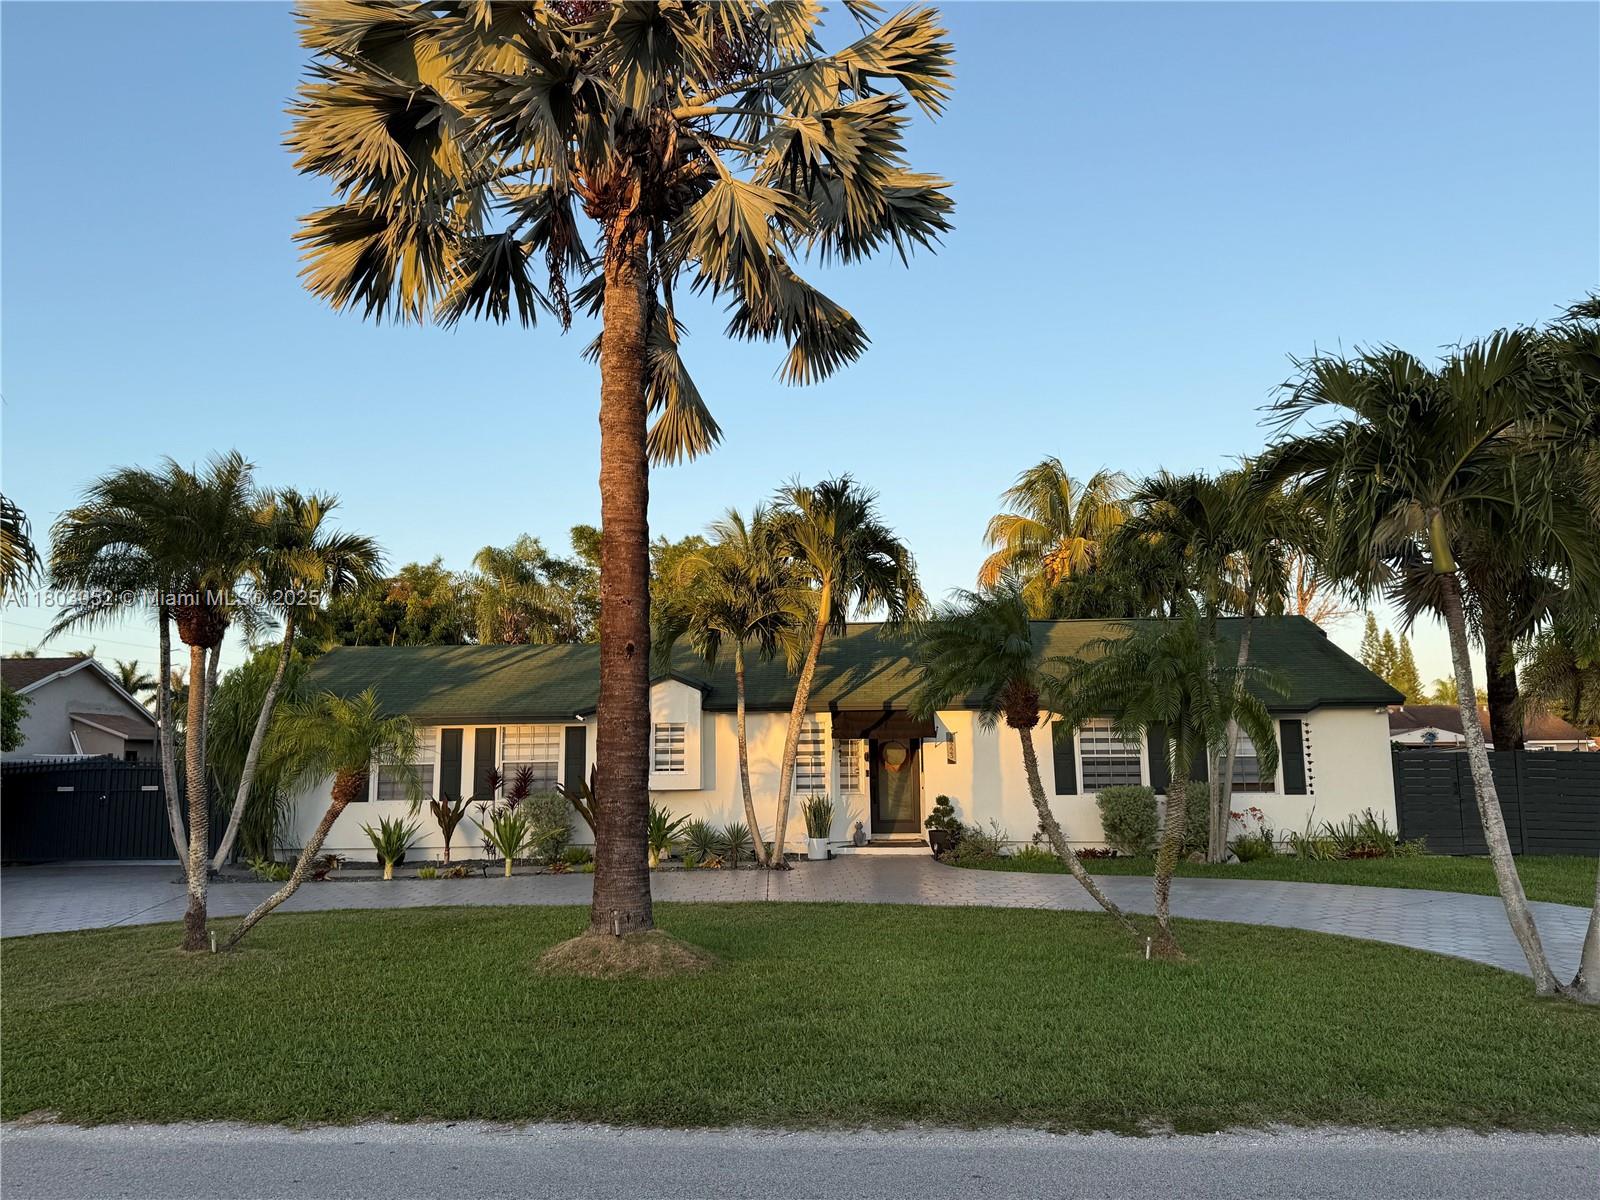
Active
$1,100,000
4
bds
|
2
ba
|
1,595
sqft
|
built
1958
2575 NE 214th St, Miami, FL 33180
$-1,216
Cash flow
-5.8%
Cash-on-Cash Return
4.8%
Cap rate
0.7%
Rent to Value Ratio
Active
$785,000
4
bds
|
3
ba
|
1,823
sqft
|
built
1955
1045 NW 47th Ter, Miami, FL 33127
$-1,175
Cash flow
-7.8%
Cash-on-Cash Return
4.4%
Cap rate
0.6%
Rent to Value Ratio
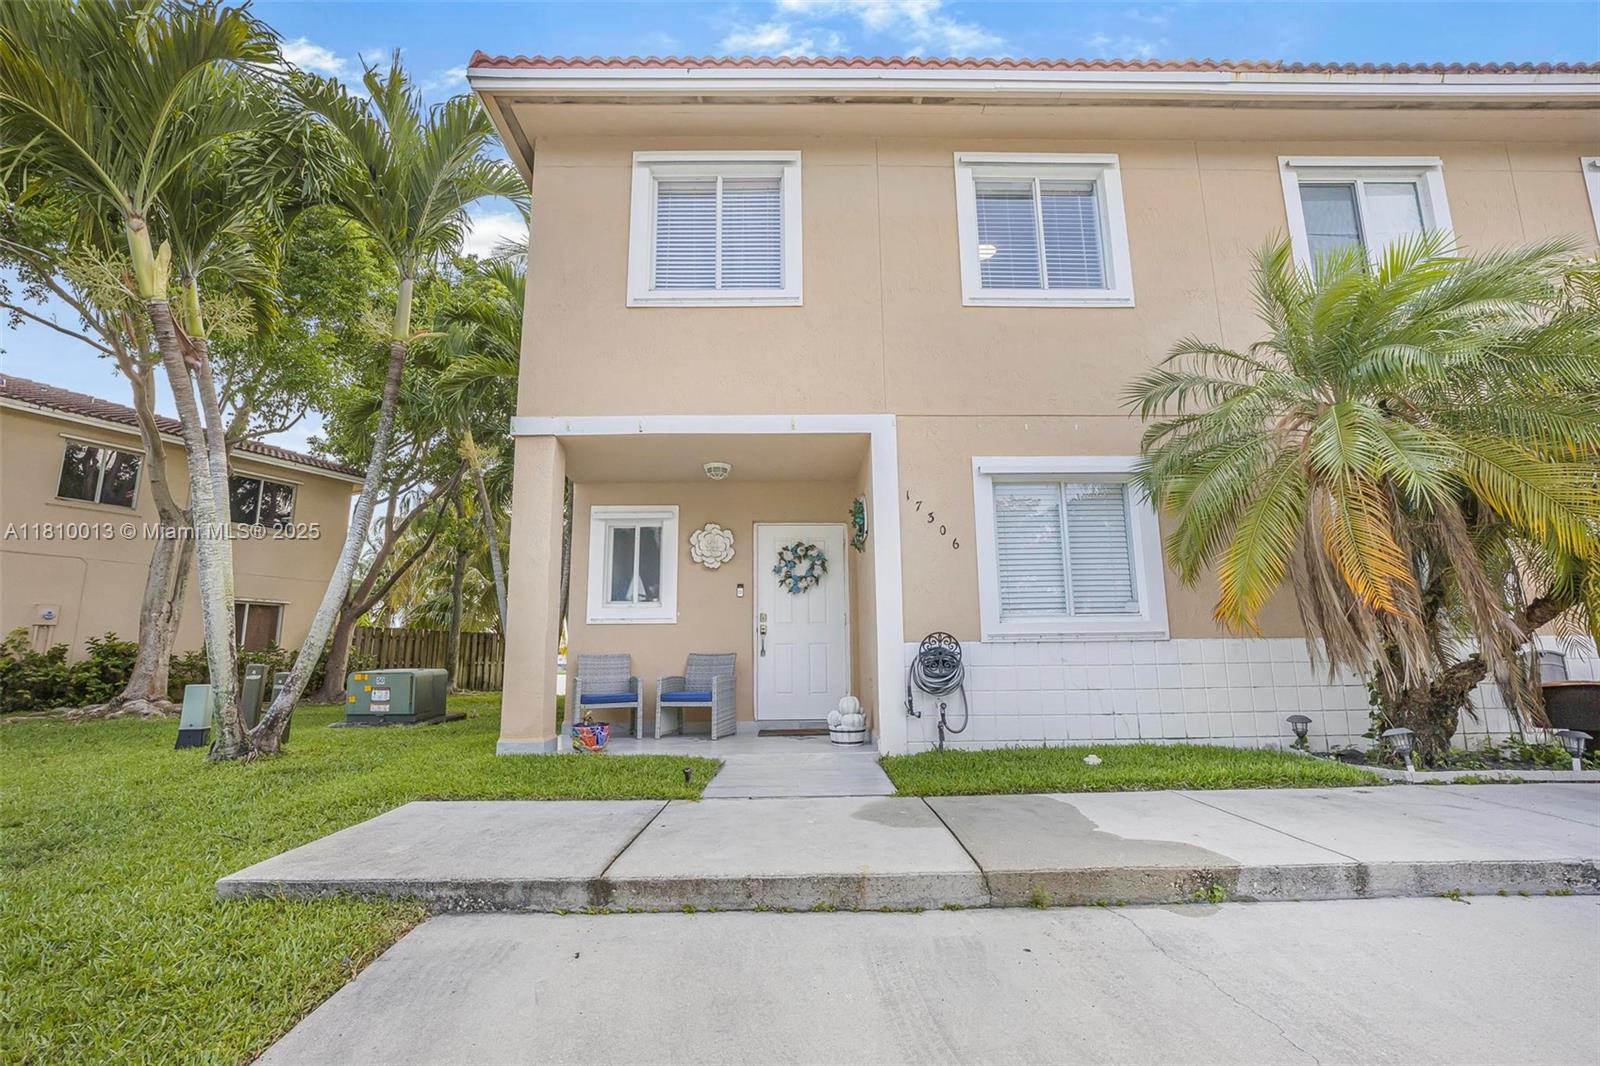
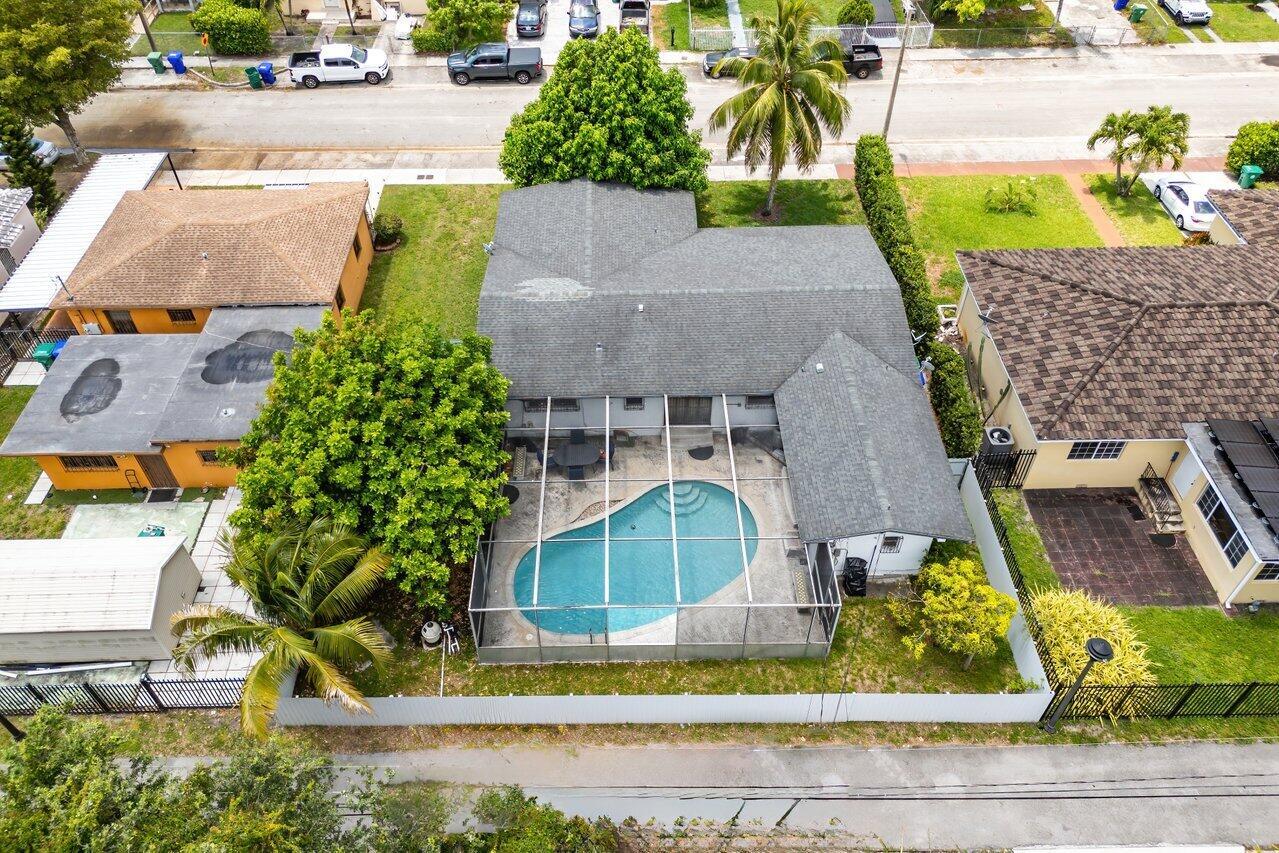
Active
$430,000
3
bds
|
3
ba
|
1,270
sqft
|
built
1996
17306 SW 139th Ct, Miami, FL 33177
$-776
Cash flow
-9.4%
Cash-on-Cash Return
4.0%
Cap rate
0.7%
Rent to Value Ratio
Active
$499,999
4
bds
|
3
ba
|
2,234
sqft
|
built
1961
17781 SW 113th Ave, Miami, FL 33157
$-266
Cash flow
-2.8%
Cash-on-Cash Return
5.5%
Cap rate
0.7%
Rent to Value Ratio

Active
$895,000
4
bds
|
3
ba
|
2,088
sqft
|
built
1963
12225 SW 42nd St, Miami, FL 33175
$-1,383
Cash flow
-8.1%
Cash-on-Cash Return
4.3%
Cap rate
0.6%
Rent to Value Ratio
Active
$1,400,000
2
bds
|
3
ba
|
1,236
sqft
|
built
2019
1000 Brickell Plz, Miami, FL 33131
$-5,691
Cash flow
-21.2%
Cash-on-Cash Return
1.3%
Cap rate
0.5%
Rent to Value Ratio
Active
$5,300,000
6
bds
|
5
ba
|
6,112
sqft
|
built
1987
10506 SW 89th Pl, Miami, FL 33176
$-26,015
Cash flow
-25.6%
Cash-on-Cash Return
0.3%
Cap rate
0.2%
Rent to Value Ratio
Active
$349,000
bds
|
1
ba
|
451
sqft
|
built
2007
185 SW 7th St, Miami, FL 33130
$-1,124
Cash flow
-16.8%
Cash-on-Cash Return
2.3%
Cap rate
0.7%
Rent to Value Ratio
Active
$605,000
1
bds
|
2
ba
|
696
sqft
|
built
2014
1300 Brickell Bay Dr, Miami, FL 33131
$-1,973
Cash flow
-17.0%
Cash-on-Cash Return
2.2%
Cap rate
0.6%
Rent to Value Ratio
Active
$815,000
4
bds
|
2
ba
|
1,740
sqft
|
built
1956
740 NE 181st St, Miami, FL 33162
$-2,446
Cash flow
-15.7%
Cash-on-Cash Return
2.5%
Cap rate
0.4%
Rent to Value Ratio
Active
$749,999
4
bds
|
0
ba
|
2,555
sqft
|
built
1952
9620 NW 26th Ave, Miami, FL 33147
$-2,582
Cash flow
-18.0%
Cash-on-Cash Return
2.0%
Cap rate
0.3%
Rent to Value Ratio
Active
$1,525,000
4
bds
|
3
ba
|
4,093
sqft
|
built
2006
10733 SW 97th Ter, Miami, FL 33176
$-4,886
Cash flow
-16.7%
Cash-on-Cash Return
2.3%
Cap rate
0.4%
Rent to Value Ratio
Active
$825,000
3
bds
|
2
ba
|
1,404
sqft
|
built
1990
21140 SW 179th Ave, Miami, FL 33187
$-2,366
Cash flow
-15.0%
Cash-on-Cash Return
2.7%
Cap rate
0.4%
Rent to Value Ratio
Active
$323,500
3
bds
|
2
ba
|
1,120
sqft
|
built
2001
15741 SW 137th Ave, Miami, FL 33177
$-530
Cash flow
-8.5%
Cash-on-Cash Return
4.2%
Cap rate
0.8%
Rent to Value Ratio
Active
$835,000
3
bds
|
2
ba
|
1,777
sqft
|
built
1948
6241 SW 20th Ter, Miami, FL 33155
$-1,941
Cash flow
-12.1%
Cash-on-Cash Return
3.4%
Cap rate
0.5%
Rent to Value Ratio
Active
$799,000
3
bds
|
2
ba
|
2,008
sqft
|
built
2003
2801 SW 139th Ct, Miami, FL 33175
$-1,794
Cash flow
-11.7%
Cash-on-Cash Return
3.5%
Cap rate
0.5%
Rent to Value Ratio
Active
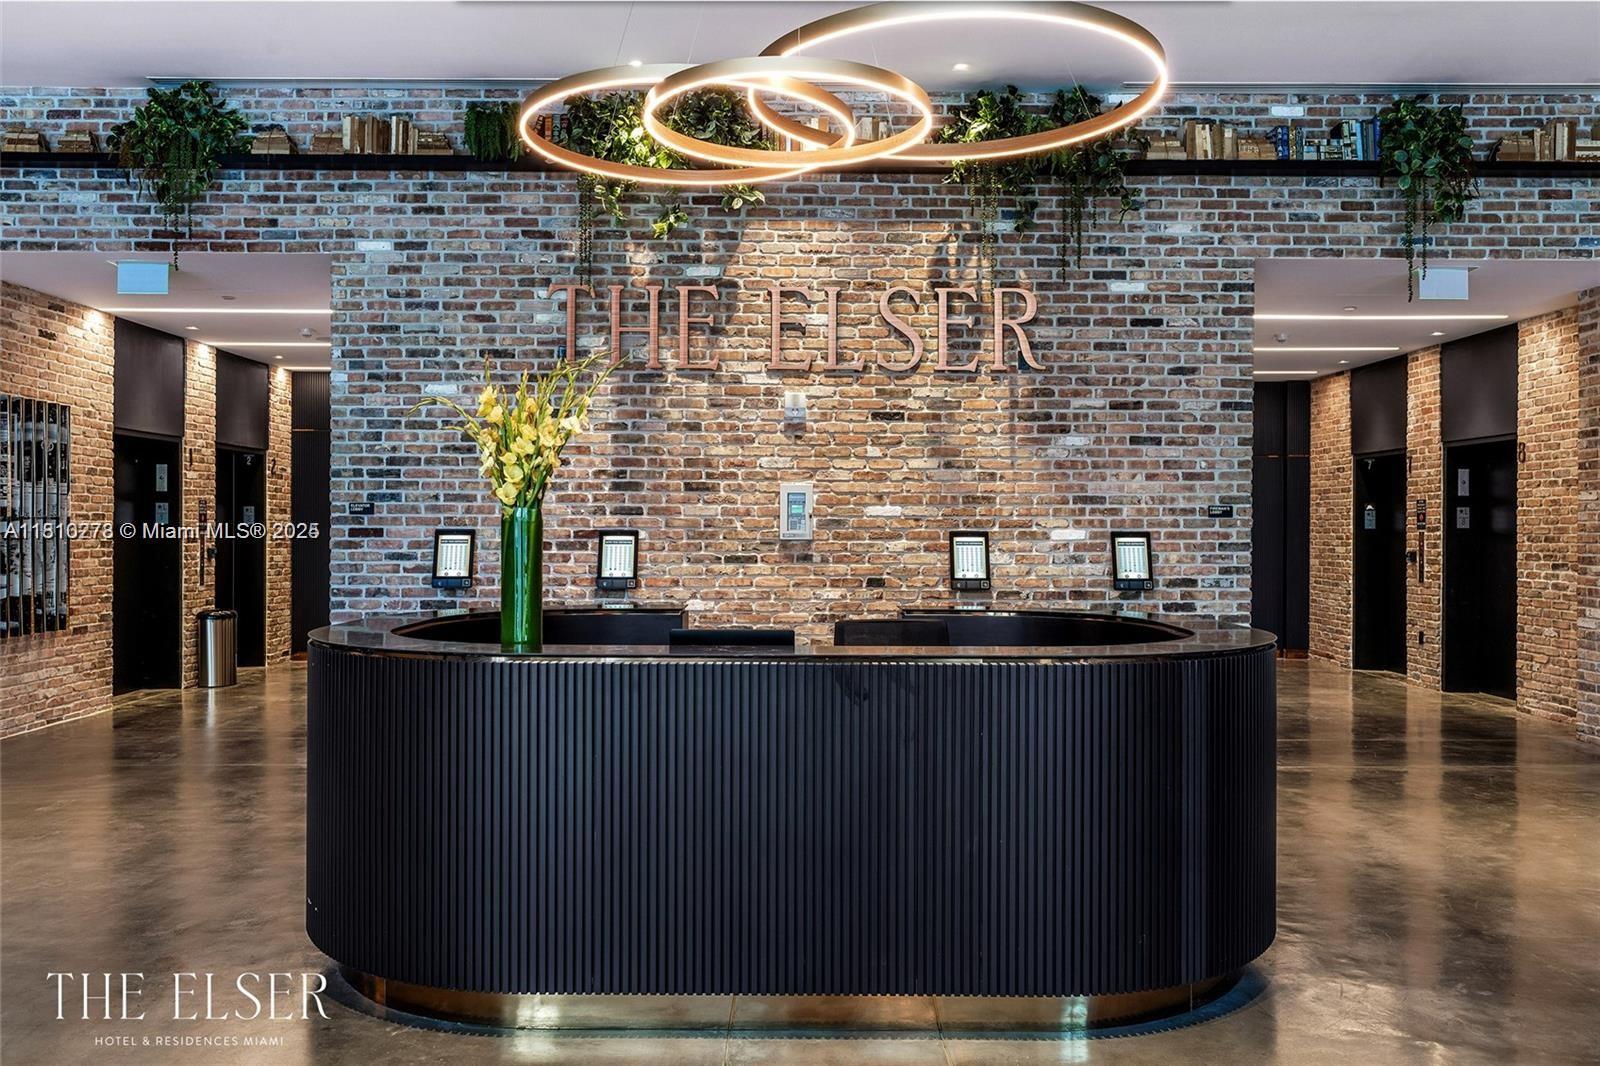
$495,995
1
bds
|
2
ba
|
735
sqft
|
built
2007
3470 E Coast Ave, Miami, FL 33137
$-2,002
Cash flow
-21.1%
Cash-on-Cash Return
1.3%
Cap rate
0.6%
Rent to Value Ratio
Active
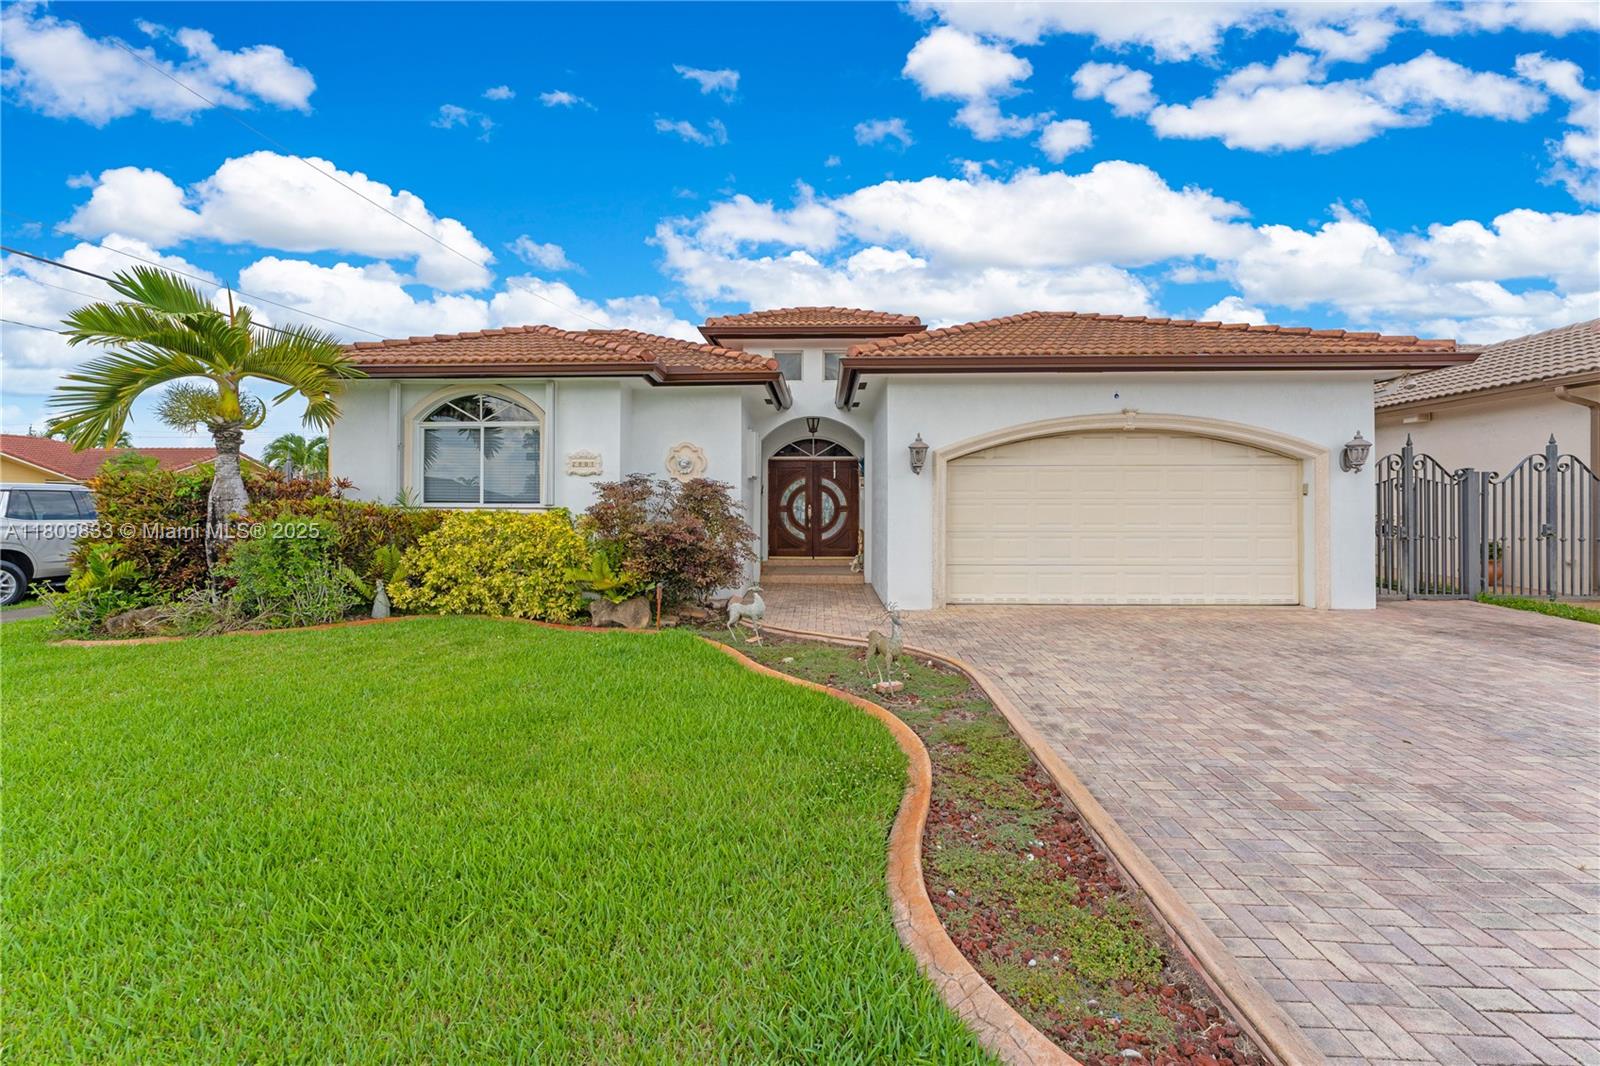
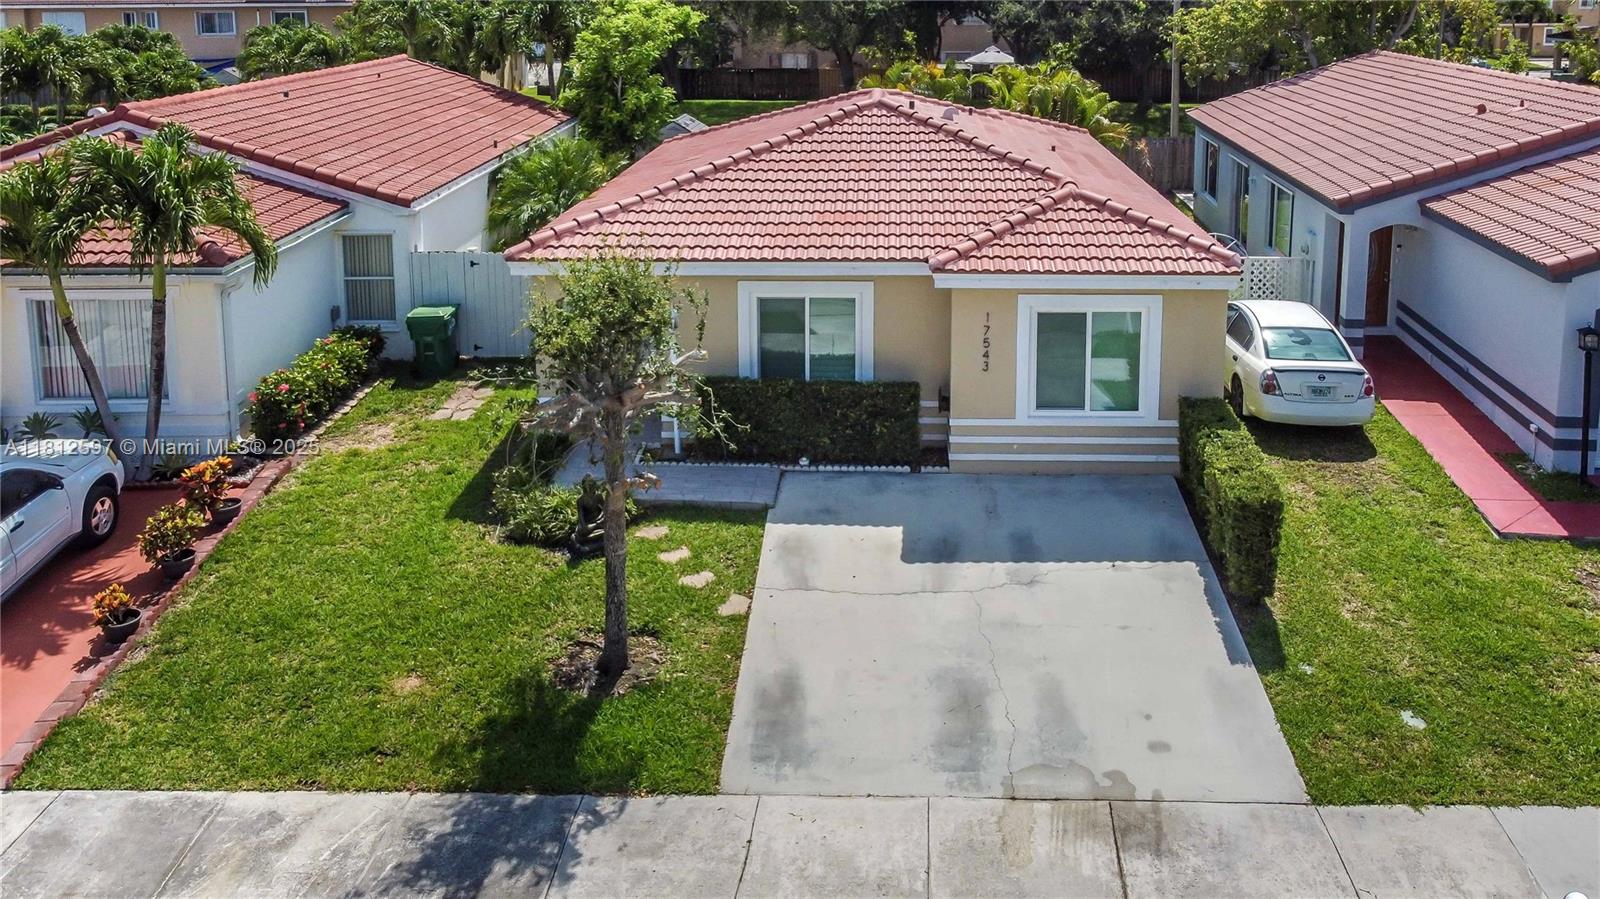
$549,900
3
bds
|
2
ba
|
1,144
sqft
|
built
1997
17543 SW 142nd Ct, Miami, FL 33177
$-547
Cash flow
-5.2%
Cash-on-Cash Return
5.0%
Cap rate
0.7%
Rent to Value Ratio
Active
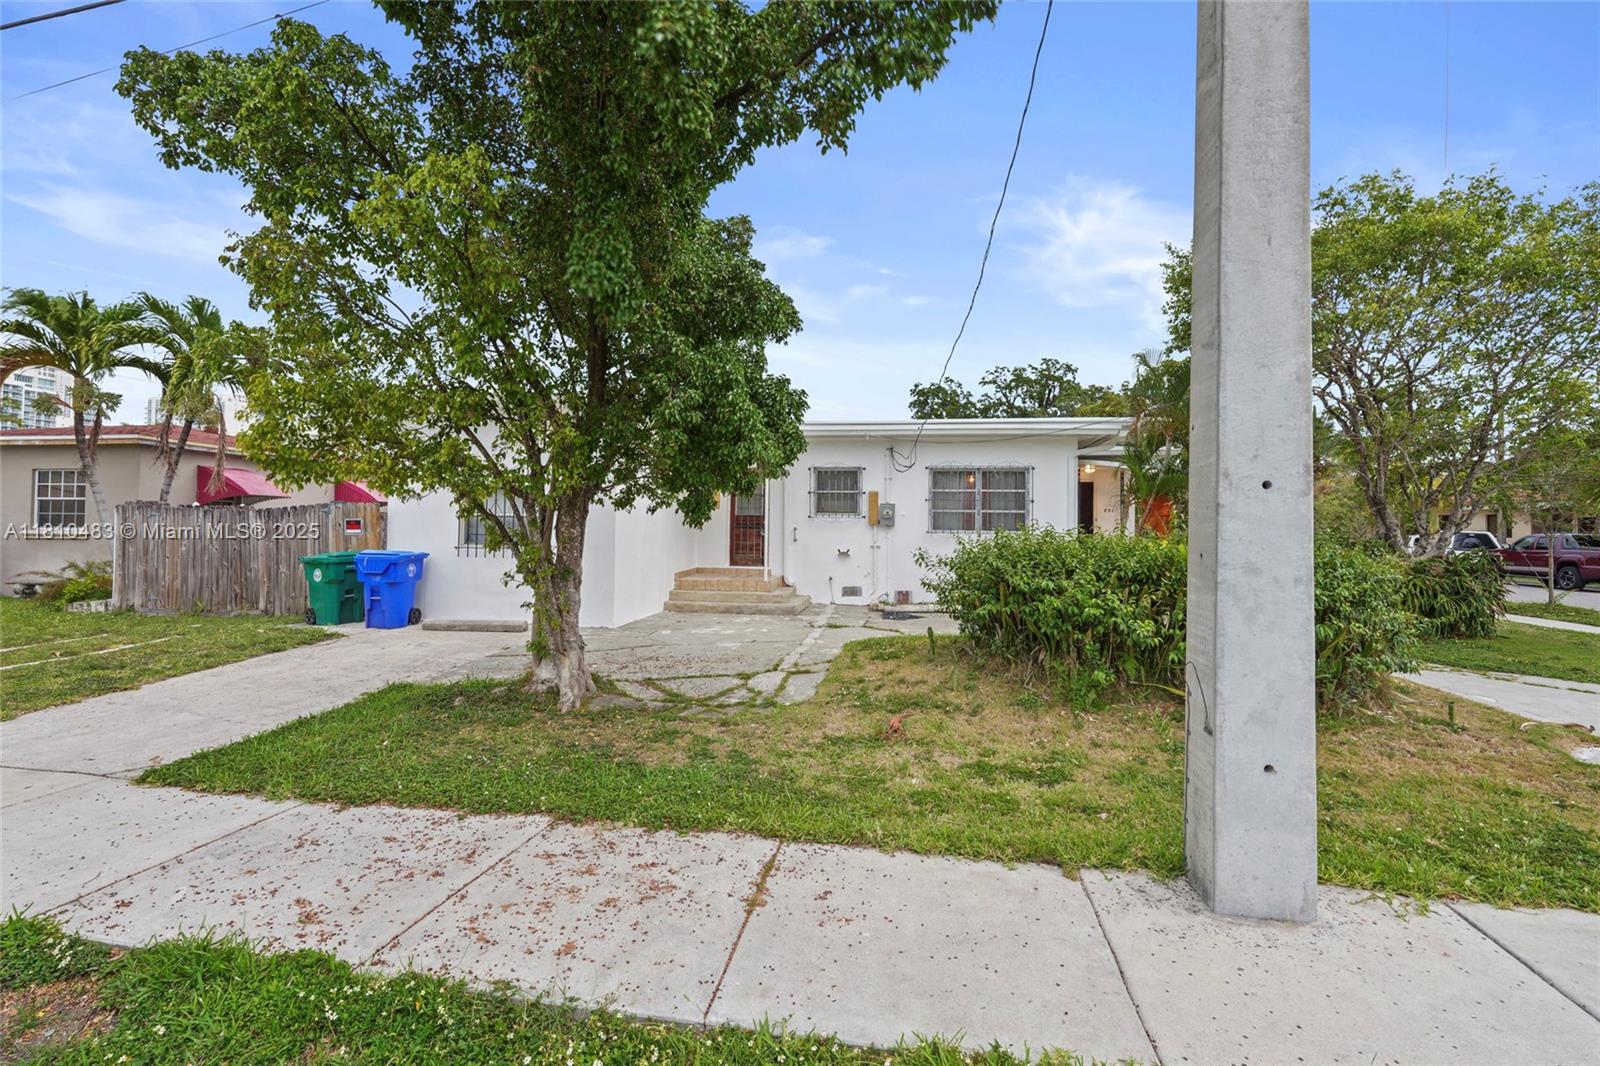
$525,000
3
bds
|
2
ba
|
1,589
sqft
|
built
1951
851 NW 21st Ave, Miami, FL 33125
$-565
Cash flow
-5.6%
Cash-on-Cash Return
4.9%
Cap rate
0.6%
Rent to Value Ratio
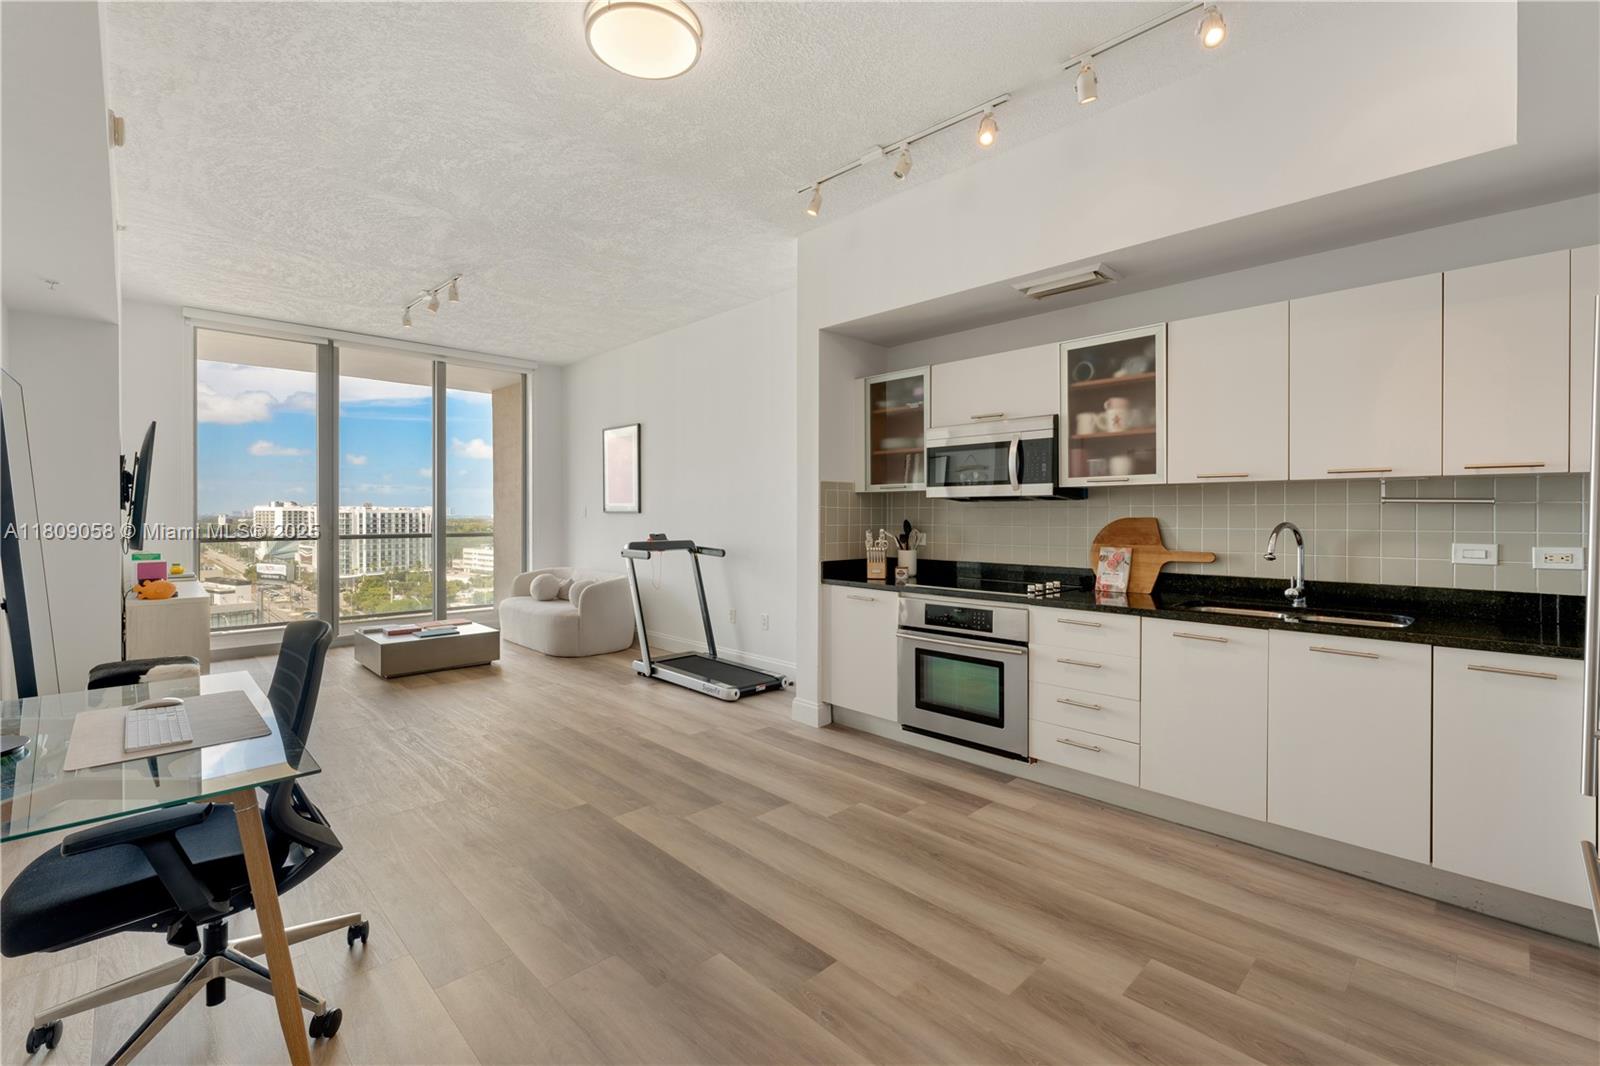
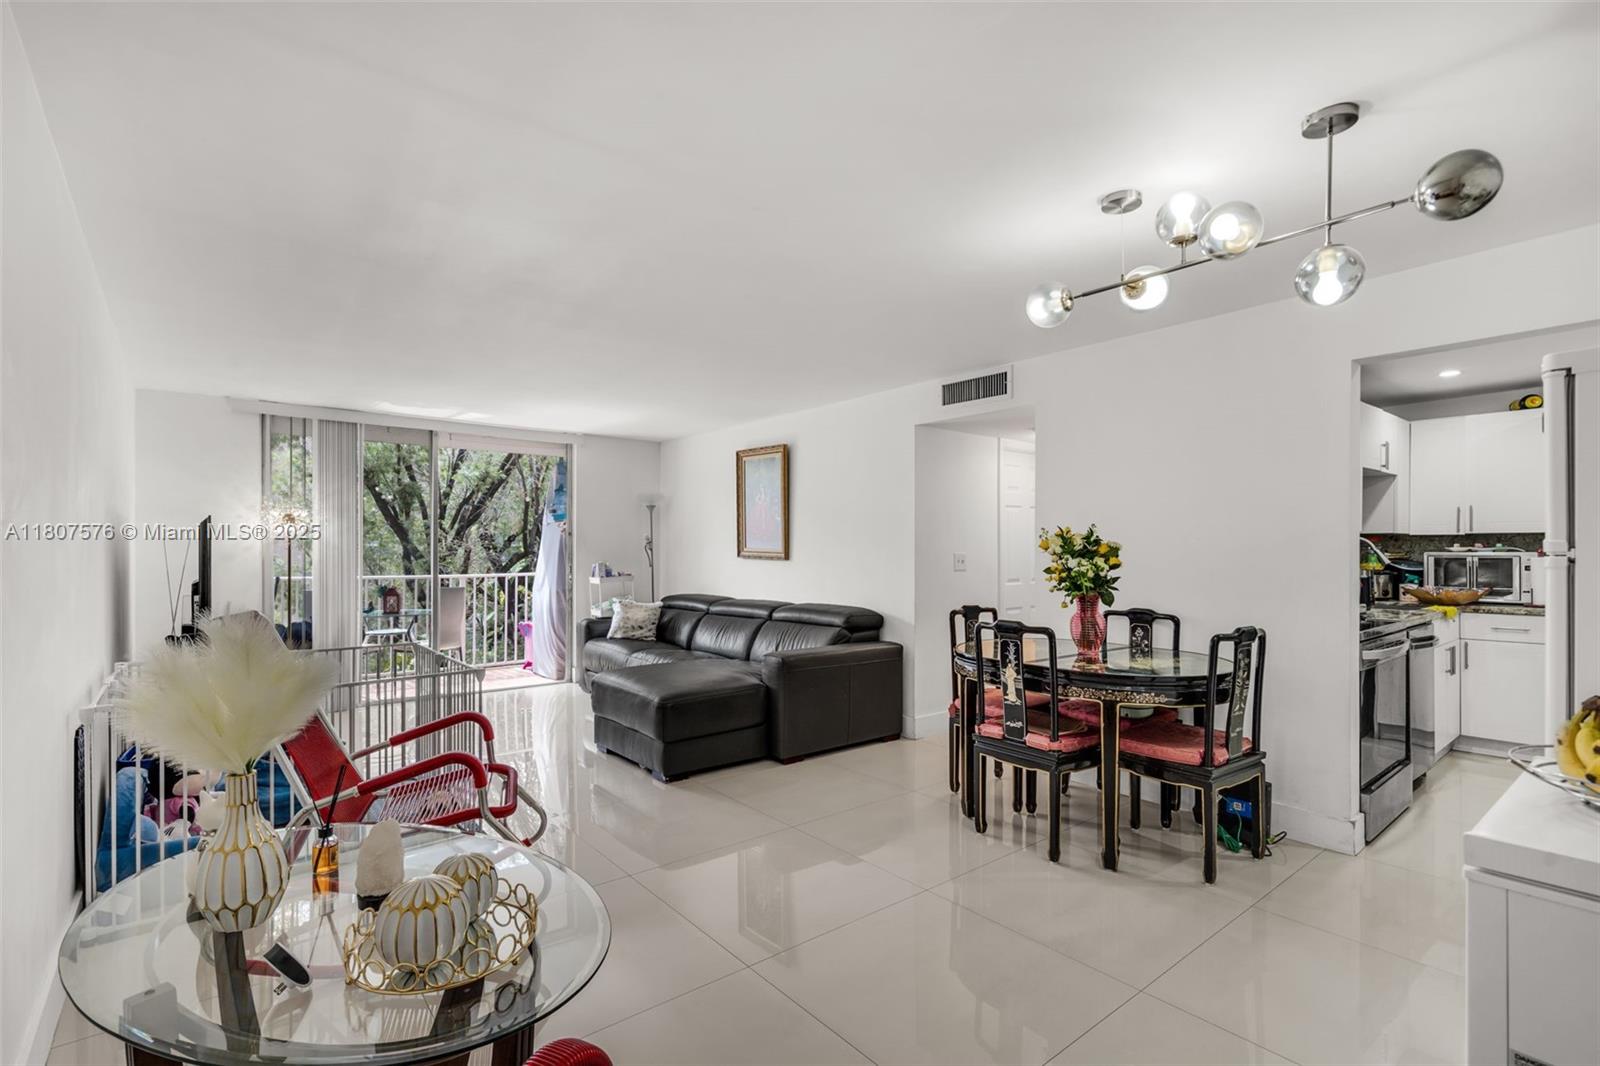
Active
$575,000
2
bds
|
2
ba
|
1,043
sqft
|
built
2008
1900 N Bayshore Dr, Miami, FL 33132
$-2,248
Cash flow
-20.4%
Cash-on-Cash Return
1.5%
Cap rate
0.6%
Rent to Value Ratio
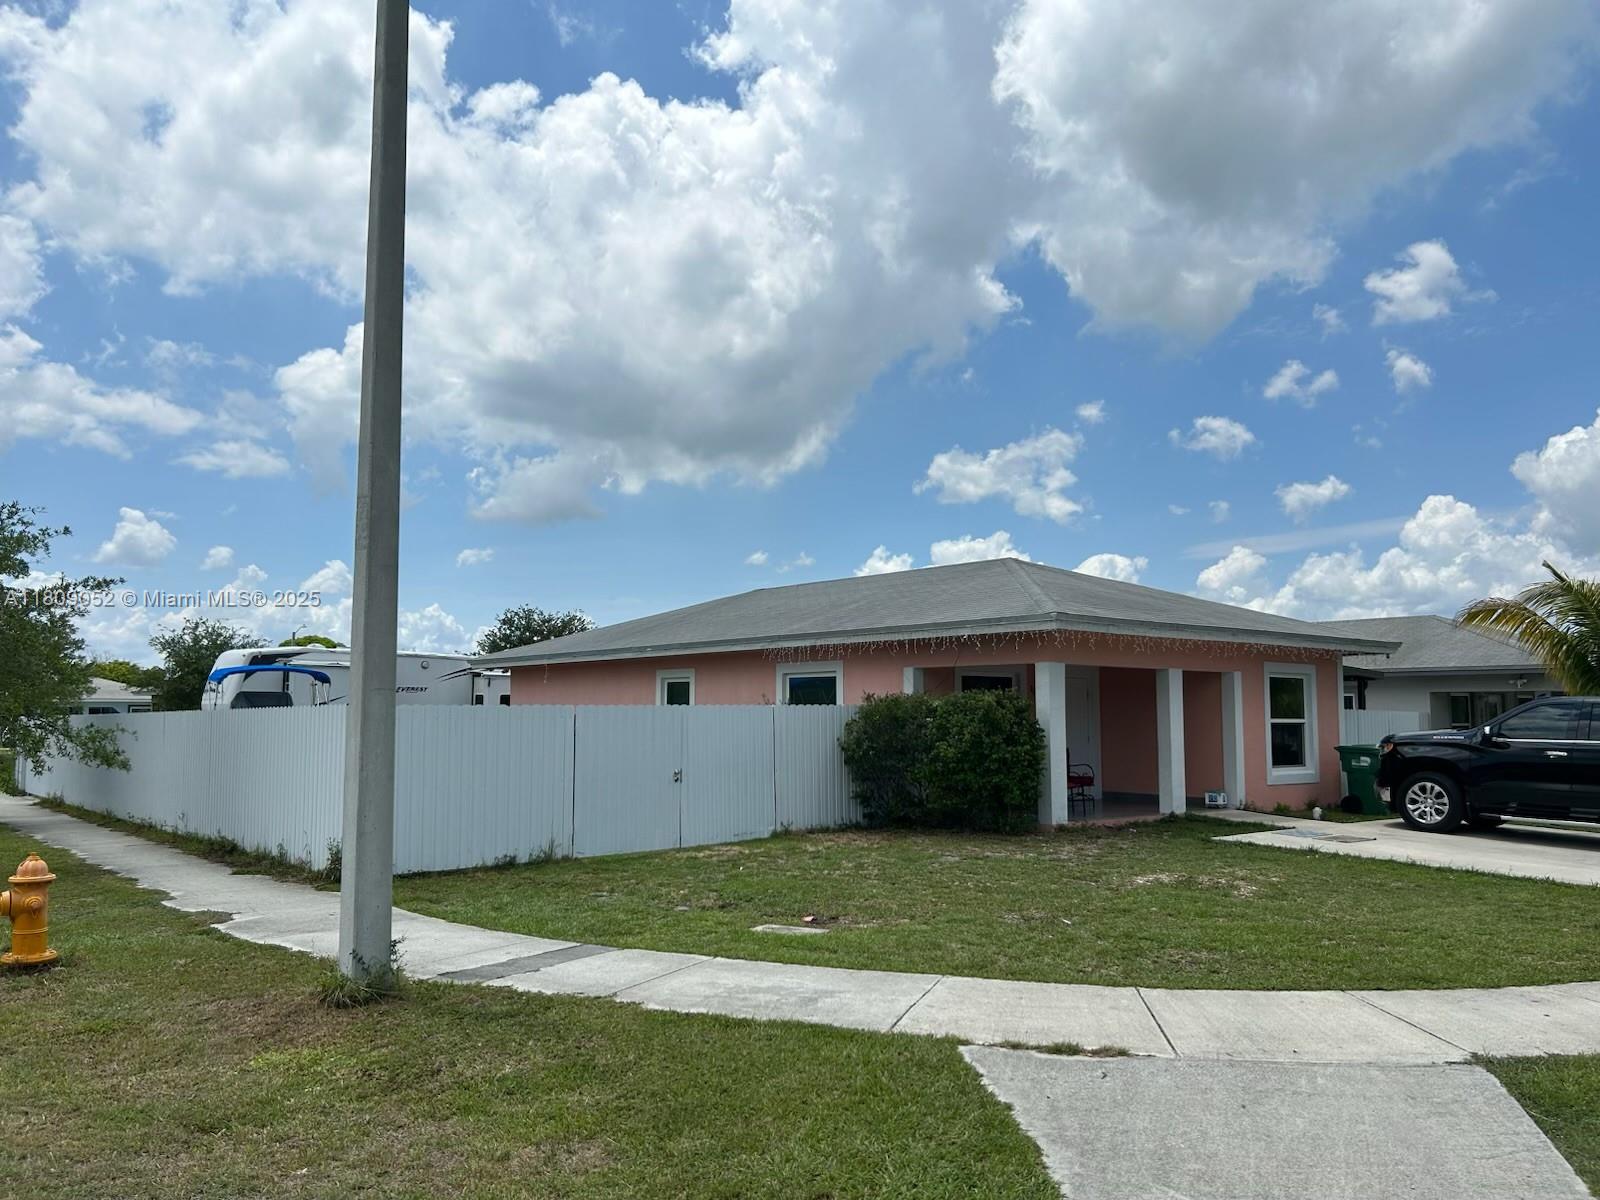
Active
$780,000
3
bds
|
2
ba
|
1,679
sqft
|
built
1987
15223 SW 152nd Ave, Miami, FL 33187
$-2,040
Cash flow
-13.6%
Cash-on-Cash Return
3.0%
Cap rate
0.4%
Rent to Value Ratio
Active
$330,000
3
bds
|
2
ba
|
987
sqft
|
built
1992
15221 SW 80th St, Miami, FL 33193
$-453
Cash flow
-7.2%
Cash-on-Cash Return
4.5%
Cap rate
0.8%
Rent to Value Ratio
Active
$300,000
2
bds
|
2
ba
|
1,099
sqft
|
built
1977
8511 NW 8th St, Miami, FL 33126
$-648
Cash flow
-11.3%
Cash-on-Cash Return
3.6%
Cap rate
0.8%
Rent to Value Ratio
Active
$3,350,000
4
bds
|
4
ba
|
2,904
sqft
|
built
1953
259 Shore Dr E, Miami, FL 33133
$-12,453
Cash flow
-19.4%
Cash-on-Cash Return
1.7%
Cap rate
0.3%
Rent to Value Ratio
Active
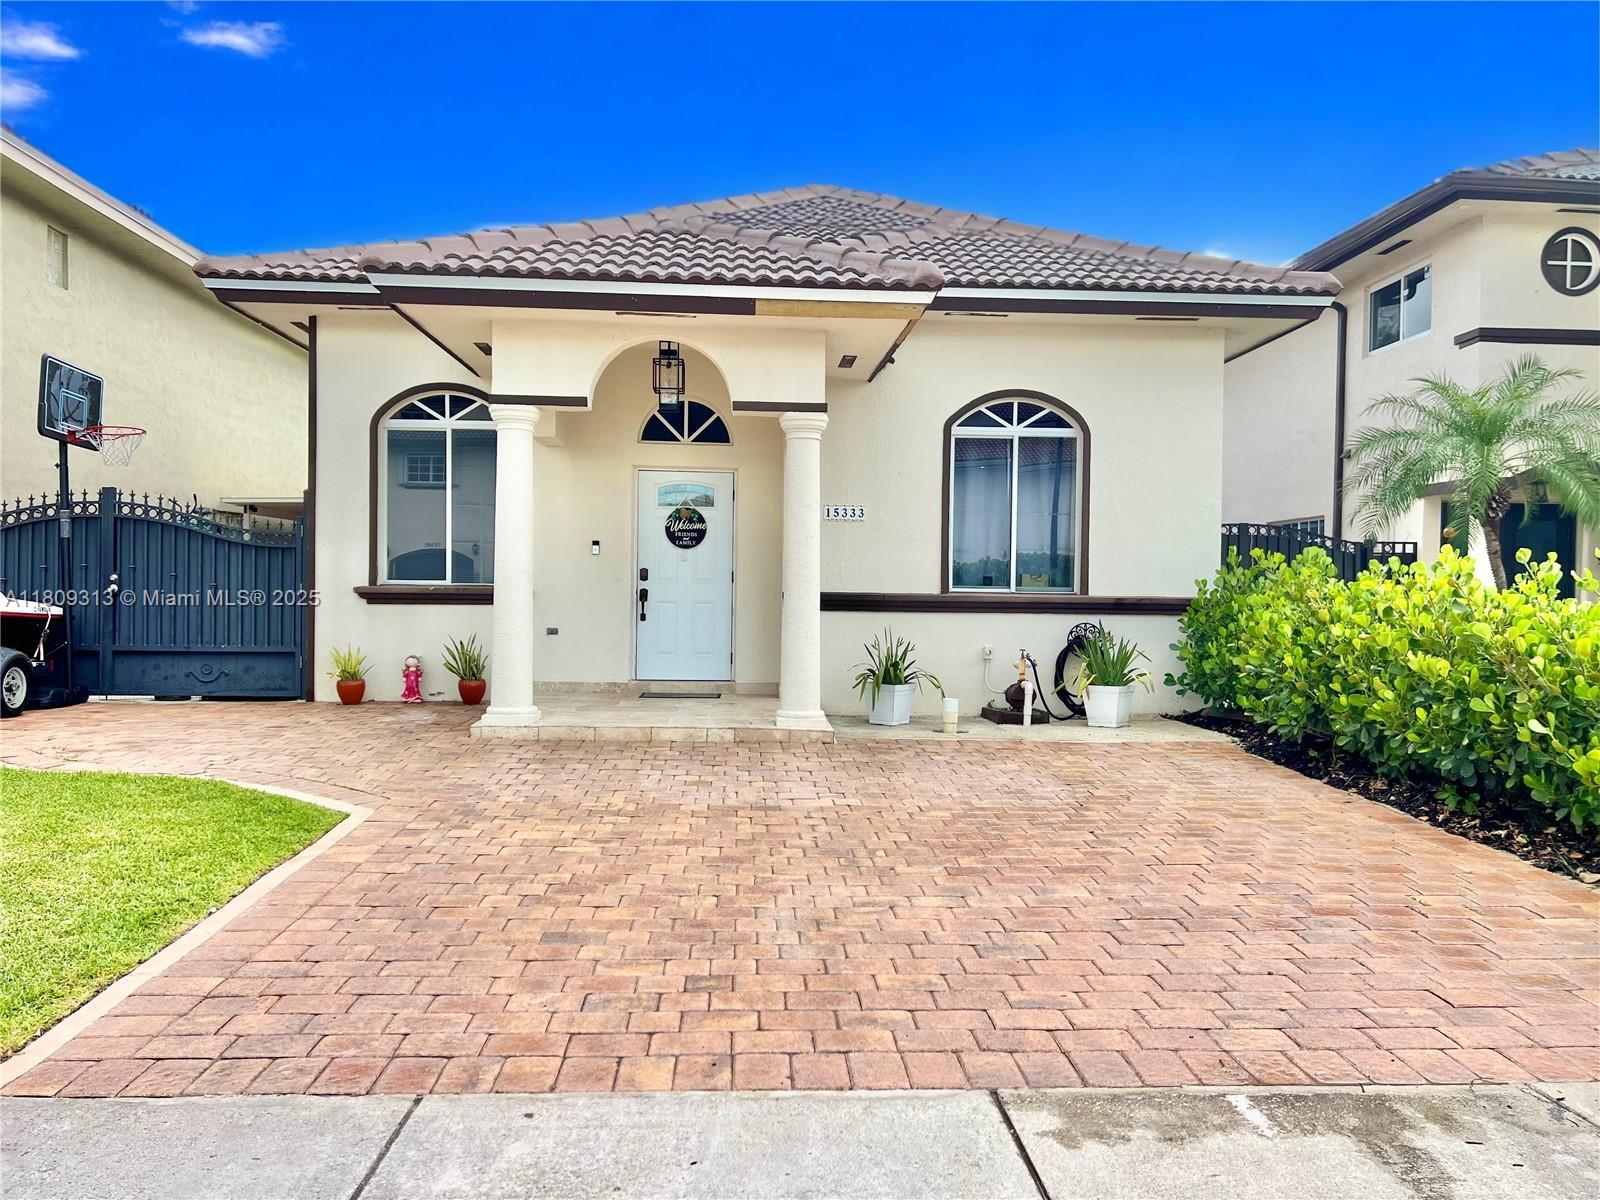
$630,000
3
bds
|
2
ba
|
1,268
sqft
|
built
1998
15333 SW 40th Ter, Miami, FL 33185
$-1,442
Cash flow
-11.9%
Cash-on-Cash Return
3.4%
Cap rate
0.6%
Rent to Value Ratio
Active
$550,000
1
bds
|
1
ba
|
430
sqft
|
built
2022
398 NE 5th St, Miami, FL 33132
$-1,641
Cash flow
-15.6%
Cash-on-Cash Return
2.6%
Cap rate
0.7%
Rent to Value Ratio

Active
$725,000
4
bds
|
4
ba
|
1,818
sqft
|
built
1984
520 SW 90th Ct, Miami, FL 33174
$-1,749
Cash flow
-12.6%
Cash-on-Cash Return
3.3%
Cap rate
0.5%
Rent to Value Ratio
Active
$1,099,000
4
bds
|
4
ba
|
2,381
sqft
|
built
2018
19120 SW 127th Pl, Miami, FL 33177
$-1,773
Cash flow
-8.4%
Cash-on-Cash Return
4.2%
Cap rate
0.6%
Rent to Value Ratio
Active
$1,688,000
3
bds
|
3
ba
|
1,727
sqft
|
built
1947
5880 SW 47th St, Miami, FL 33155
$-6,203
Cash flow
-19.2%
Cash-on-Cash Return
1.7%
Cap rate
0.3%
Rent to Value Ratio