Miami, FL Investment Properties for Sale
Browse homes for sale and investment properties in Miami, FL. Refine your search by price, property type, or more.
Best cash flowing properties in Miami, FL
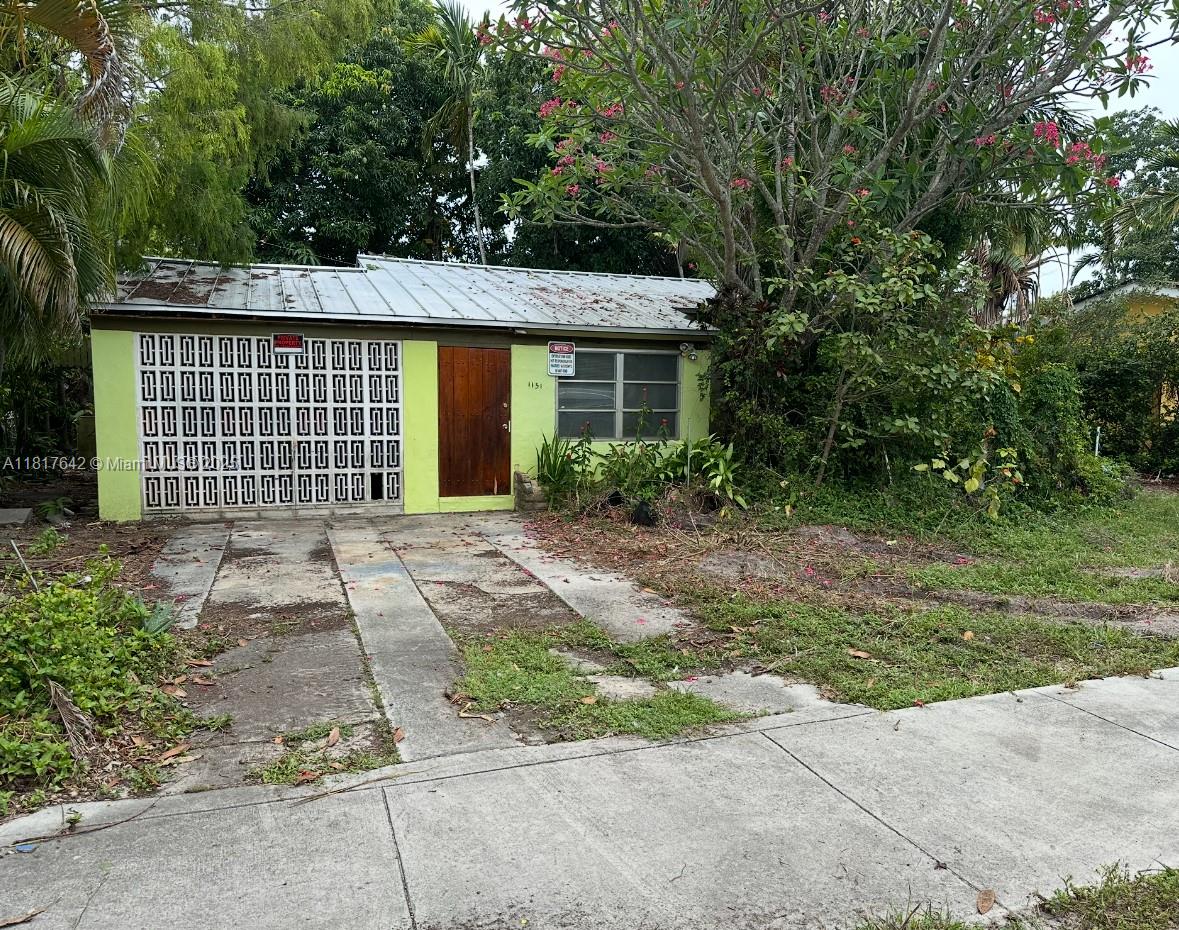
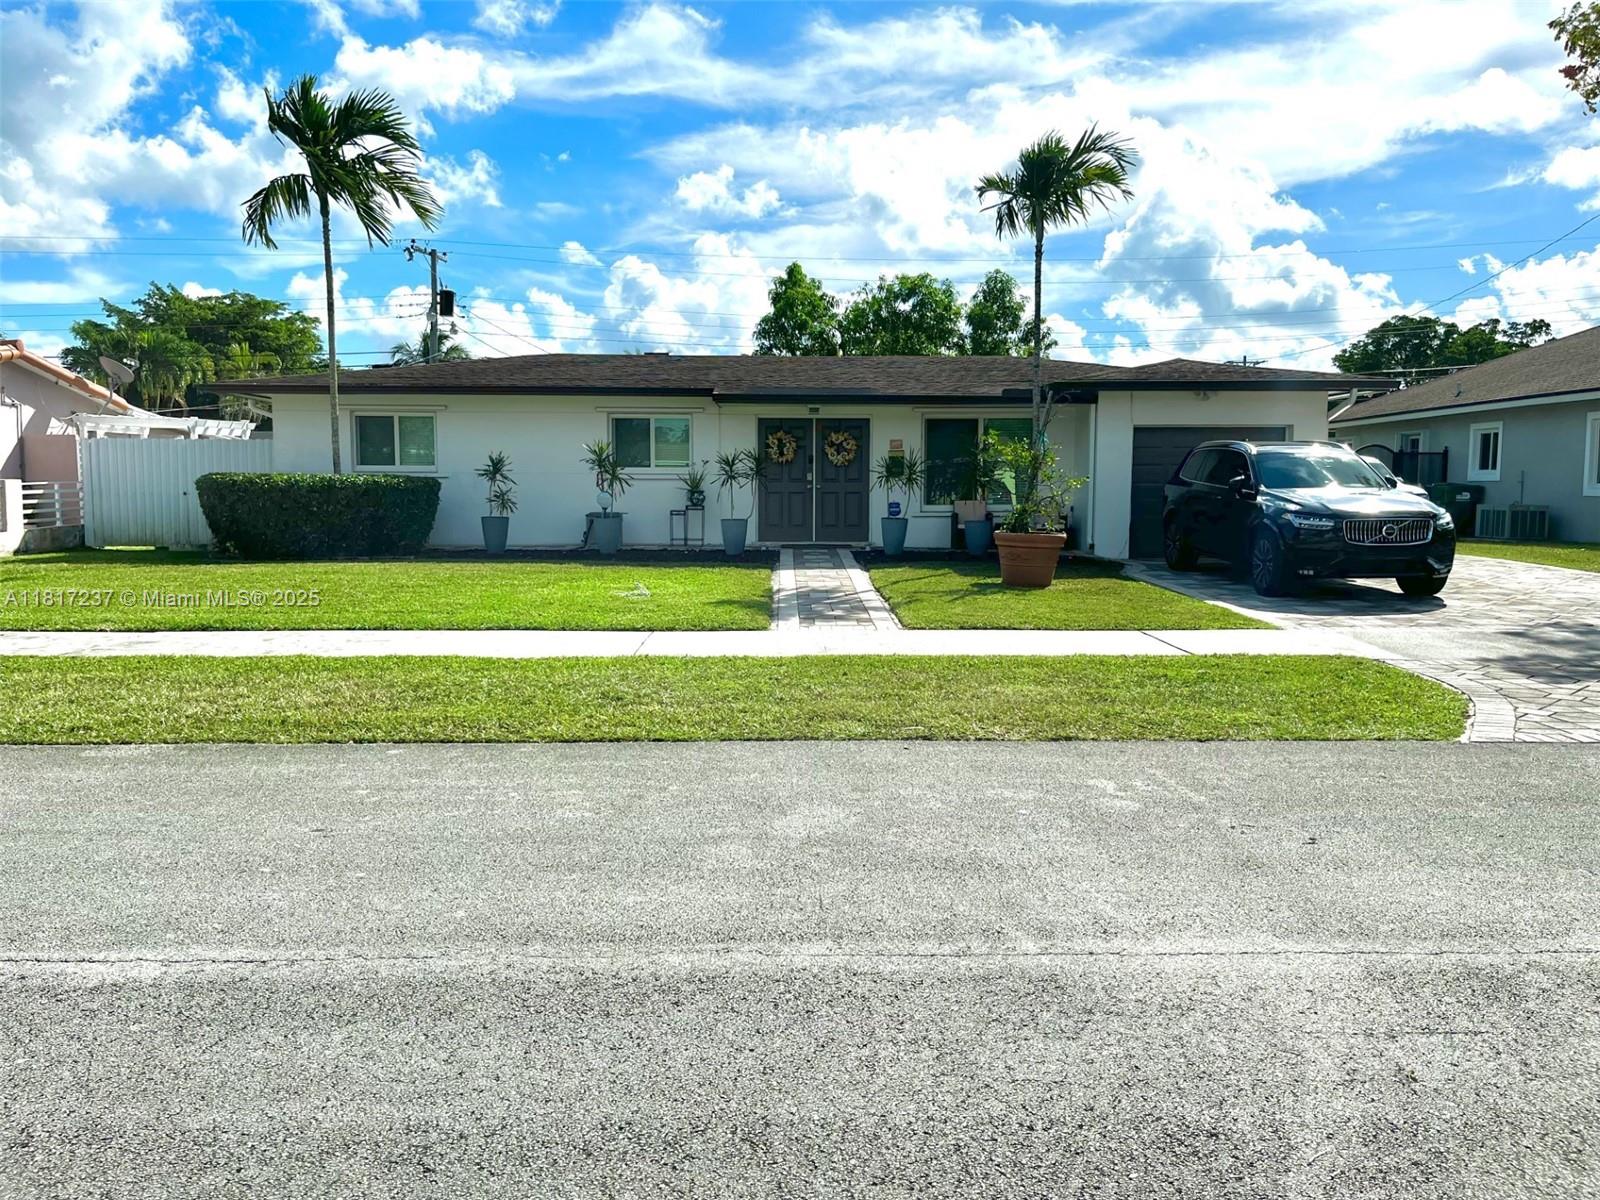
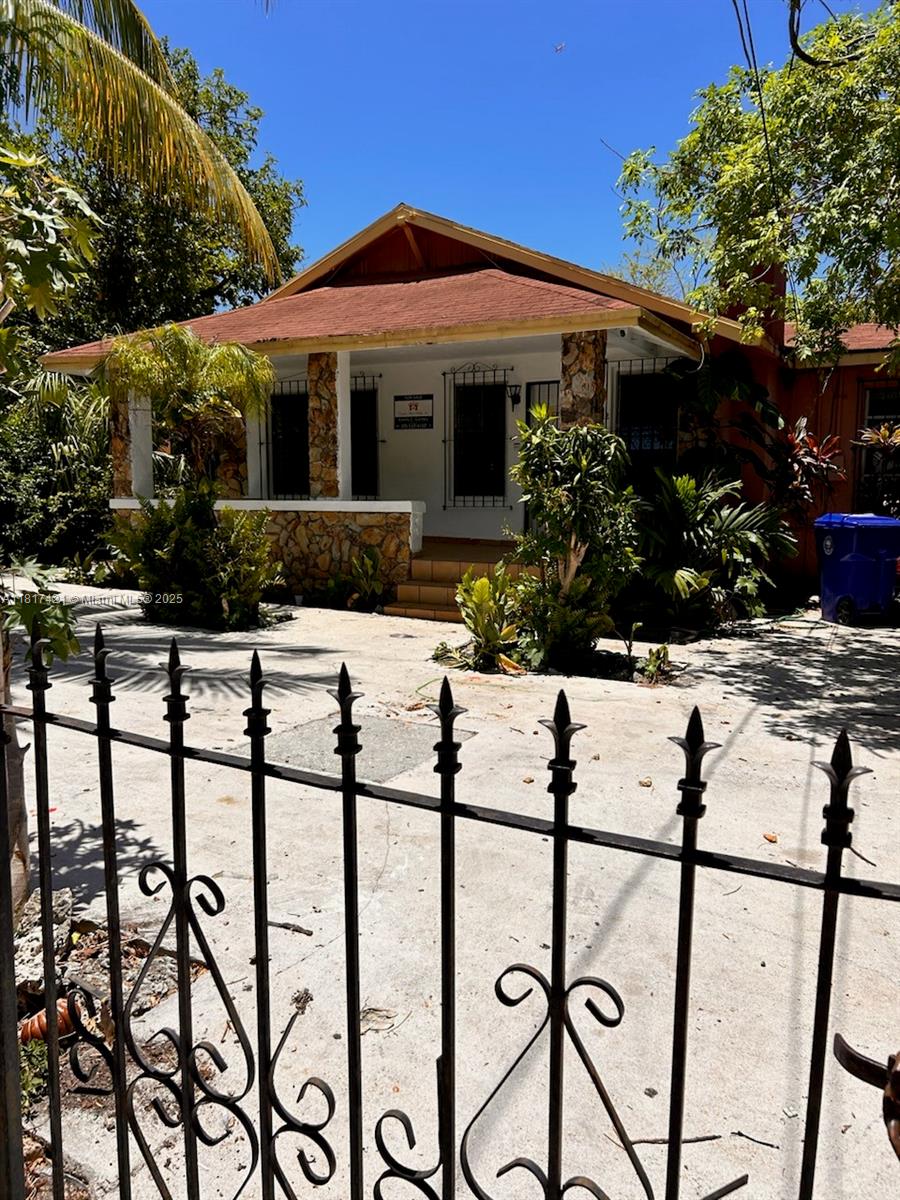
Pending
$379,000
3
bds
|
1
ba
|
1,077
sqft
|
built
1952
1151 NW 112th St, Miami, FL 33168
$-54
Cash flow
-0.7%
Cash-on-Cash Return
6.0%
Cap rate
0.8%
Rent to Value Ratio
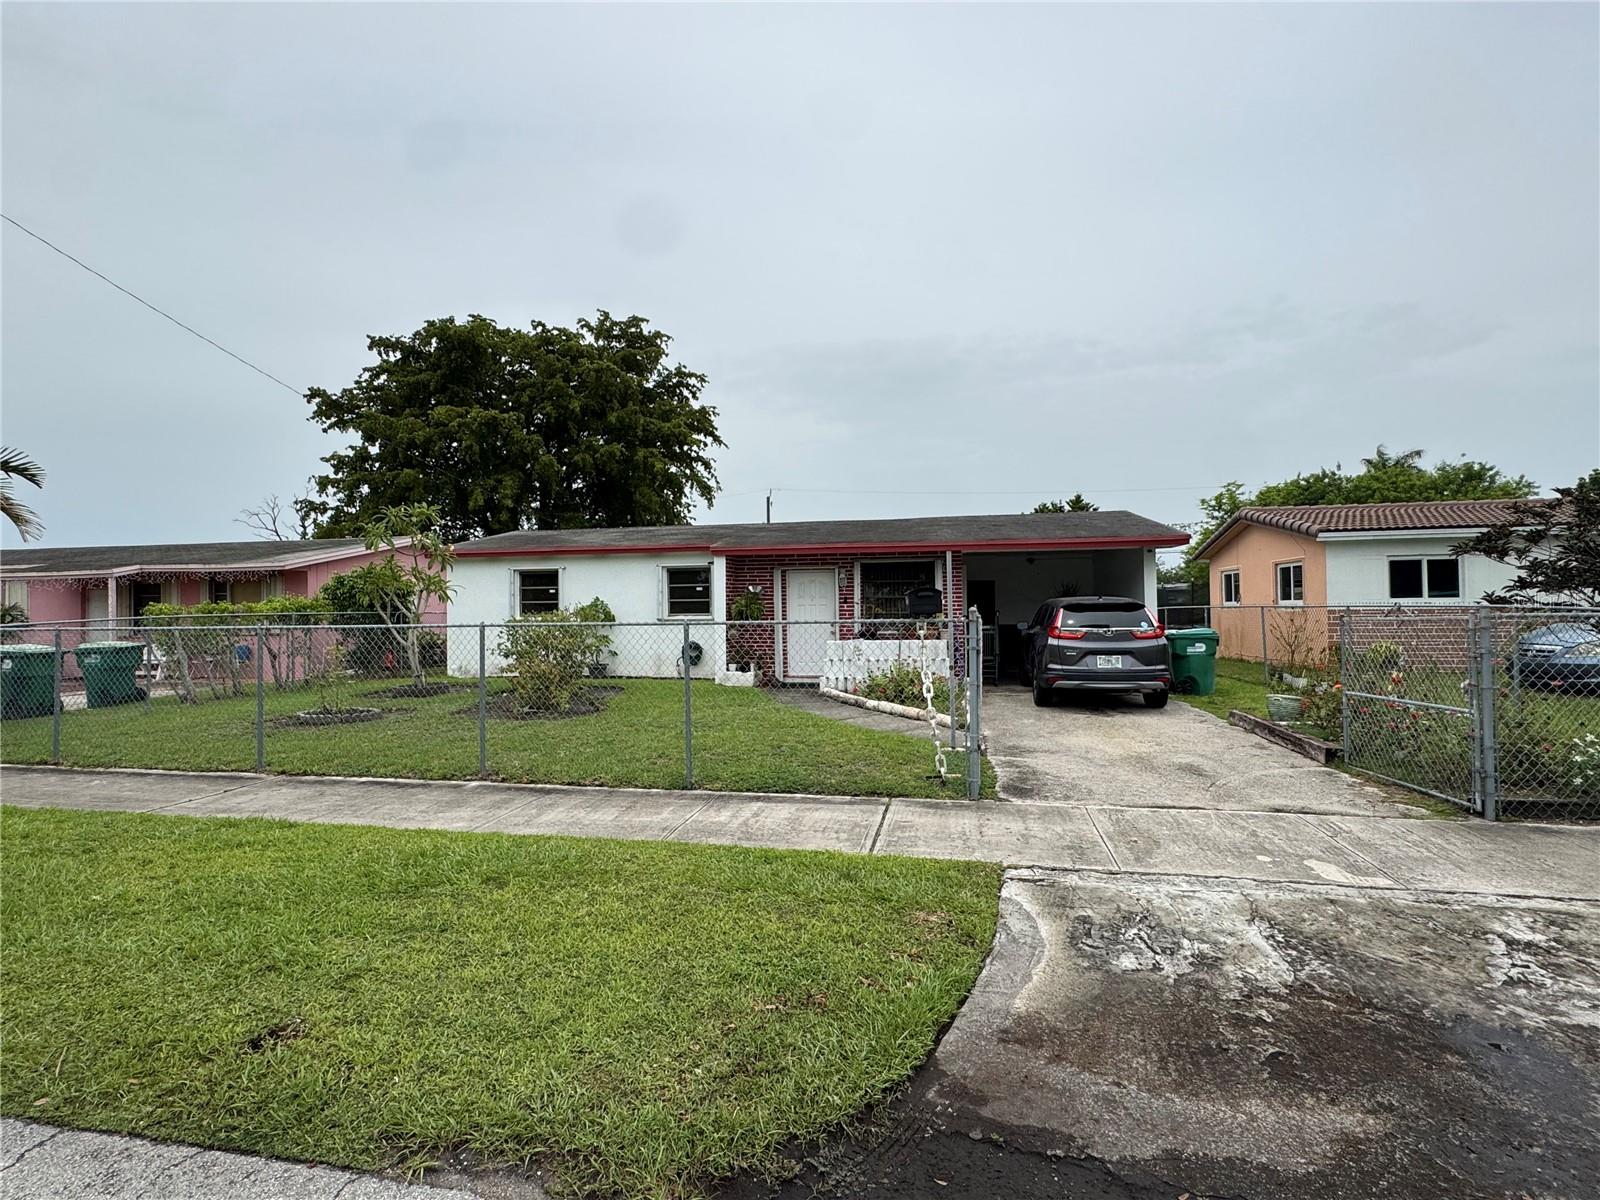
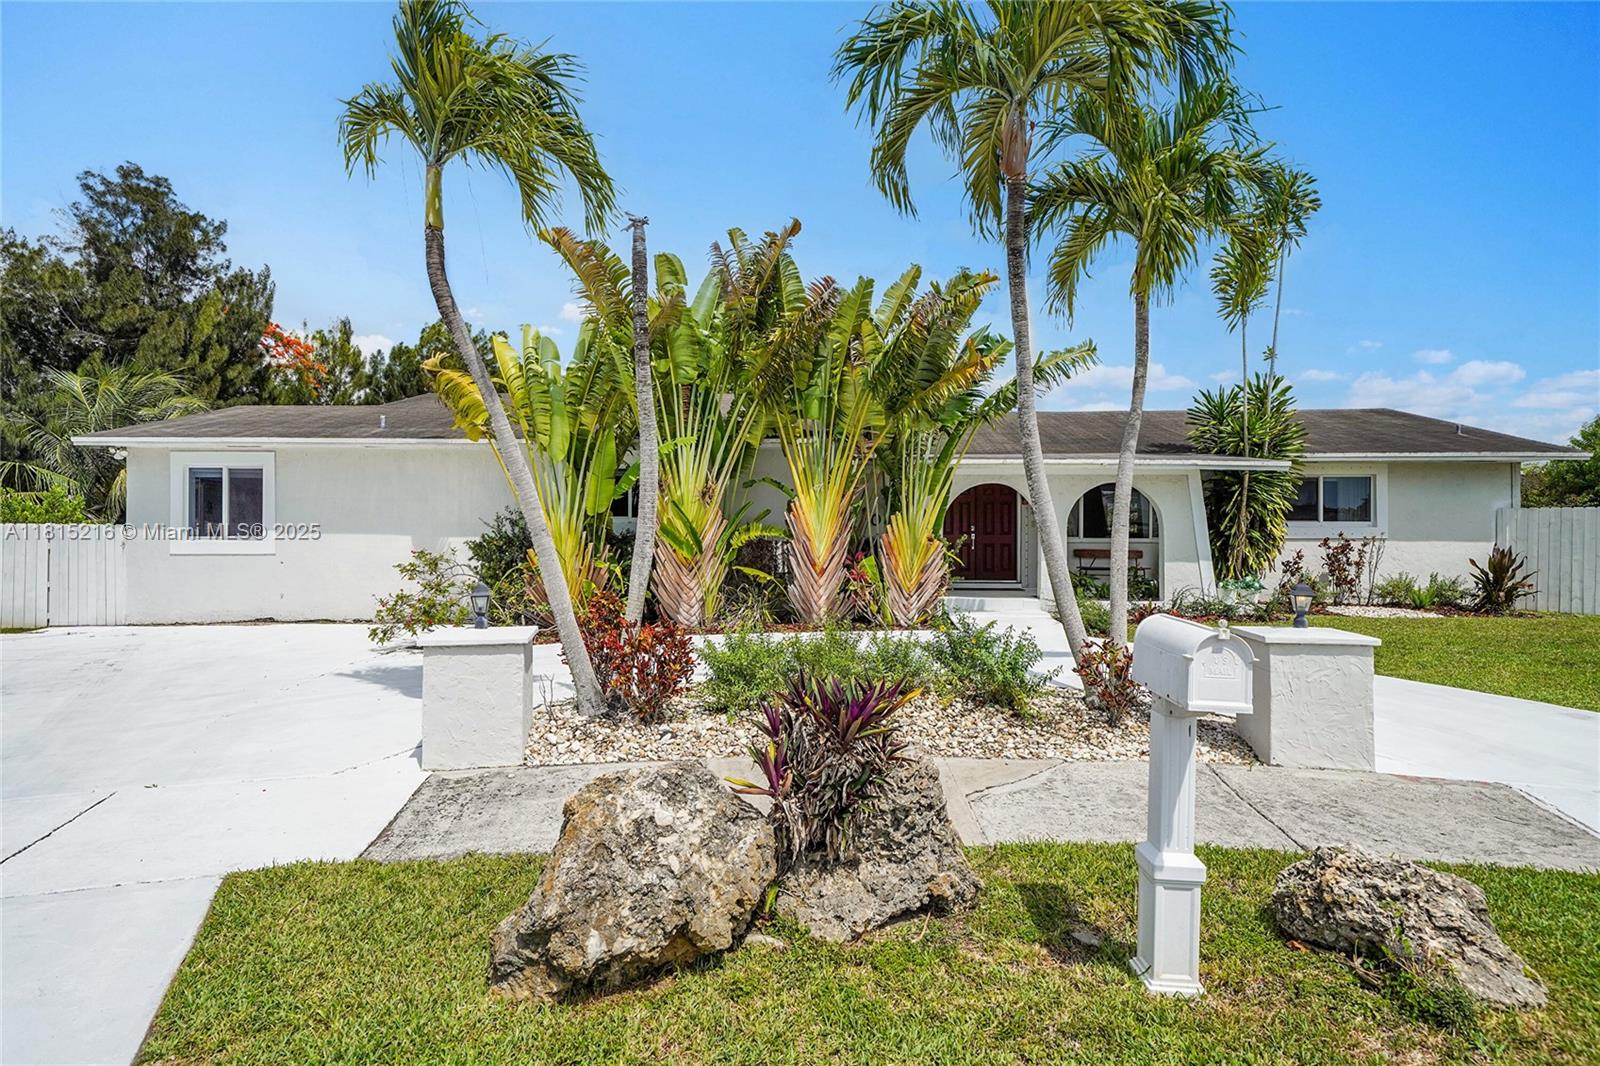
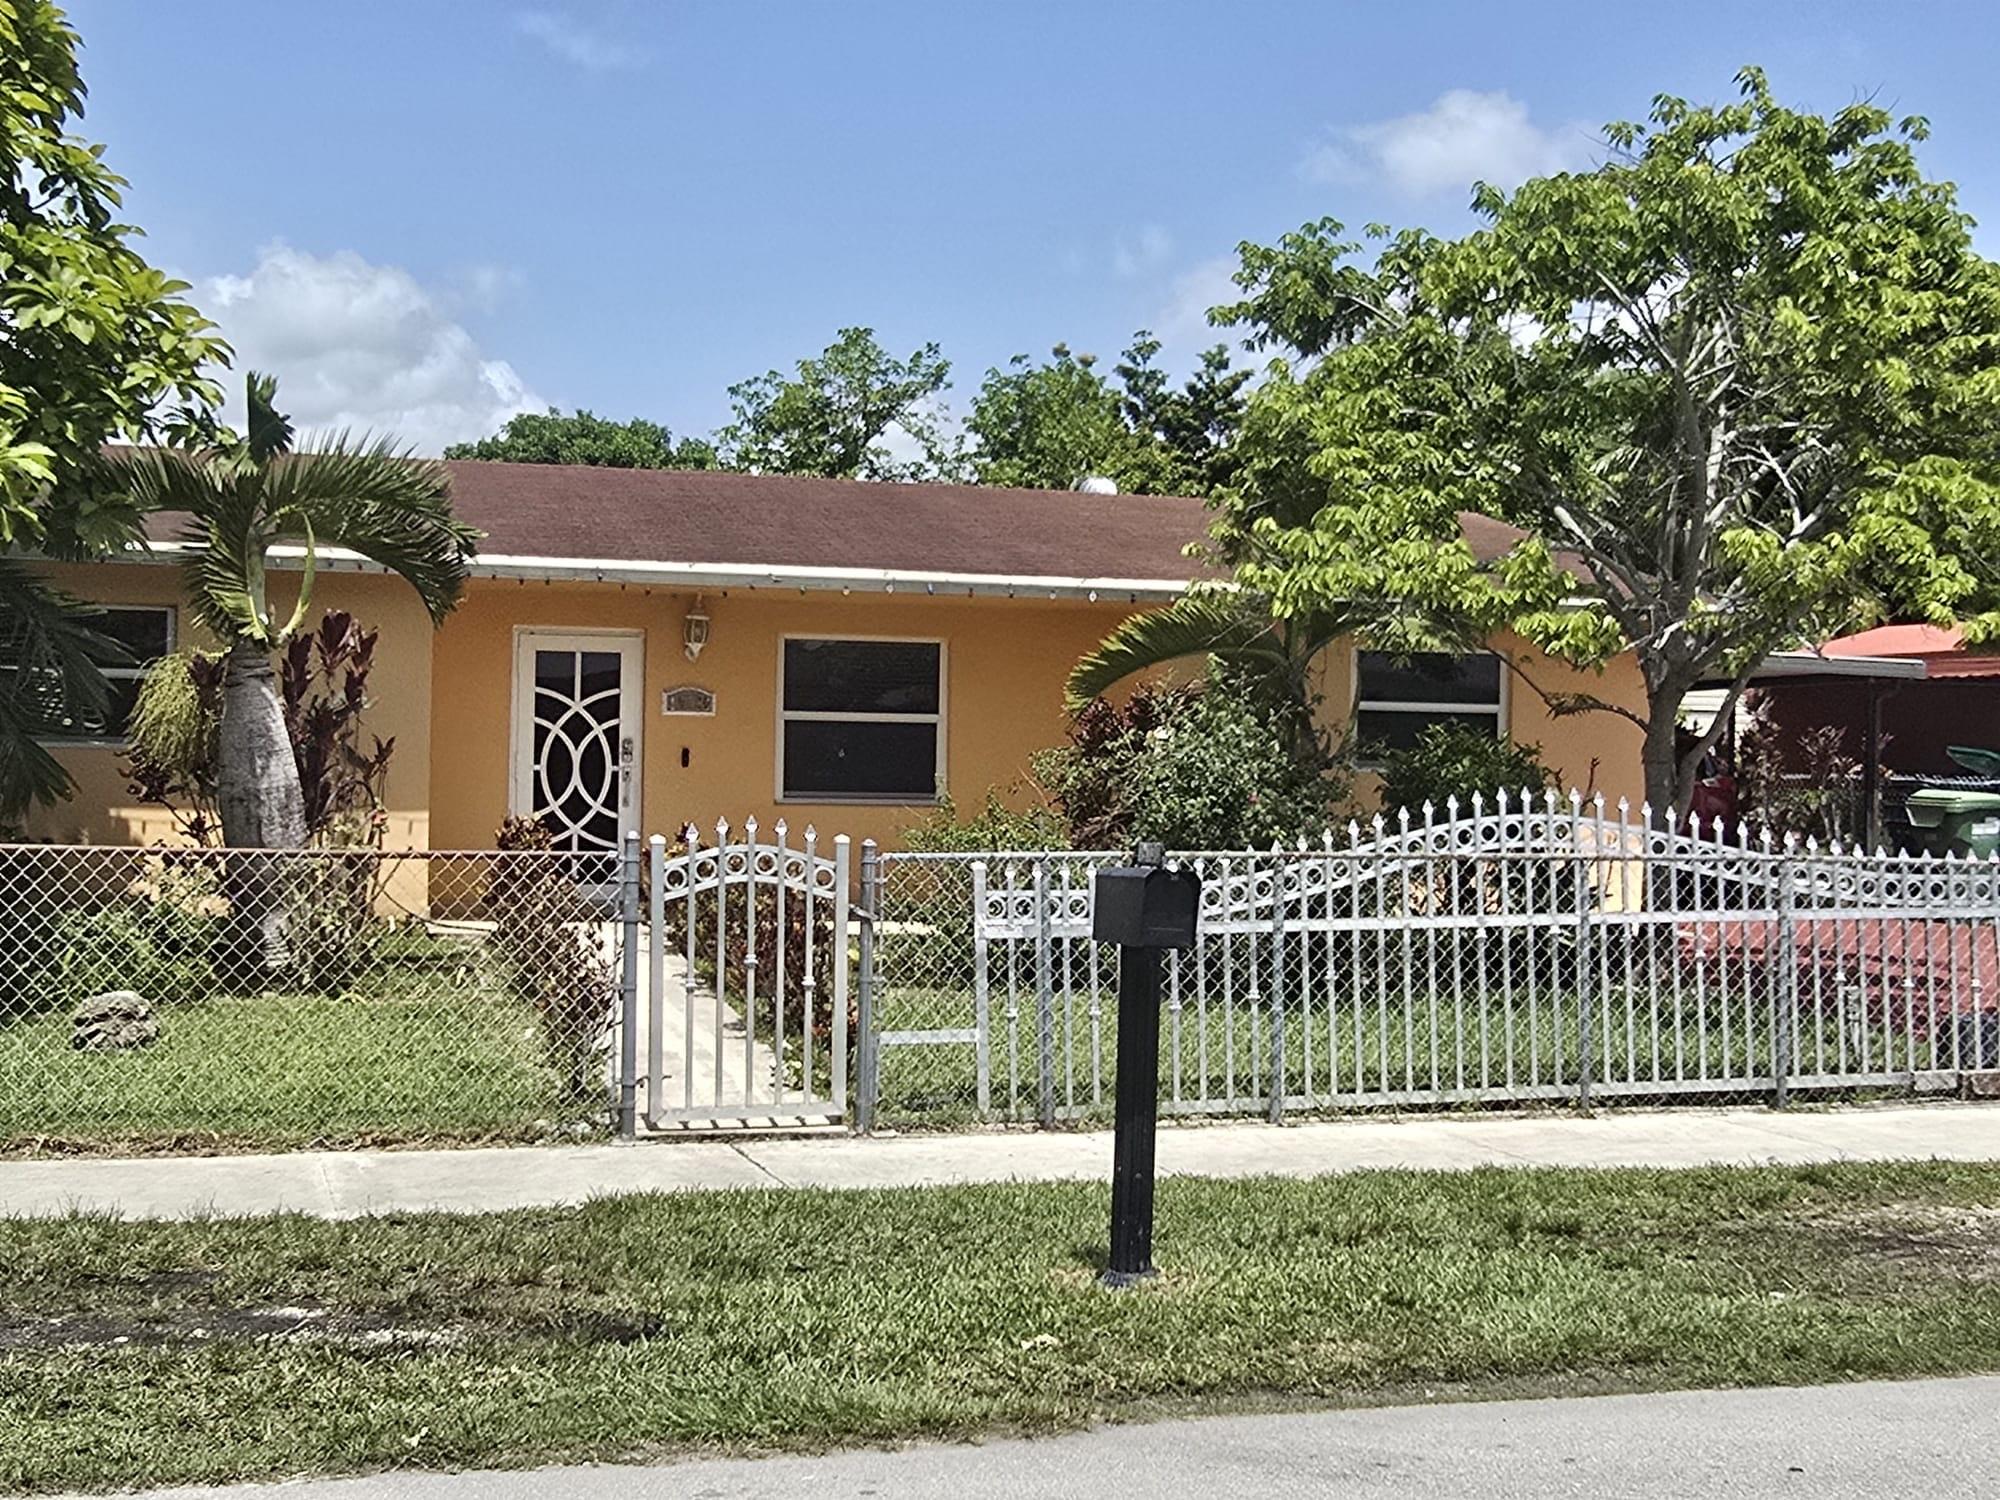
Active
$399,999
3
bds
|
1
ba
|
1,216
sqft
|
built
1963
10864 SW 222nd Dr, Miami, FL 33170
$-198
Cash flow
-2.6%
Cash-on-Cash Return
5.6%
Cap rate
0.7%
Rent to Value Ratio
6,122 out of 6,953 properties for sale in Miami, FL
Limited Results Shown
Create a free account, or log in to reveal all property listings and enjoy the complete experience.
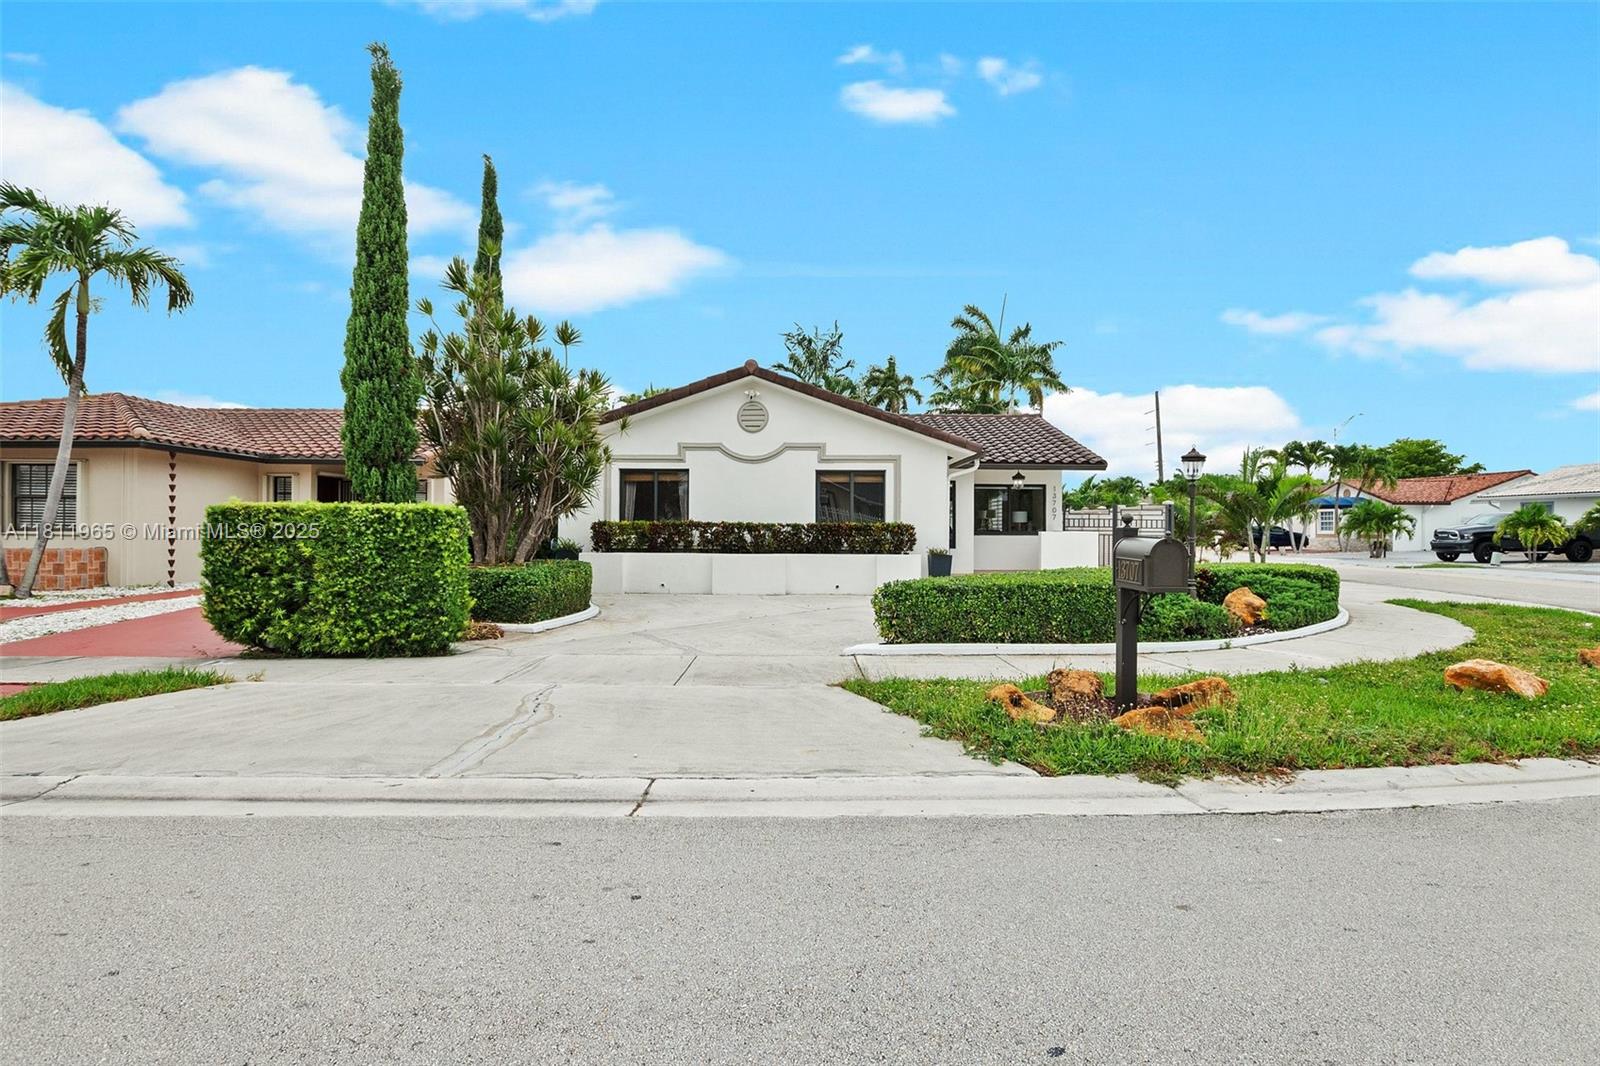
Pending
$675,000
4
bds
|
2
ba
|
1,630
sqft
|
built
1987
13707 SW 9th Ter, Miami, FL 33184
$-1,478
Cash flow
-11.4%
Cash-on-Cash Return
3.5%
Cap rate
0.5%
Rent to Value Ratio
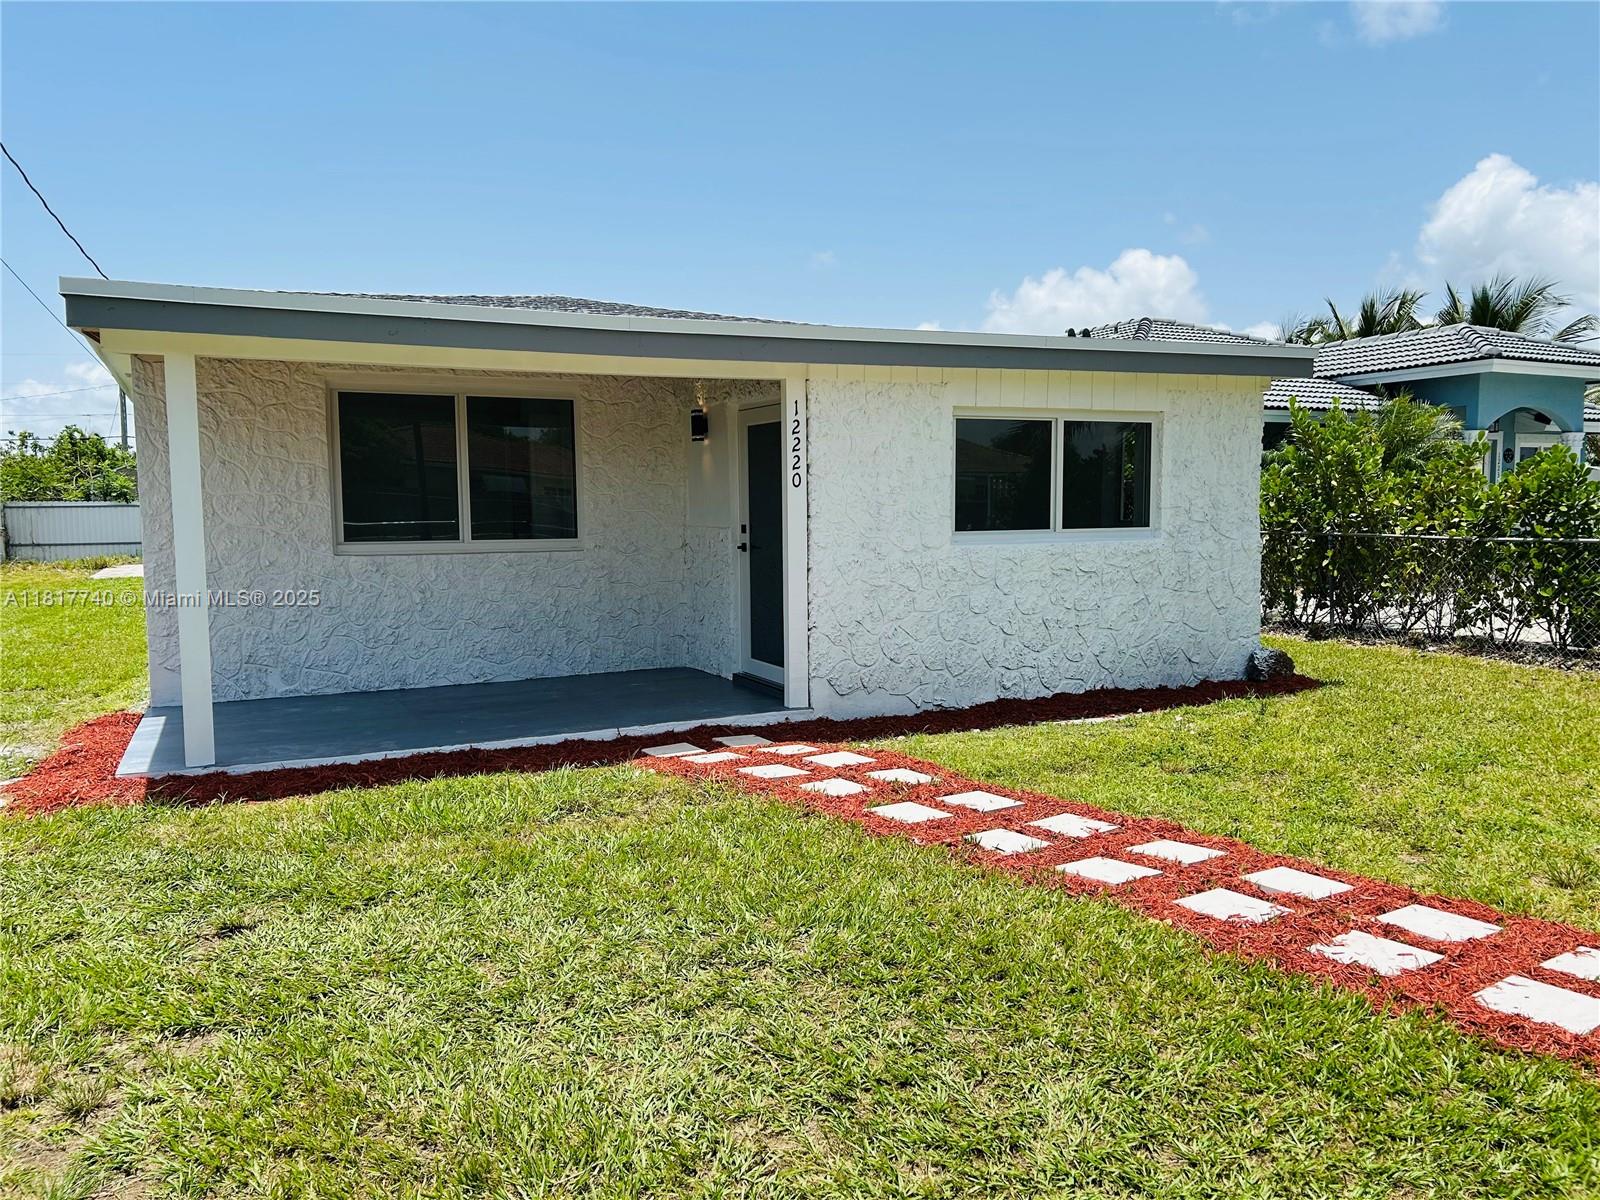
Active
$510,000
3
bds
|
2
ba
|
1,088
sqft
|
built
1959
12220 SW 216th St, Miami, FL 33170
$-1,316
Cash flow
-13.5%
Cash-on-Cash Return
3.0%
Cap rate
0.5%
Rent to Value Ratio
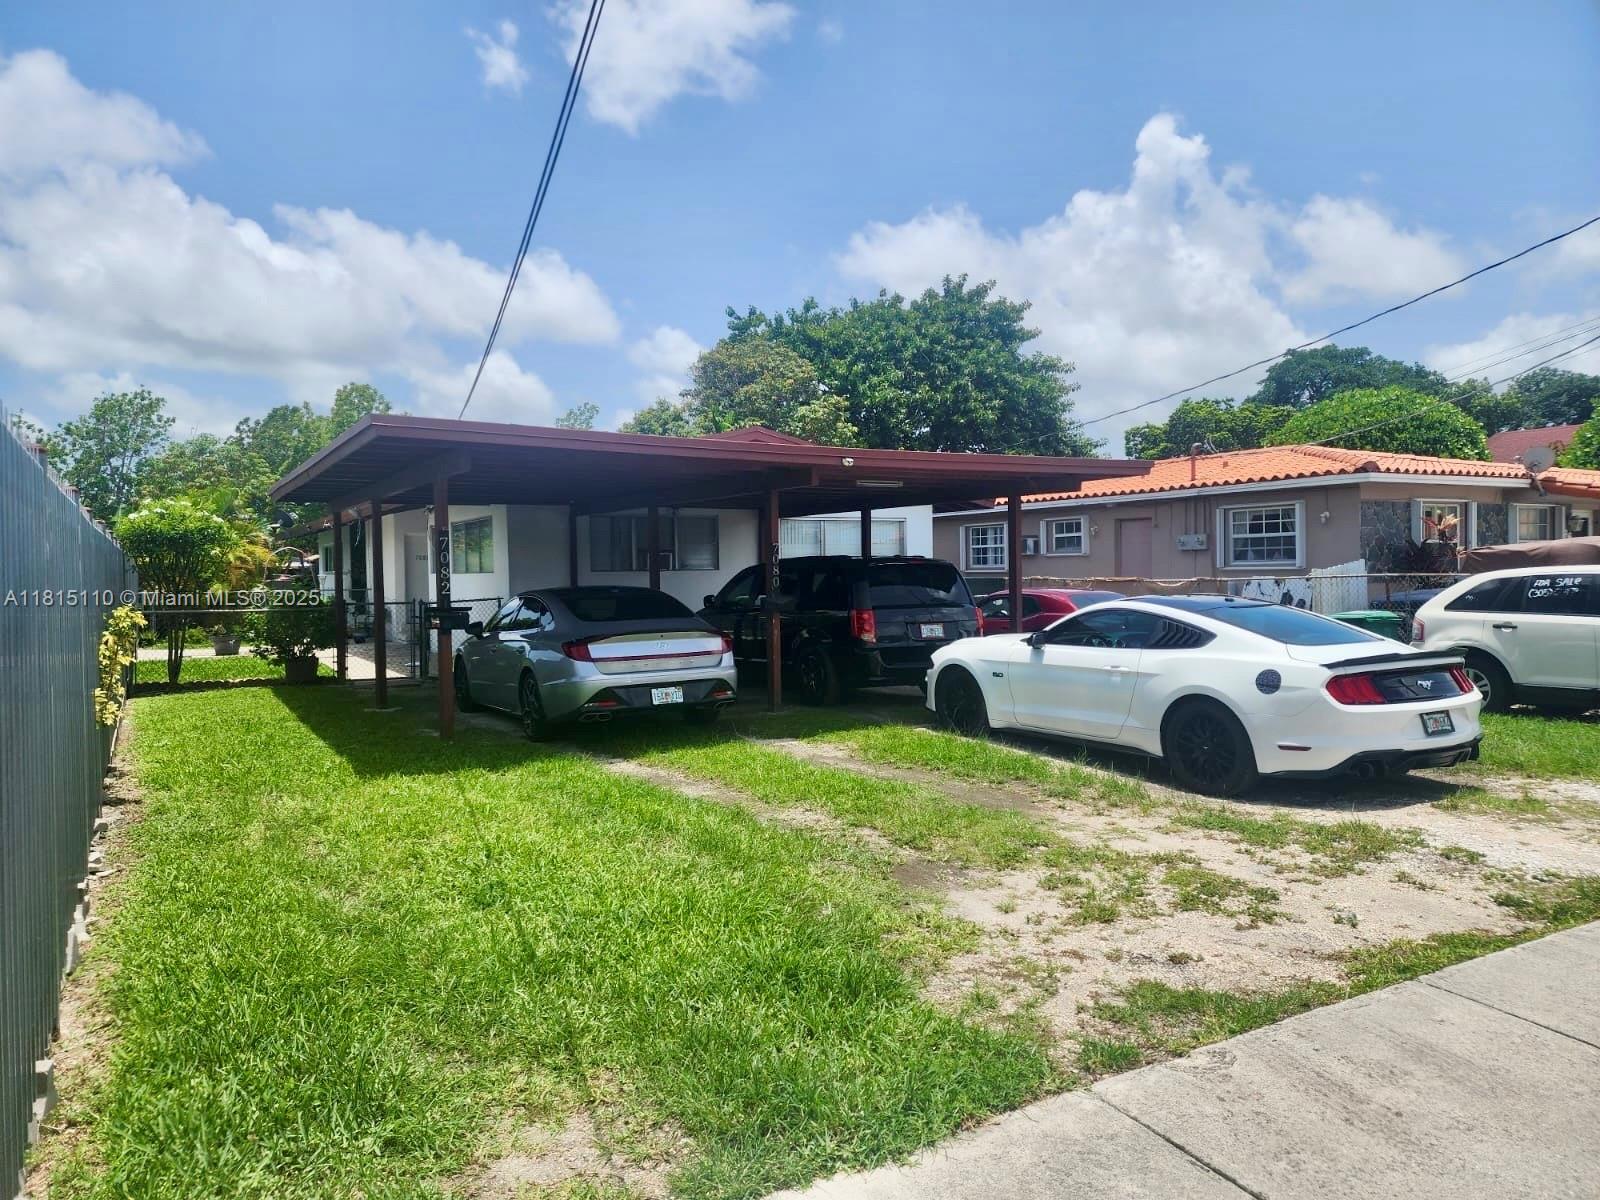
Active
$805,000
4
bds
|
0
ba
|
1,936
sqft
|
built
1959
7080 SW 22nd St, Miami, FL 33155
$-3,262
Cash flow
-21.1%
Cash-on-Cash Return
1.3%
Cap rate
0.3%
Rent to Value Ratio
Active
$255,000
3
bds
|
2
ba
|
1,040
sqft
|
built
1981
8420 SW 133rd Avenue Rd, Miami, FL 33183
$-467
Cash flow
-9.6%
Cash-on-Cash Return
3.9%
Cap rate
1.0%
Rent to Value Ratio
Active under contract
$459,900
2
bds
|
2
ba
|
1,045
sqft
|
built
2005
754 NE 90th St, Miami, FL 33138
$-809
Cash flow
-9.2%
Cash-on-Cash Return
4.0%
Cap rate
0.7%
Rent to Value Ratio
Active
$3,000,000
8
bds
|
0
ba
|
3,768
sqft
|
built
1960
251 NW 57th Ave, Miami, FL 33126
$-14,684
Cash flow
-25.5%
Cash-on-Cash Return
0.3%
Cap rate
0.1%
Rent to Value Ratio
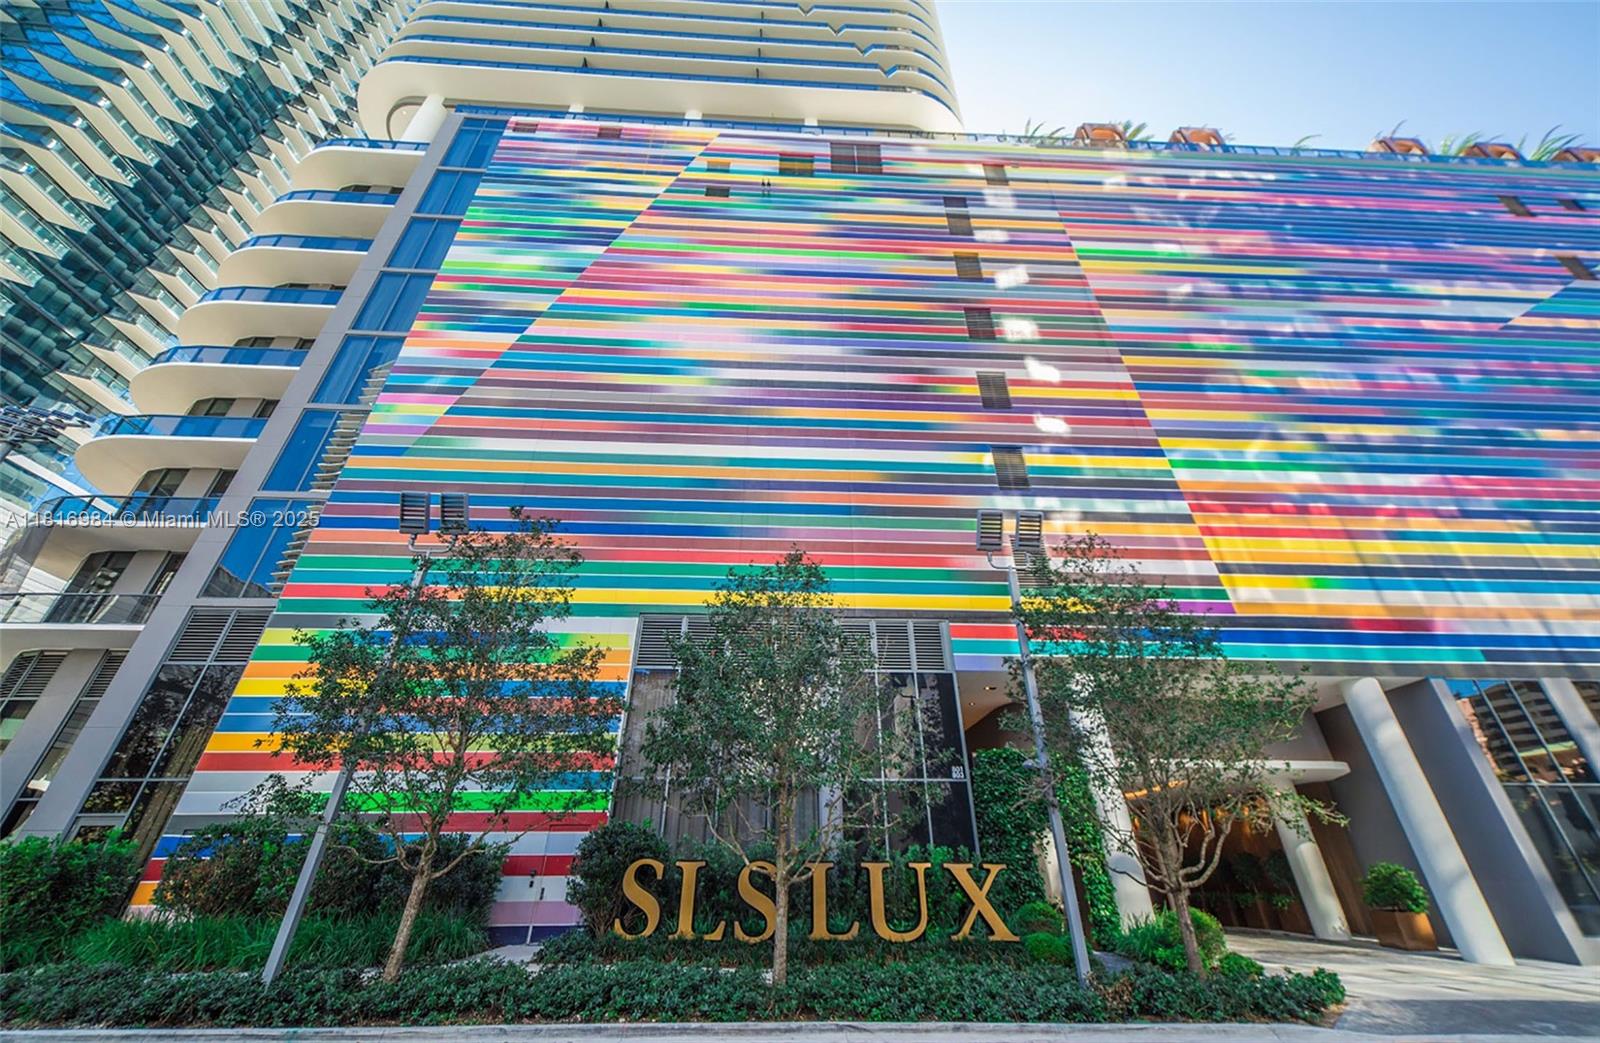
Active
$620,000
bds
|
1
ba
|
627
sqft
|
built
2018
801 S Miami Ave, Miami, FL 33130
$-2,720
Cash flow
-22.9%
Cash-on-Cash Return
0.9%
Cap rate
0.6%
Rent to Value Ratio
Active
$735,000
3
bds
|
2
ba
|
1,557
sqft
|
built
1960
11170 SW 62nd Ter, Miami, FL 33173
$-1,767
Cash flow
-12.5%
Cash-on-Cash Return
3.3%
Cap rate
0.5%
Rent to Value Ratio
Active under contract
$960,000
5
bds
|
3
ba
|
2,238
sqft
|
built
1980
10711 SW 70th St, Miami, FL 33173
$-2,767
Cash flow
-15.0%
Cash-on-Cash Return
2.7%
Cap rate
0.5%
Rent to Value Ratio

Active
$579,900
3
bds
|
2
ba
|
1,636
sqft
|
built
1999
15451 SW 177th Ter, Miami, FL 33187
$-1,288
Cash flow
-11.6%
Cash-on-Cash Return
3.5%
Cap rate
0.6%
Rent to Value Ratio
Pending
$379,000
3
bds
|
1
ba
|
1,077
sqft
|
built
1952
1151 NW 112th St, Miami, FL 33168
$-54
Cash flow
-0.7%
Cash-on-Cash Return
6.0%
Cap rate
0.8%
Rent to Value Ratio
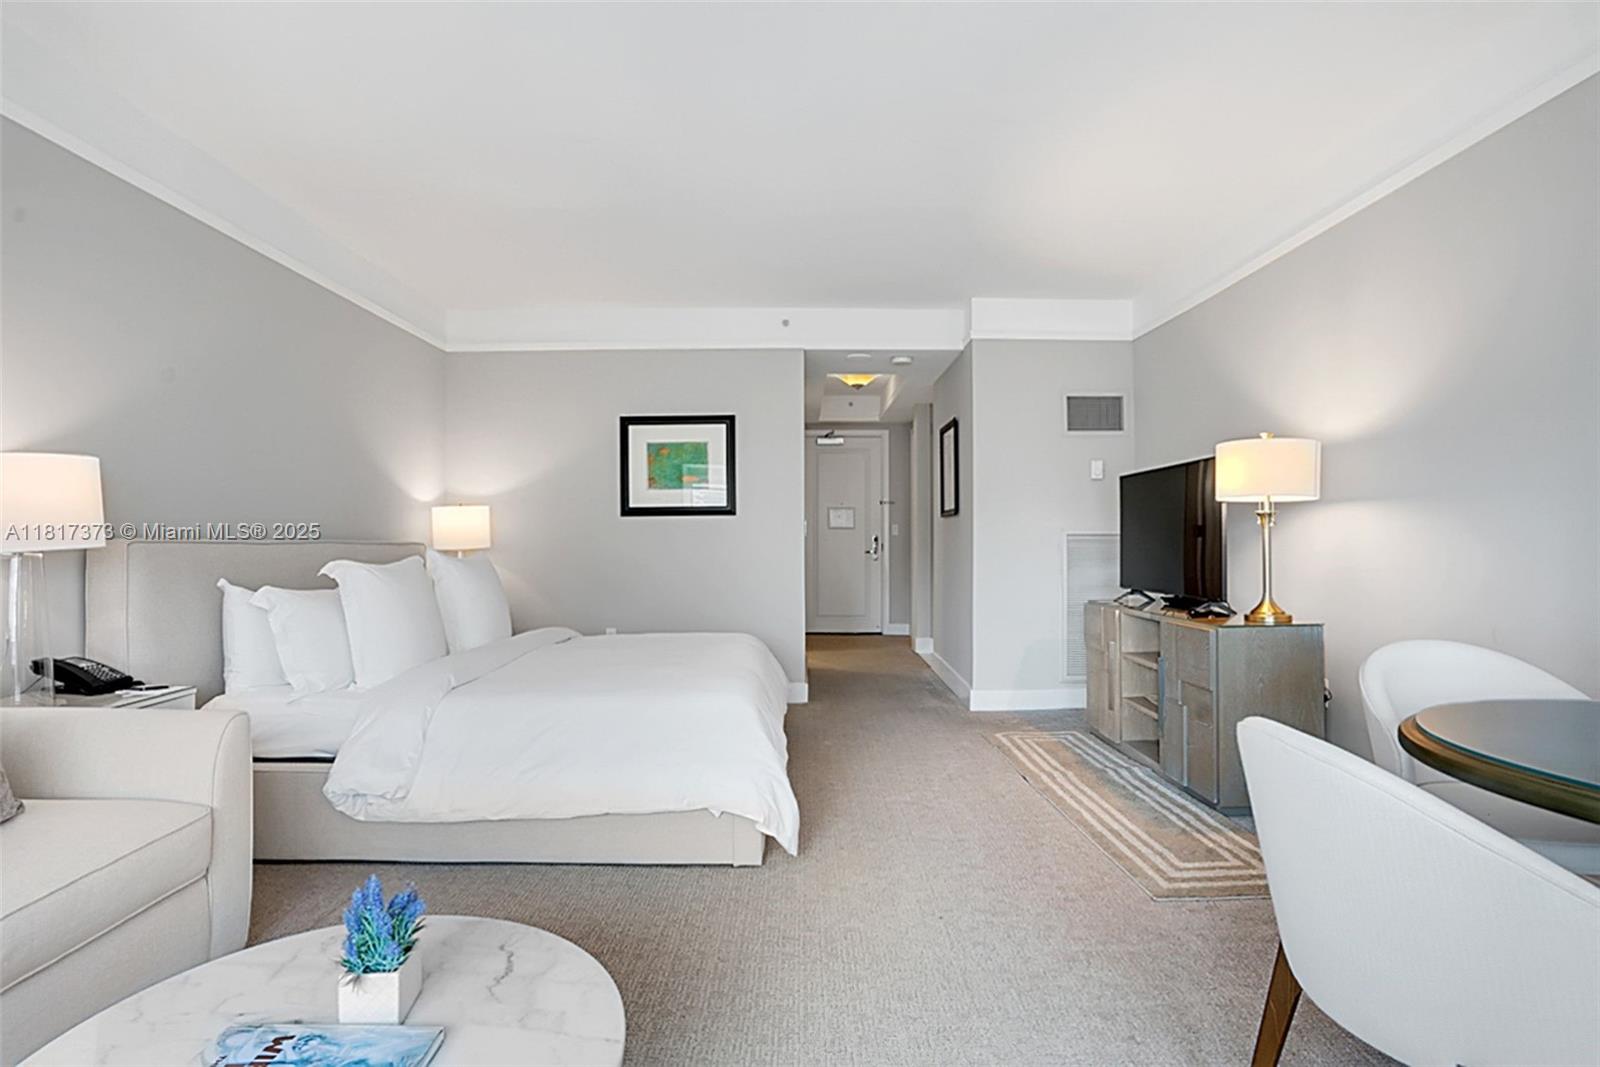
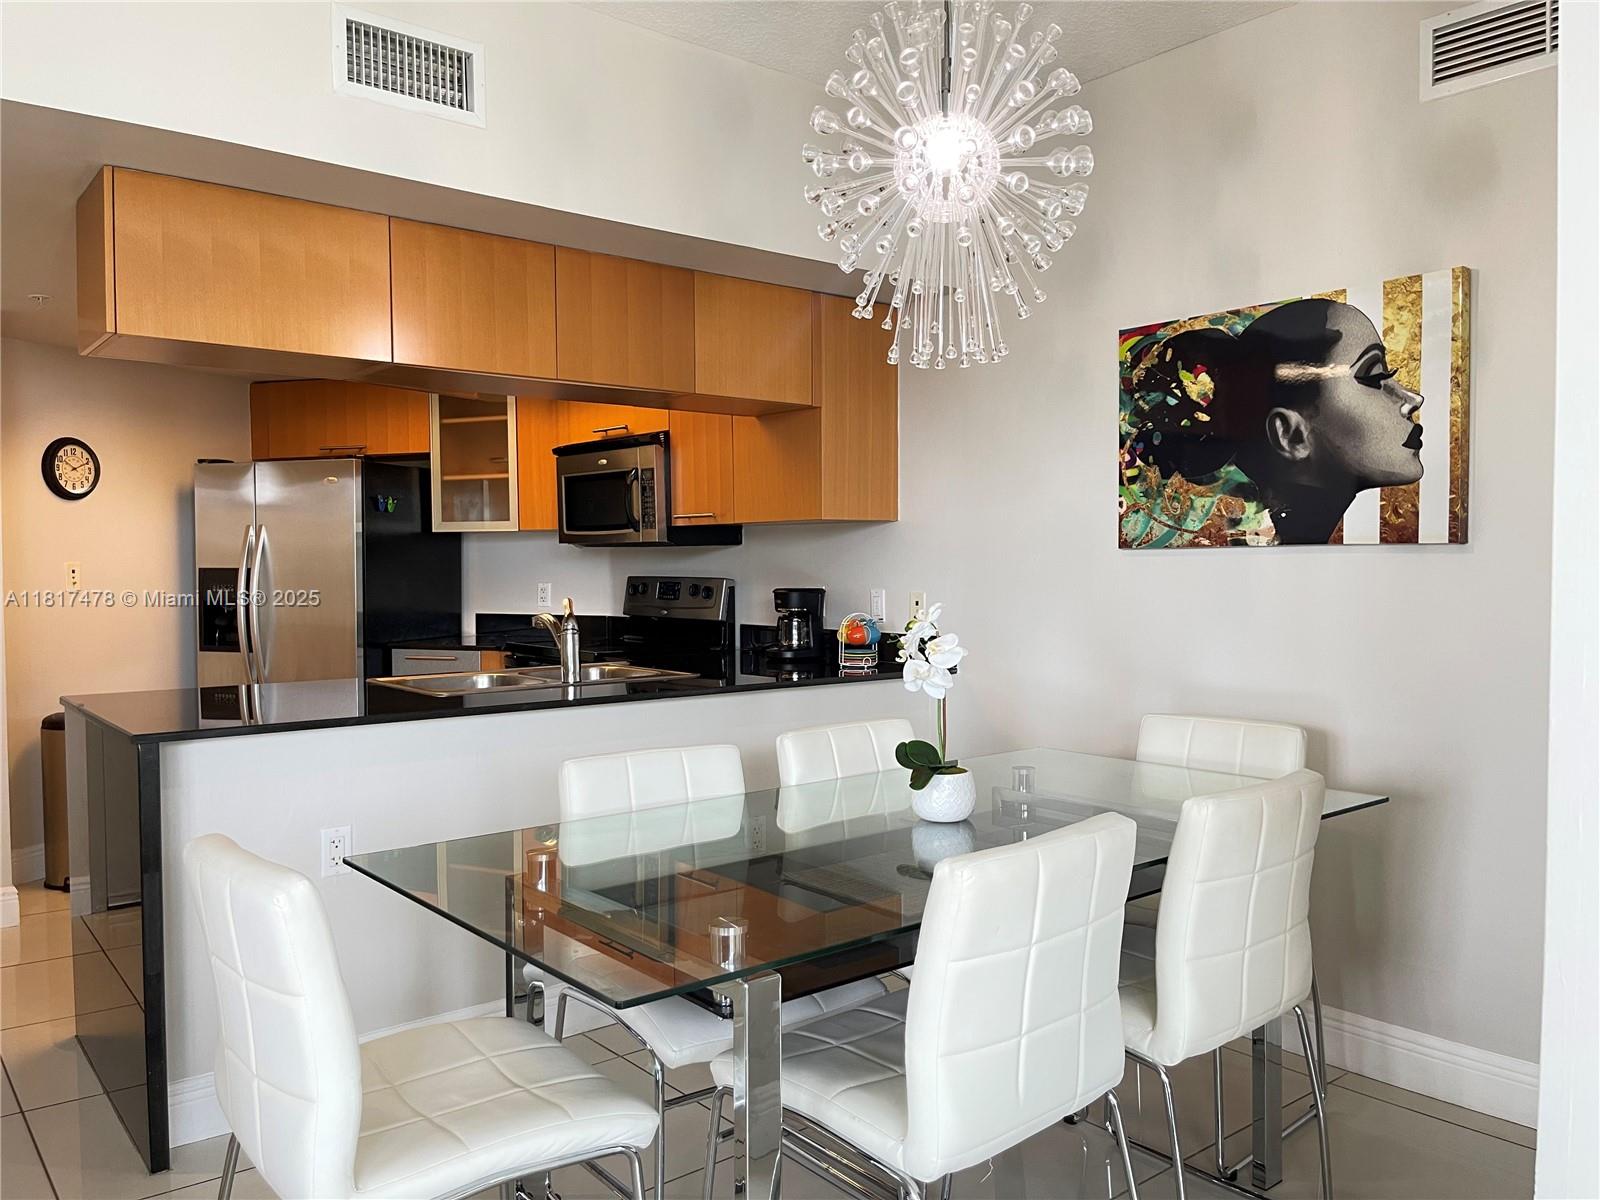
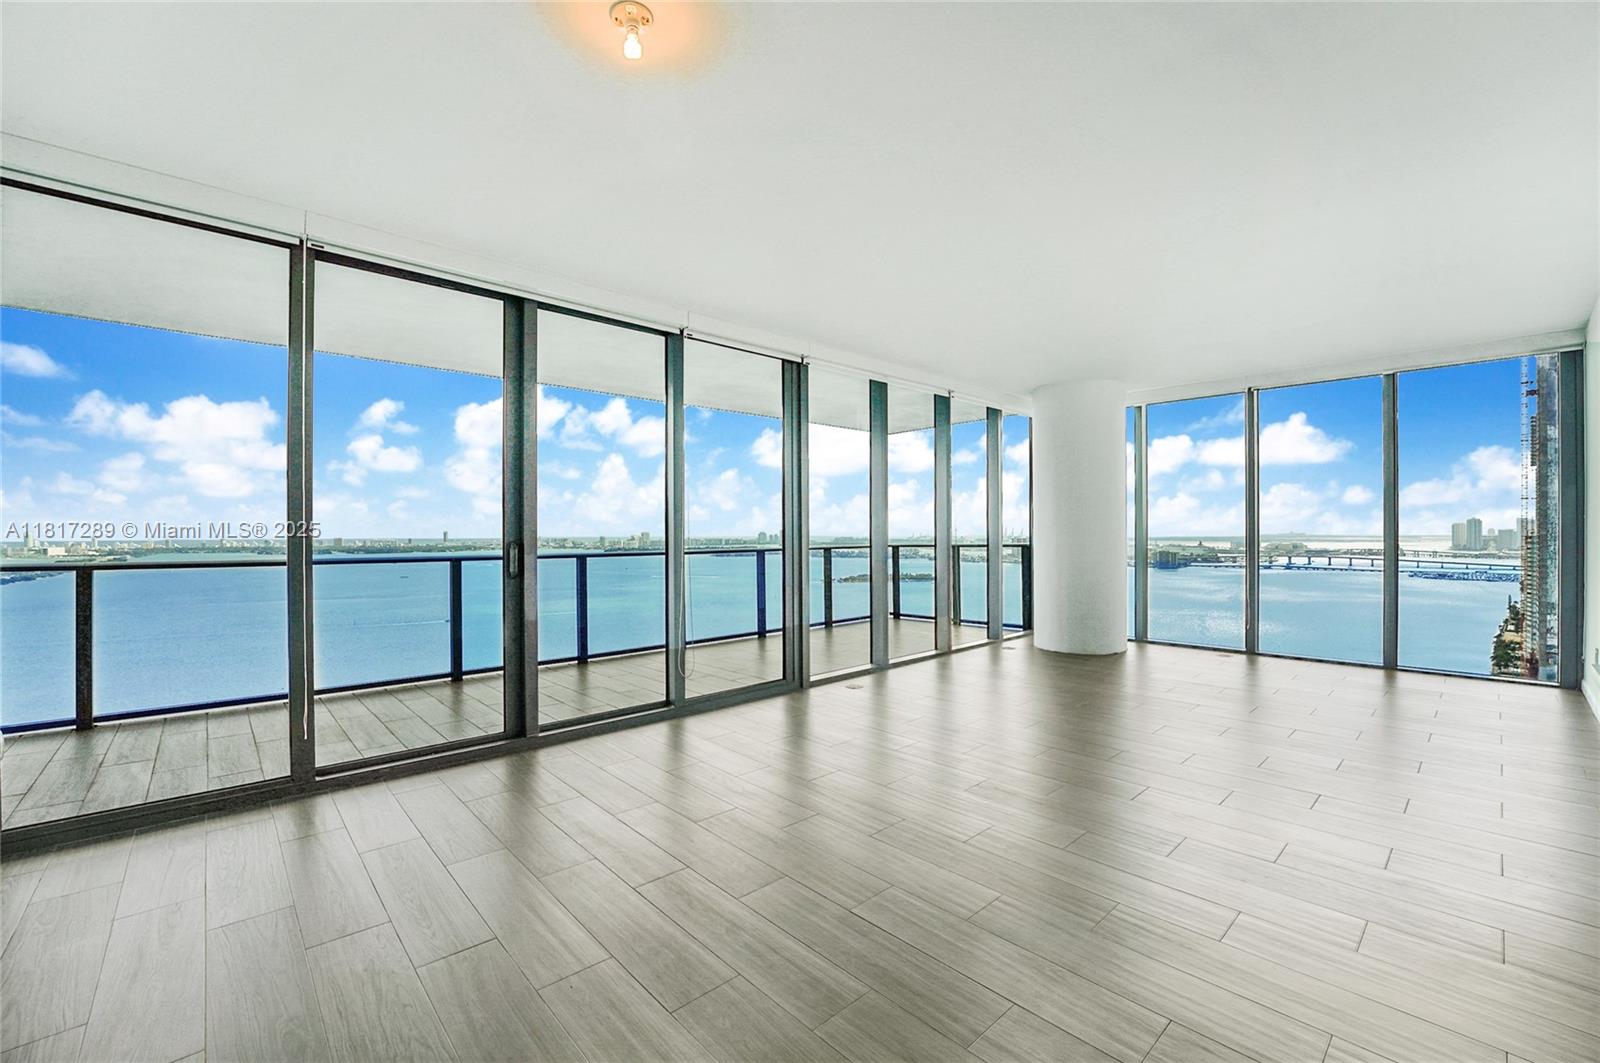
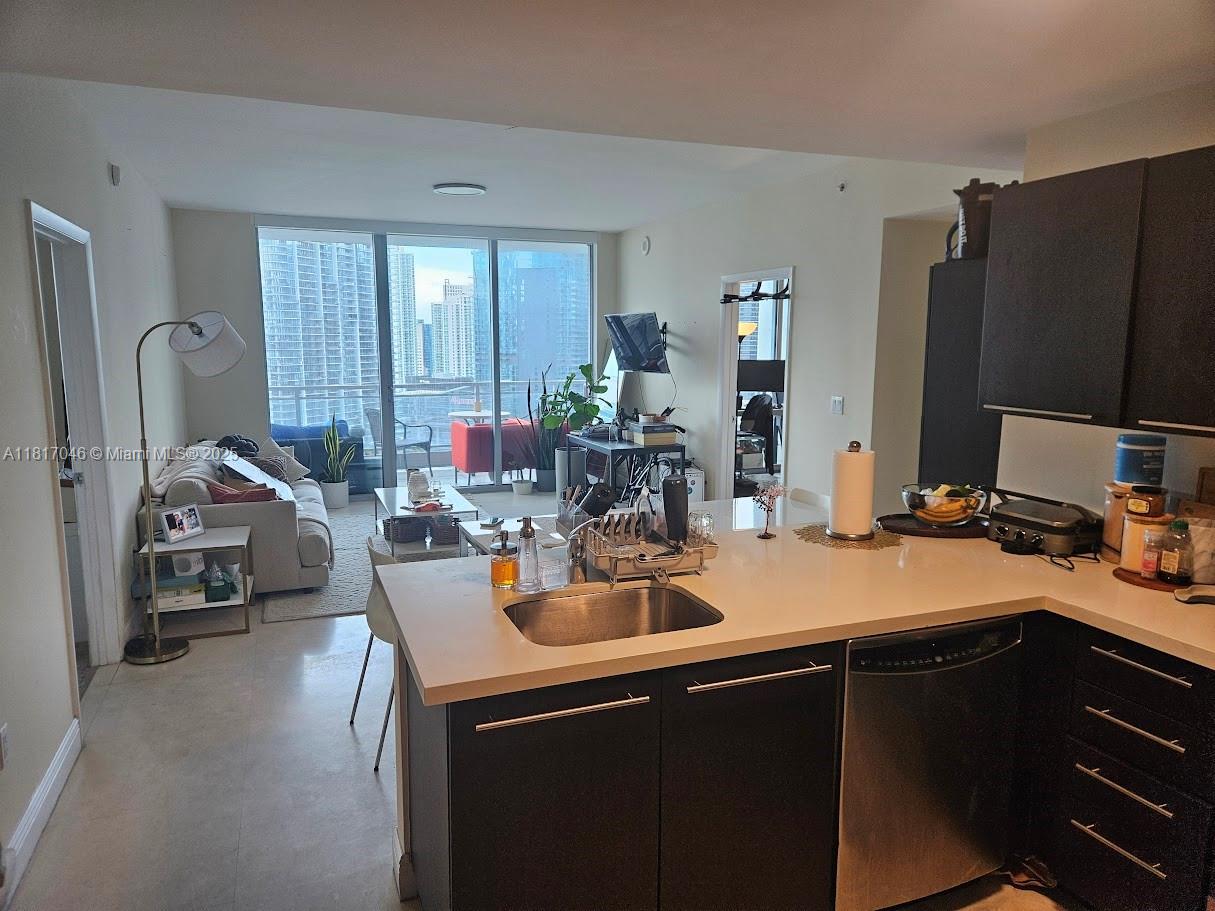
Active
$940,000
bds
|
1
ba
|
624
sqft
|
built
2003
1435 Brickell Ave, Miami, FL 33131
$-2,655
Cash flow
-14.7%
Cash-on-Cash Return
2.8%
Cap rate
0.7%
Rent to Value Ratio
Active
$485,000
2
bds
|
2
ba
|
1,048
sqft
|
built
2007
1750 N Bayshore Dr, Miami, FL 33132
$-1,753
Cash flow
-18.9%
Cash-on-Cash Return
1.8%
Cap rate
0.7%
Rent to Value Ratio
Active
$1,850,000
3
bds
|
4
ba
|
1,634
sqft
|
built
2018
3131 NE 7th Ave, Miami, FL 33137
$-6,430
Cash flow
-18.1%
Cash-on-Cash Return
2.0%
Cap rate
0.6%
Rent to Value Ratio
Active
$399,999
3
bds
|
1
ba
|
1,216
sqft
|
built
1963
10864 SW 222nd Dr, Miami, FL 33170
$-198
Cash flow
-2.6%
Cash-on-Cash Return
5.6%
Cap rate
0.7%
Rent to Value Ratio
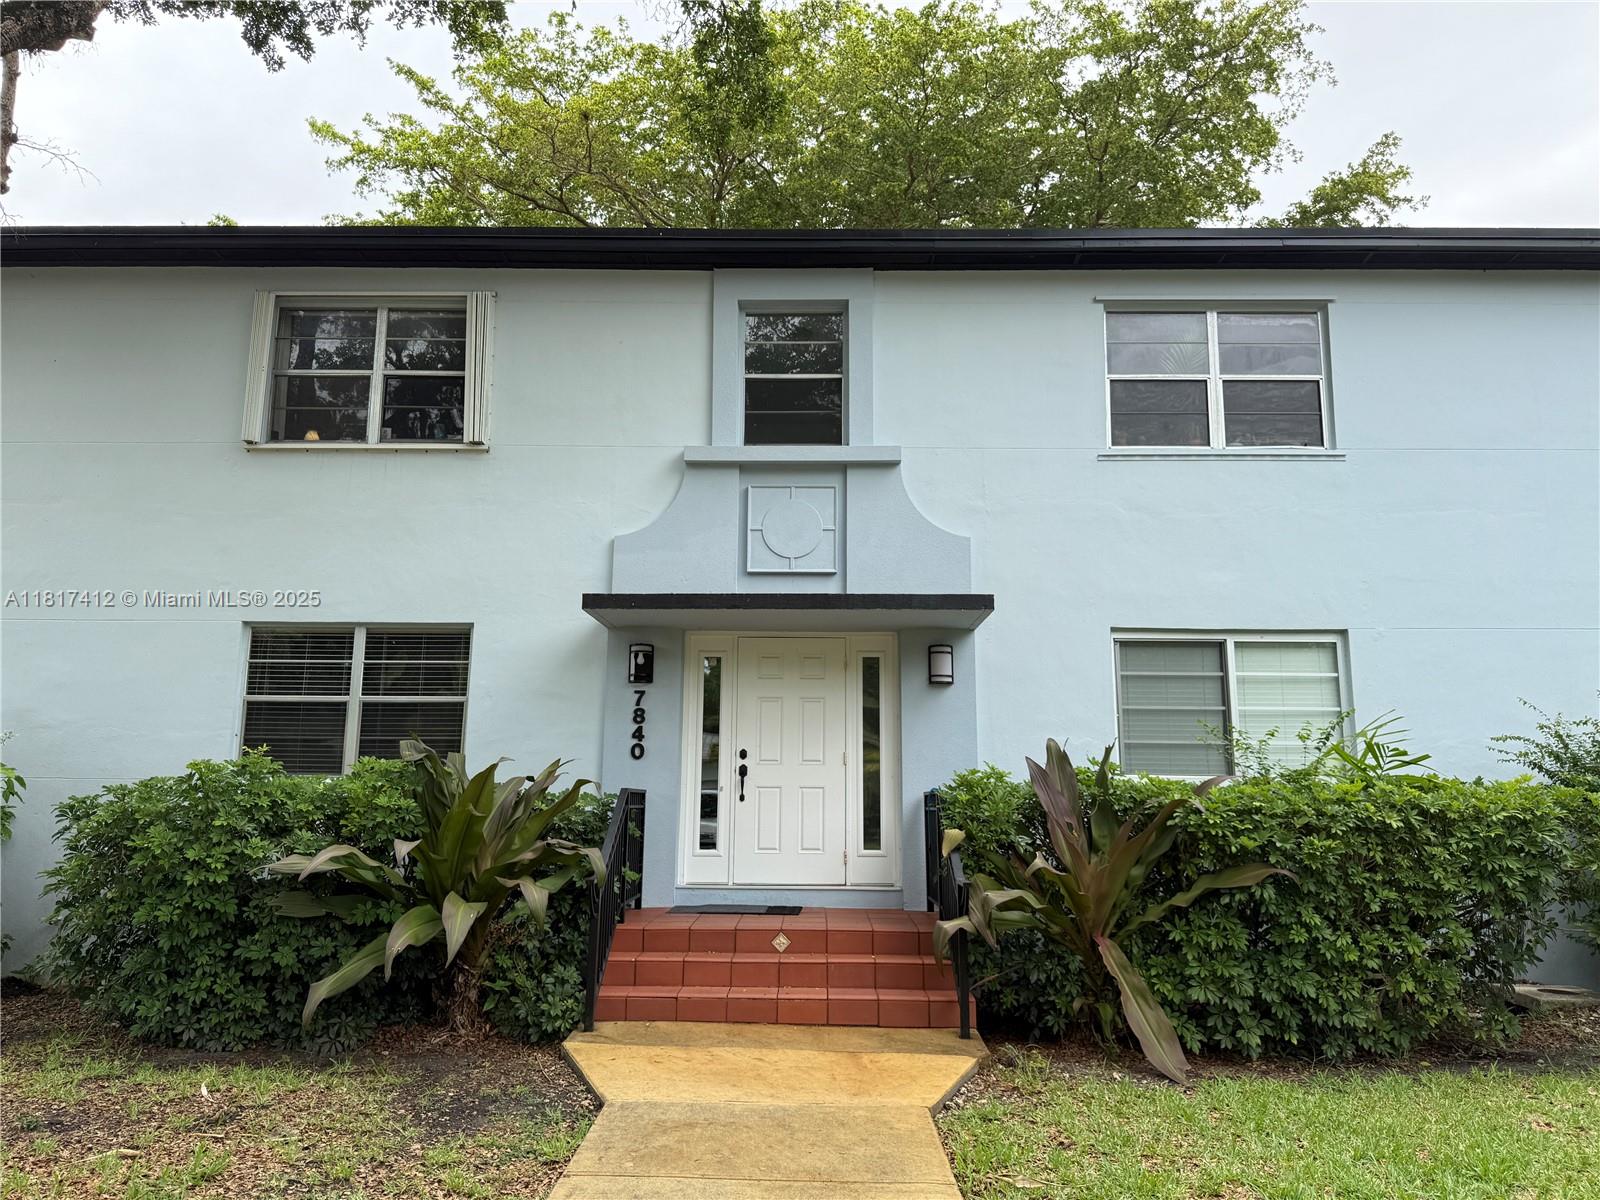
Active
$410,000
2
bds
|
1
ba
|
800
sqft
|
built
1950
7840 SW 55th Ave, Miami, FL 33143
$-1,293
Cash flow
-16.5%
Cash-on-Cash Return
2.4%
Cap rate
0.6%
Rent to Value Ratio
Active
$710,000
4
bds
|
2
ba
|
1,651
sqft
|
built
1978
10471 SW 174th Ter, Miami, FL 33157
$-1,932
Cash flow
-14.2%
Cash-on-Cash Return
2.9%
Cap rate
0.4%
Rent to Value Ratio
Active
$460,000
1
bds
|
2
ba
|
838
sqft
|
built
2008
1900 N Bayshore Dr, Miami, FL 33132
$-1,788
Cash flow
-20.3%
Cash-on-Cash Return
1.5%
Cap rate
0.6%
Rent to Value Ratio
Active
$775,000
1
bds
|
1
ba
|
876
sqft
|
built
2009
485 Brickell Ave, Miami, FL 33131
$-3,795
Cash flow
-25.5%
Cash-on-Cash Return
0.3%
Cap rate
0.6%
Rent to Value Ratio
Active
$340,000
1
bds
|
1
ba
|
646
sqft
|
built
2007
133 NE 2nd Ave, Miami, FL 33132
$-1,290
Cash flow
-19.8%
Cash-on-Cash Return
1.6%
Cap rate
0.7%
Rent to Value Ratio
Active
$960,000
2
bds
|
1
ba
|
1,039
sqft
|
built
1949
3241 SW 20th St, Miami, FL 33145
$-2,871
Cash flow
-15.6%
Cash-on-Cash Return
2.6%
Cap rate
0.4%
Rent to Value Ratio
Active
$650,000
3
bds
|
2
ba
|
1,328
sqft
|
built
1926
1262 SW 4th St, Miami, FL 33135
$-1,763
Cash flow
-14.2%
Cash-on-Cash Return
2.9%
Cap rate
0.5%
Rent to Value Ratio
Active
$599,900
3
bds
|
2
ba
|
1,474
sqft
|
built
1973
19130 SW 121st Ave, Miami, FL 33177
$-1,014
Cash flow
-8.8%
Cash-on-Cash Return
4.1%
Cap rate
0.5%
Rent to Value Ratio
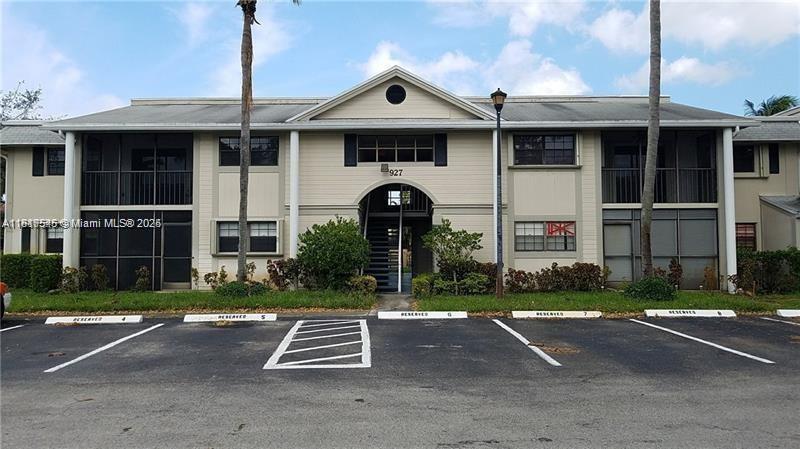
Active
$235,000
2
bds
|
2
ba
|
835
sqft
|
built
1987
927 NE 199th St, Miami, FL 33179
$-557
Cash flow
-12.4%
Cash-on-Cash Return
3.3%
Cap rate
1.0%
Rent to Value Ratio
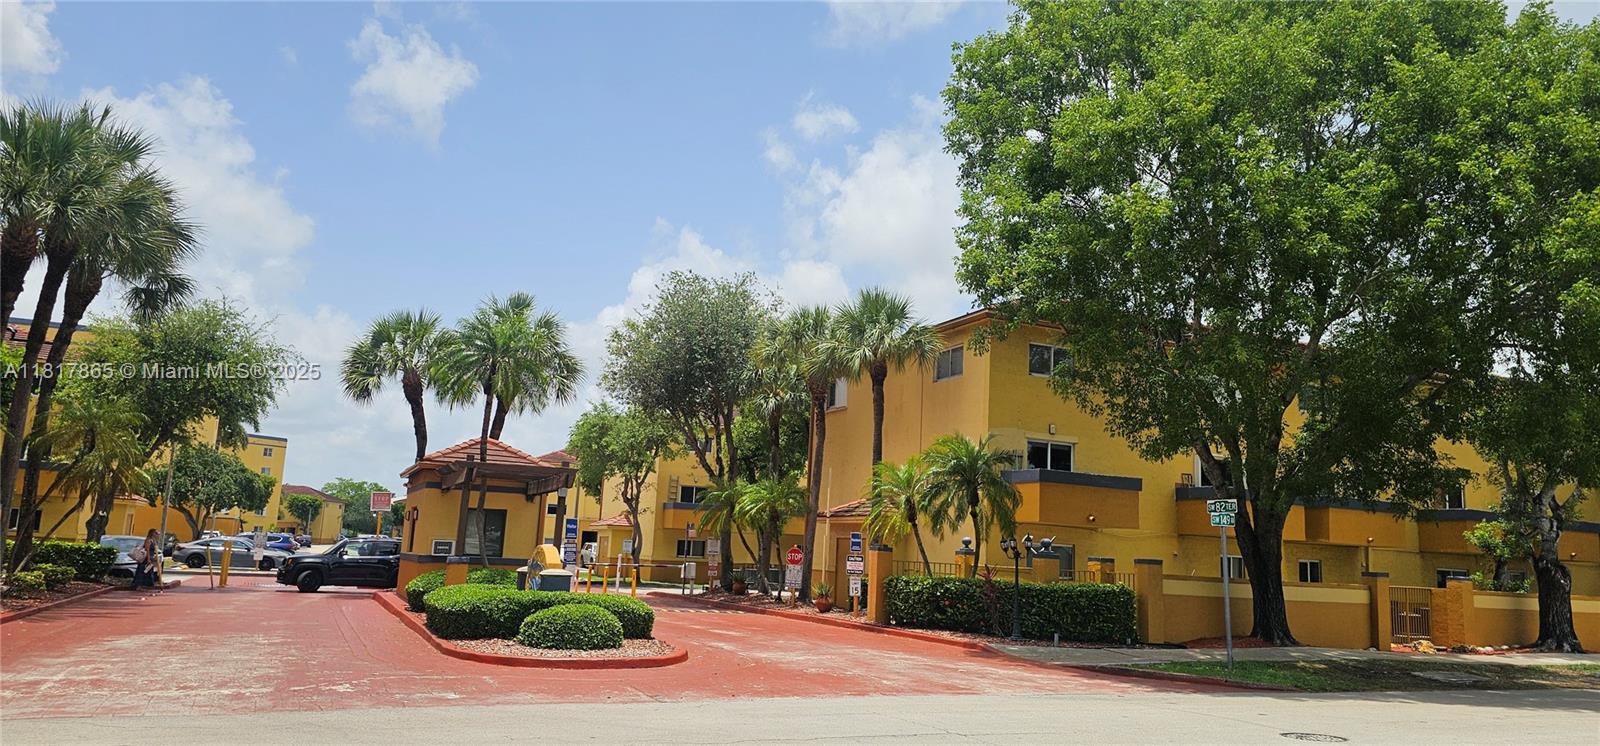
Active
$350,000
3
bds
|
2
ba
|
1,260
sqft
|
built
1991
14921 SW 82nd Ln, Miami, FL 33193
$-206
Cash flow
-3.1%
Cash-on-Cash Return
5.4%
Cap rate
0.8%
Rent to Value Ratio
Active
$515,000
2
bds
|
2
ba
|
1,335
sqft
|
built
2006
20000 E Country Club Dr, Miami, FL 33180
$-1,412
Cash flow
-14.3%
Cash-on-Cash Return
2.9%
Cap rate
0.8%
Rent to Value Ratio
Active
$655,000
3
bds
|
2
ba
|
1,350
sqft
|
built
1987
11861 SW 92nd Ln, Miami, FL 33186
$-1,158
Cash flow
-9.2%
Cash-on-Cash Return
4.0%
Cap rate
0.5%
Rent to Value Ratio
Active
$509,000
1
bds
|
1
ba
|
442
sqft
|
built
2022
398 NE 5th St, Miami, FL 33132
$-1,573
Cash flow
-16.1%
Cash-on-Cash Return
2.4%
Cap rate
0.8%
Rent to Value Ratio

Active
$995,000
3
bds
|
2
ba
|
2,240
sqft
|
built
1973
9728 SW 135th Ter, Miami, FL 33176
$-2,132
Cash flow
-11.2%
Cash-on-Cash Return
3.6%
Cap rate
0.5%
Rent to Value Ratio
Active
$980,000
2
bds
|
3
ba
|
2,240
sqft
|
built
1991
3802 NE 207th St, Miami, FL 33180
$-3,424
Cash flow
-18.2%
Cash-on-Cash Return
2.0%
Cap rate
0.7%
Rent to Value Ratio
Active
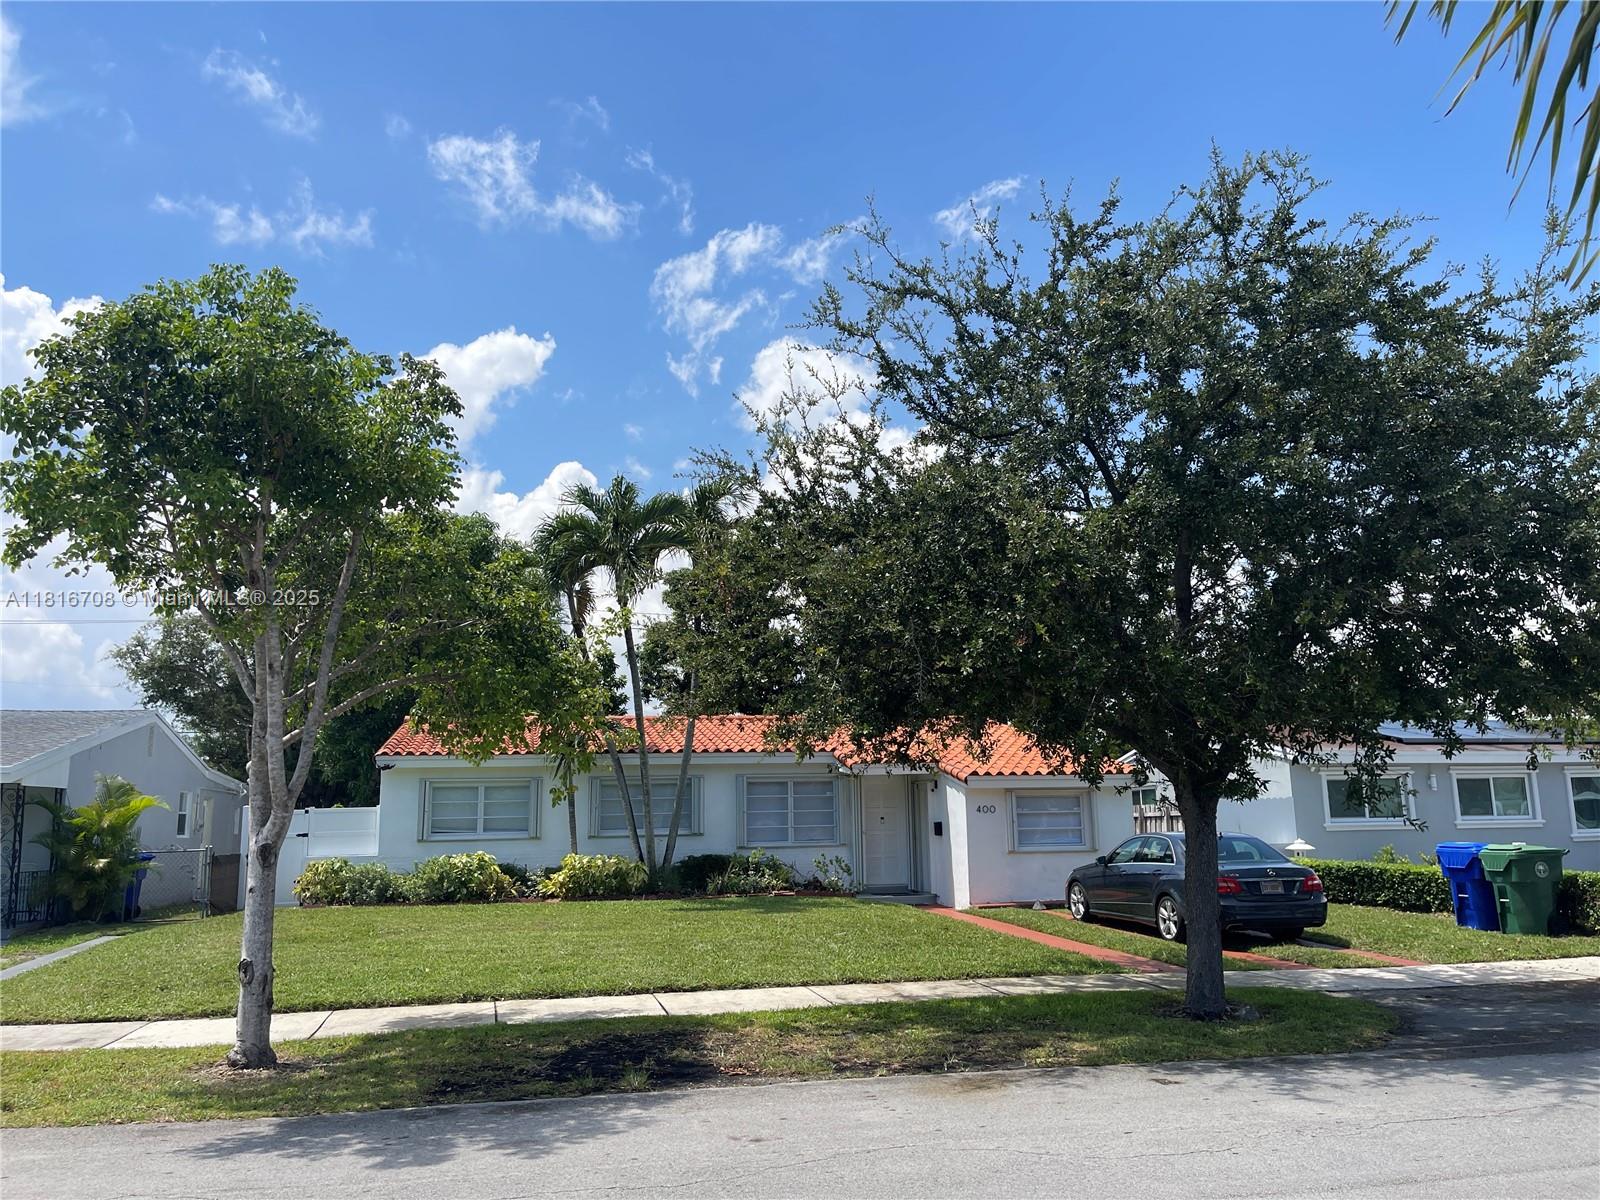
$759,900
4
bds
|
2
ba
|
1,544
sqft
|
built
1955
400 NW 56th Ave, Miami, FL 33126
$-2,415
Cash flow
-16.6%
Cash-on-Cash Return
2.3%
Cap rate
0.4%
Rent to Value Ratio
Active
$595,000
2
bds
|
2
ba
|
1,093
sqft
|
built
2008
90 SW 3rd St, Miami, FL 33130
$-1,913
Cash flow
-16.8%
Cash-on-Cash Return
2.3%
Cap rate
0.7%
Rent to Value Ratio
Active
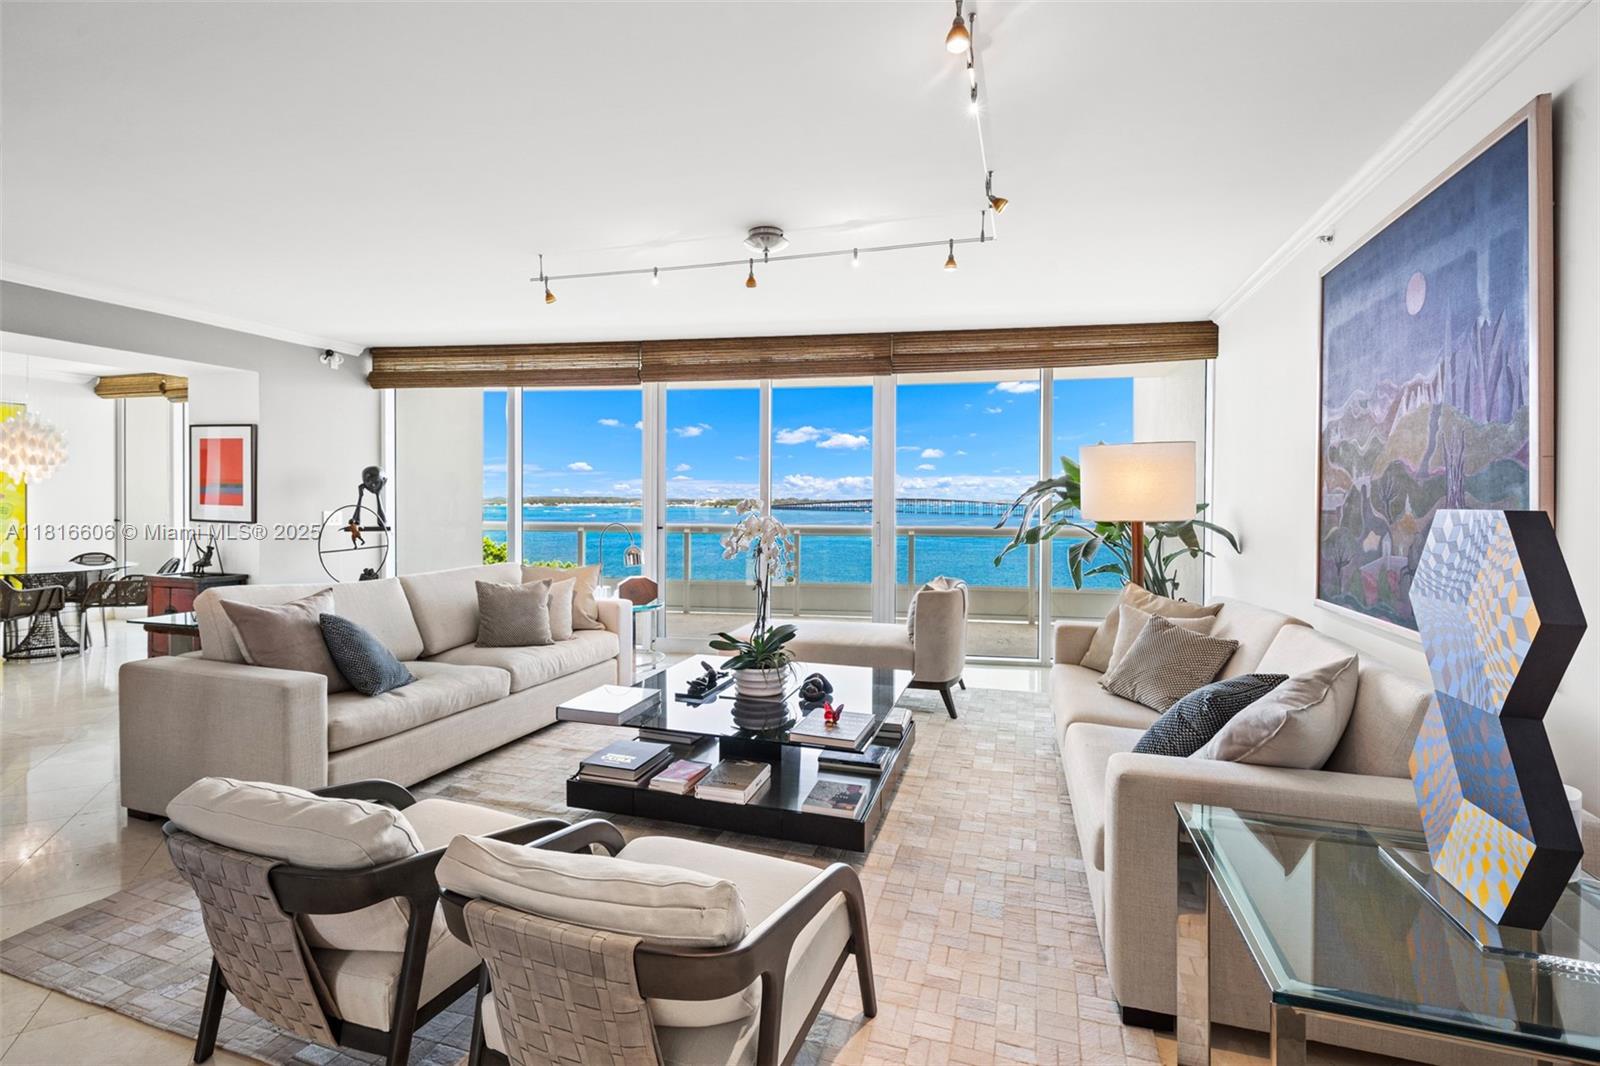
$2,575,000
2
bds
|
4
ba
|
2,580
sqft
|
built
1997
1643 Brickell Ave, Miami, FL 33129
$-13,630
Cash flow
-27.6%
Cash-on-Cash Return
-0.2%
Cap rate
0.3%
Rent to Value Ratio
Active
$260,000
2
bds
|
1
ba
|
801
sqft
|
built
1972
677 SW 9th Ave, Miami, FL 33130
$-532
Cash flow
-10.7%
Cash-on-Cash Return
3.7%
Cap rate
0.9%
Rent to Value Ratio
Active
$950,000
4
bds
|
3
ba
|
2,061
sqft
|
built
1949
1931 Coral Gate Dr, Miami, FL 33145
$-1,678
Cash flow
-9.2%
Cash-on-Cash Return
4.0%
Cap rate
0.5%
Rent to Value Ratio
Active
$925,000
4
bds
|
2
ba
|
0
sqft
|
built
1979
10421 SW 128th Ave, Miami, FL 33186
$-2,733
Cash flow
-15.4%
Cash-on-Cash Return
2.6%
Cap rate
0.4%
Rent to Value Ratio
Active
$195,000
1
bds
|
2
ba
|
773
sqft
|
built
1981
8635 NW 8th St, Miami, FL 33126
$-232
Cash flow
-6.2%
Cash-on-Cash Return
4.7%
Cap rate
1.0%
Rent to Value Ratio
Active
$559,900
4
bds
|
2
ba
|
1,417
sqft
|
built
2006
6721 NW 5th Ave, Miami, FL 33150
$-1,137
Cash flow
-10.6%
Cash-on-Cash Return
3.7%
Cap rate
0.5%
Rent to Value Ratio
Active
$440,000
1
bds
|
1
ba
|
752
sqft
|
built
2018
1600 NE 1st Ave, Miami, FL 33132
$-1,775
Cash flow
-21.0%
Cash-on-Cash Return
1.3%
Cap rate
0.6%
Rent to Value Ratio

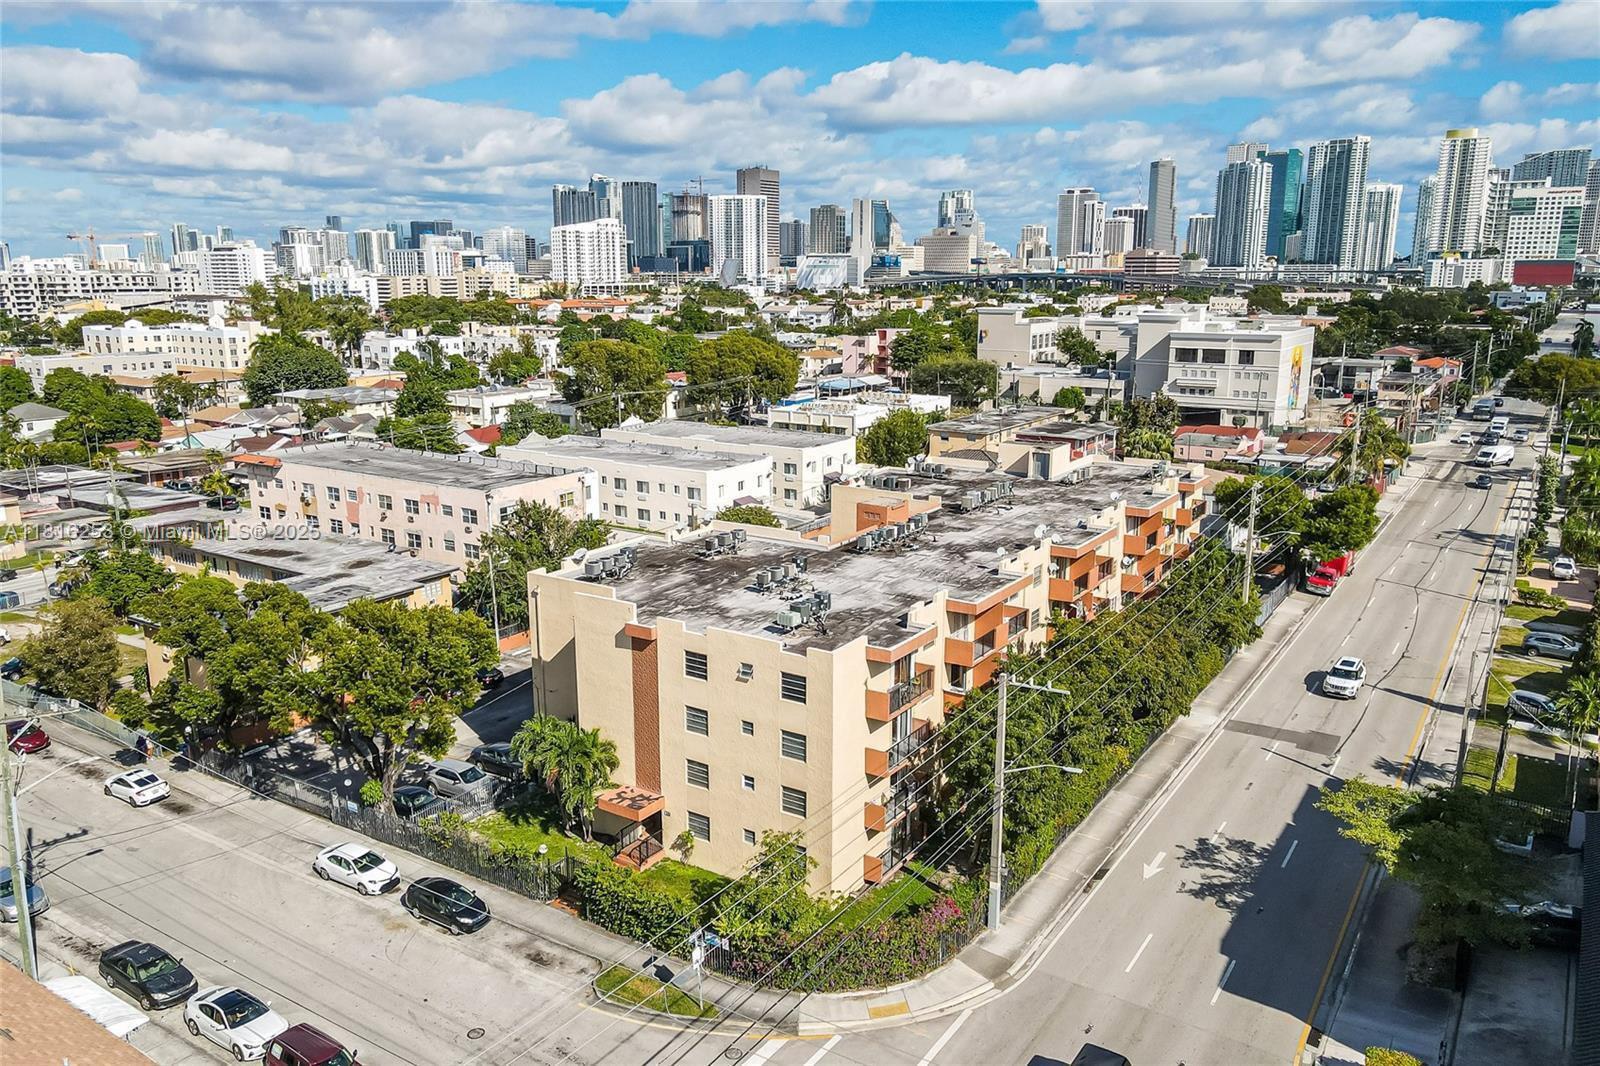
Active
$565,000
3
bds
|
3
ba
|
1,328
sqft
|
built
2023
12210 NW 24th Pl, Miami, FL 33167
$-1,711
Cash flow
-15.8%
Cash-on-Cash Return
2.5%
Cap rate
0.5%
Rent to Value Ratio